Matlab的gui界面设计实例练习
- 格式:doc
- 大小:92.00 KB
- 文档页数:5
用MATLAB制作图形用户界面MATLAB是一种流行的科学计算软件,它不仅在数值计算和数据分析领域有着广泛的应用,还提供了一种高效的界面设计工具,使得用户可以自定义和制作自己的图形用户界面(GUI)。
通过创建自定义的GUI,用户可以简化复杂操作,提高工作效率,下面就让我们来学习如何用MATLAB制作图形用户界面。
MATLAB的图形用户界面主要由以下几部分组成:窗口:窗口是GUI的基本元素,它提供了一个空间,用户可以在其中添加和组织各种控件(如按钮、文本框等)。
控件:控件是GUI中的基本元素,它们可以接收用户的输入,并在窗口中显示出来。
例如,按钮、文本框、滑动条等都是常见的控件。
菜单:菜单是GUI中的一种导航工具,它们可以链接到其他窗口或者函数,方便用户进行操作。
工具栏:工具栏是GUI中的一种快速执行工具,它们提供了一键执行常见操作的快捷方式。
下面就让我们通过一个简单的例子来学习如何用MATLAB制作一个简单的图形用户界面:打开MATLAB,在命令窗口输入“guide”,并按Enter键。
这将打开GUI设计工具。
在打开的GUI设计工具中,选择“Blank GUI”并点击“OK”,进入GUI编辑器。
在GUI编辑器中,你可以看到一个空白的窗口和一些控件。
你可以通过拖拽的方式将这些控件添加到窗口中。
选中你添加的控件,在右侧的“Properties”面板中,你可以修改控件的属性,如颜色、字体、大小等。
在设计完成后,点击“Save”按钮,保存你的GUI。
此时,MATLAB会生成一个.fig文件和一个.m文件。
其中.fig文件是GUI的图形文件,而.m文件包含了GUI的代码。
在生成的.m文件中,你可以编写控件的事件处理函数。
例如,当用户点击按钮时,应该执行什么样的操作。
在编写完事件处理函数后,你就可以运行你的GUI了。
在命令窗口输入“edit(gcf)”,然后按Enter键,就可以打开你的GUI并进行测试了。
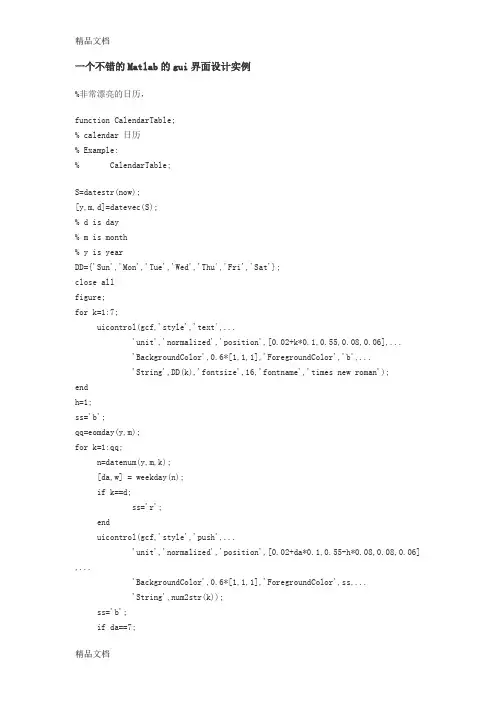
一个不错的Matlab的gui界面设计实例%非常漂亮的日历,function CalendarTable;% calendar 日历% Example:% CalendarTable;S=datestr(now);[y,m,d]=datevec(S);% d is day% m is month% y is yearDD={'Sun','Mon','Tue','Wed','Thu','Fri','Sat'};close allfigure;for k=1:7;uicontrol(gcf,'style','text',...'unit','normalized','position',[0.02+k*0.1,0.55,0.08,0.06],...'BackgroundColor',0.6*[1,1,1],'ForegroundColor','b',...'String',DD(k),'fontsize',16,'fontname','times new roman');endh=1;ss='b';qq=eomday(y,m);for k=1:qq;n=datenum(y,m,k);[da,w] = weekday(n);if k==d;ss='r';enduicontrol(gcf,'style','push',...'unit','normalized','position',[0.02+da*0.1,0.55-h*0.08,0.08,0.06] ,...'BackgroundColor',0.6*[1,1,1],'ForegroundColor',ss,...'String',num2str(k));ss='b';if da==7;h=h+1;endenduicontrol(gcf,'style','push',...'unit','normalized','position',[0.6,0.66,0.12,0.08],...'BackgroundColor',0.6*[1,1,1],'ForegroundColor',ss,...'String','clock','fontsize',18,'fontname','times new roman');Tq=uicontrol(gcf,'style','push',...'unit','normalized','position',[0.74,0.66,0.17,0.08],...'BackgroundColor',0.6*[1,1,1],'ForegroundColor',[0.1,0.9,0.9],...'fontsize',18,'fontname','times new roman');sq='The calendar';uicontrol(gcf,'style','push',...'unit','normalized','position',[0.14,0.86,0.37,0.08],...'BackgroundColor',0.6*[1,1,1],'ForegroundColor',[0.1,0.9,0.9],...'fontsize',18,'fontname','times new roman','string',sq);trywhile 1set(Tq,'String',datestr(now,13));pause(1);endend计算万年历的Matlab程序(2008-12-21 13:59:19)标签:matlab万年历杂谈分类:Matlab实例function test_calendar(year,month)% 输入年份,月份,打印这个月的月历run = 0;ping = 0;fprintf('\n%s %s %s %s %s %s %s\n',...'日','一','二','三','四','五','六');% 计算从第一年到前一年的闰年和平年的个数for i =1:year-1if (mod(i,4)==0 & mod(i,100)~=0) | mod(i,400)==0run = run+1;elseping = ping+1;endend% 计算从第一年到当年前一个月的天数sum = 366*run+365*ping;for i = 1:month-1sum = sum+monthday(year,i);end% 获得这个月的天数n = monthday(year,month);temp = zeros(n,1);sum = sum+1;% 计算这个月第一天是星期几wkd = mod(sum,7);for i = 1:ntemp(wkd+i) = i;endl = 1;m = 1;% 打印日历for i = 1:length(temp)if temp(i) ==0temp2(l,m) = ' ';fprintf(' ');m = m+1;elsetemp2(l,m) = temp(i);if temp(i) >= 10fprintf('%d ',temp(i));elsefprintf('%d ',temp(i));endm = m+1;endif mod(i,7)==0fprintf('\n');m = 1;l = l+1;endendfprintf('\n');% 闰年和平年每月的天数function out = monthday(year,i)if mod(year,4)==0 & mod(year,100)~=0 | mod(year,400)==0 data = [31 29 31 30 31 30 31 31 30 31 30 31]; elsedata = [31 28 31 30 31 30 31 31 30 31 30 31]; endout = data(i);举例:输入:>> test_calendar(2008,12)返回:日一二三四五六1 2 3 4 5 67 8 9 10 11 12 1314 15 16 17 18 19 2021 22 23 24 25 26 2728 29 30 31闲来无事,学了一些Matlab GUI的基础知识,想找个东西练一下手。
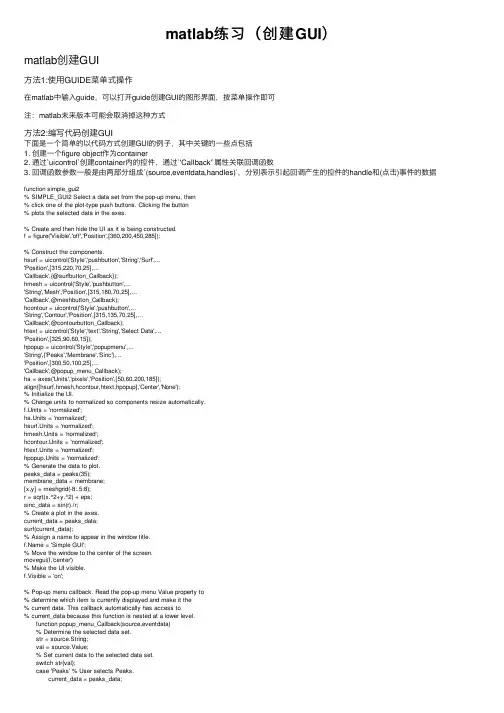
matlab练习(创建GUI)matlab创建GUI⽅法1:使⽤GUIDE菜单式操作在matlab中输⼊guide,可以打开guide创建GUI的图形界⾯,按菜单操作即可注:matlab未来版本可能会取消掉这种⽅式⽅法2:编写代码创建GUI下⾯是⼀个简单的以代码⽅式创建GUI的例⼦,其中关键的⼀些点包括1. 创建⼀个figure object作为container2. 通过`uicontrol`创建container内的控件,通过`'Callback'`属性关联回调函数3. 回调函数参数⼀般是由两部分组成`(source,eventdata,handles)`,分别表⽰引起回调产⽣的控件的handle和(点击)事件的数据function simple_gui2% SIMPLE_GUI2 Select a data set from the pop-up menu, then% click one of the plot-type push buttons. Clicking the button% plots the selected data in the axes.% Create and then hide the UI as it is being constructed.f = figure('Visible','off','Position',[360,200,450,285]);% Construct the components.hsurf = uicontrol('Style','pushbutton','String','Surf',...'Position',[315,220,70,25],...'Callback',{@surfbutton_Callback});hmesh = uicontrol('Style','pushbutton',...'String','Mesh','Position',[315,180,70,25],...'Callback',@meshbutton_Callback);hcontour = uicontrol('Style','pushbutton',...'String','Contour','Position',[315,135,70,25],...'Callback',@contourbutton_Callback);htext = uicontrol('Style','text','String','Select Data',...'Position',[325,90,60,15]);hpopup = uicontrol('Style','popupmenu',...'String',{'Peaks','Membrane','Sinc'},...'Position',[300,50,100,25],...'Callback',@popup_menu_Callback);ha = axes('Units','pixels','Position',[50,60,200,185]);align([hsurf,hmesh,hcontour,htext,hpopup],'Center','None');% Initialize the UI.% Change units to normalized so components resize automatically.f.Units = 'normalized';ha.Units = 'normalized';hsurf.Units = 'normalized';hmesh.Units = 'normalized';hcontour.Units = 'normalized';htext.Units = 'normalized';hpopup.Units = 'normalized';% Generate the data to plot.peaks_data = peaks(35);membrane_data = membrane;[x,y] = meshgrid(-8:.5:8);r = sqrt(x.^2+y.^2) + eps;sinc_data = sin(r)./r;% Create a plot in the axes.current_data = peaks_data;surf(current_data);% Assign a name to appear in the window title. = 'Simple GUI';% Move the window to the center of the screen.movegui(f,'center')% Make the UI visible.f.Visible = 'on';% Pop-up menu callback. Read the pop-up menu Value property to% determine which item is currently displayed and make it the% current data. This callback automatically has access to% current_data because this function is nested at a lower level. function popup_menu_Callback(source,eventdata) % Determine the selected data set. str = source.String; val = source.Value; % Set current data to the selected data set. switch str{val}; case 'Peaks' % User selects Peaks. current_data = peaks_data; case 'Membrane' % User selects Membrane. current_data = membrane_data; case 'Sinc' % User selects Sinc. current_data = sinc_data; end end% Push button callbacks. Each callback plots current_data in the% specified plot type. function surfbutton_Callback(source,eventdata) % Display surf plot of the currently selected data. surf(current_data); end function meshbutton_Callback(source,eventdata) % Display mesh plot of the currently selected data. mesh(current_data); end function contourbutton_Callback(source,eventdata) % Display contour plot of the currently selected data. contour(current_data); endendGUI展⽰⽅法3:利⽤AppDesigner和⽅法⼀的Guide类似总结我们有三种不同⽅式在matlab中创建简单的GUI程序,其中⽐较推荐的是使⽤编程的⽅式。
![matlabGUI人机用户界面设计[6]](https://uimg.taocdn.com/3717f23424c52cc58bd63186bceb19e8b8f6ec99.webp)
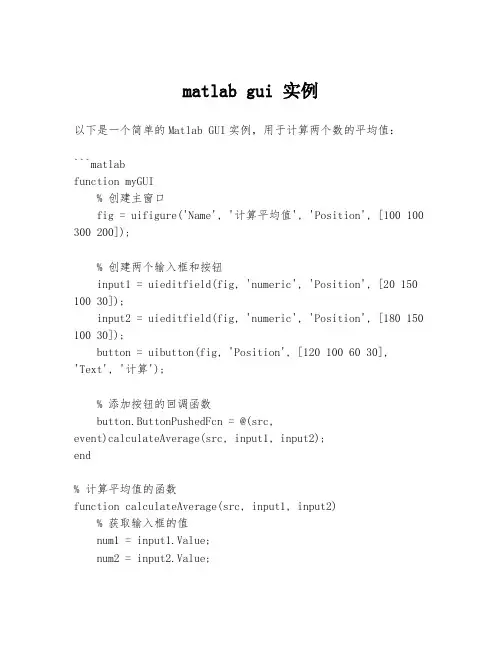
matlab gui 实例以下是一个简单的Matlab GUI实例,用于计算两个数的平均值:```matlabfunction myGUI% 创建主窗口fig = uifigure('Name', '计算平均值', 'Position', [100 100 300 200]);% 创建两个输入框和按钮input1 = uieditfield(fig, 'numeric', 'Position', [20 150 100 30]);input2 = uieditfield(fig, 'numeric', 'Position', [180 150 100 30]);button = uibutton(fig, 'Position', [120 100 60 30],'Text', '计算');% 添加按钮的回调函数button.ButtonPushedFcn = @(src,event)calculateAverage(src, input1, input2);end% 计算平均值的函数function calculateAverage(src, input1, input2)% 获取输入框的值num1 = input1.Value;num2 = input2.Value;% 计算平均值average = (num1 + num2) / 2;% 显示结果对话框uialert(src.Parent, sprintf('平均值为:%g', average), '结果', 'Icon', 'info');end```你可以将以上代码保存为一个.m文件,然后在Matlab命令窗口中运行`myGUI`函数,即可启动GUI应用程序。
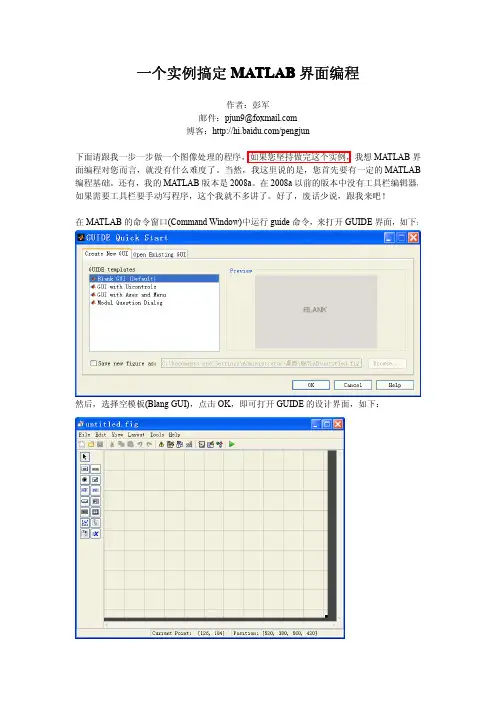
一个实例搞定MATLAB界面编程作者:彭军邮件:pjun9@博客:/pengjun下面请跟我一步一步做一个图像处理的程序,如果您坚持做完这个实例,我想MATLAB界面编程对您而言,就没有什么难度了。
当然,我这里说的是,您首先要有一定的MATLAB 编程基础。
还有,我的MATLAB版本是2008a。
在2008a以前的版本中没有工具栏编辑器,如果需要工具栏要手动写程序,这个我就不多讲了。
好了,废话少说,跟我来吧!在MATLAB的命令窗口(Command Window)中运行guide命令,来打开GUIDE界面,如下:然后,选择空模板(Blang GUI),点击OK,即可打开GUIDE的设计界面,如下:点击工具栏上的菜单编辑器(Menu Editor),打开菜单编辑器,如下:在Menu Bar中新建一个菜单项,名字为“文件”,其他设置请看下图:在“文件”菜单下添加菜单项:“打开”,“保存”,“退出”。
见下图:如果需要在菜单项“退出”上面添加一个分割线的话,选中“Separator above this item”就行了。
保存我的界面为pjimage.fig.保存完毕之后,会自动打开pjimage.m文件,而我们所有的程序都是要写在这个M文件里面的。
在编程中,我们的每一个鼠标动作都对应一个Callback 函数。
那么我们的菜单项也是如此的。
在界面上,单击鼠标右键选择“Property Inspector”,即可打开属性窗口。
当我们点击不同的控件时,其对应的属性都会在这里显示,我们可以进行修改。
最主要的属性莫过于Tag属性和String属性。
设置当前Figure窗口的Tag属性为:figure_pjimage,窗口的标题(Name属性)为:图像处理实例。
如下:然后,点击工具栏的保存按钮。
之后,点击工具栏的运行按钮(Run Figure)。
注意,工具栏的图标都会有提示的,像运行按钮的提示就是Run Figure.我们会看到如下的界面:那说明,我们保存的.fig文件的目录不是当前目录,但是没关系啊,我们只要点击“Change Directory”来改变当前目录。
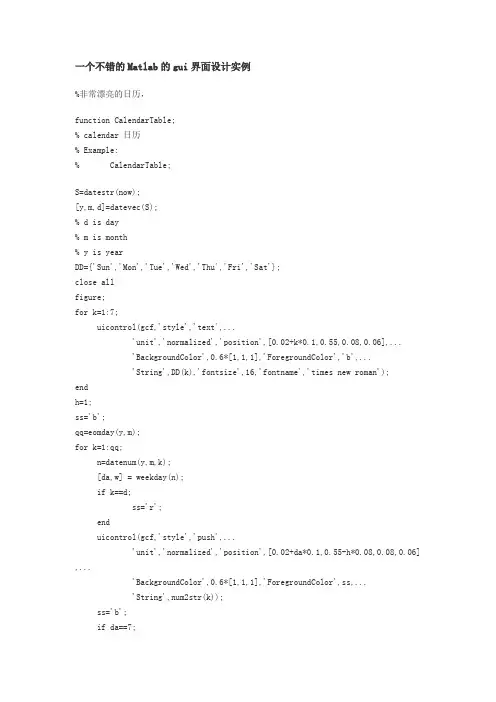
一个不错的Matlab的gui界面设计实例%非常漂亮的日历,function CalendarTable;% calendar 日历% Example:% CalendarTable;S=datestr(now);[y,m,d]=datevec(S);% d is day% m is month% y is yearDD={'Sun','Mon','Tue','Wed','Thu','Fri','Sat'};close allfigure;for k=1:7;uicontrol(gcf,'style','text',...'unit','normalized','position',[0.02+k*0.1,0.55,0.08,0.06],...'BackgroundColor',0.6*[1,1,1],'ForegroundColor','b',...'String',DD(k),'fontsize',16,'fontname','times new roman');endh=1;ss='b';qq=eomday(y,m);for k=1:qq;n=datenum(y,m,k);[da,w] = weekday(n);if k==d;ss='r';enduicontrol(gcf,'style','push',...'unit','normalized','position',[0.02+da*0.1,0.55-h*0.08,0.08,0.06],... 'BackgroundColor',0.6*[1,1,1],'ForegroundColor',ss,...'String',num2str(k));ss='b';if da==7;h=h+1;endenduicontrol(gcf,'style','push',...'unit','normalized','position',[0.6,0.66,0.12,0.08],...'BackgroundColor',0.6*[1,1,1],'ForegroundColor',ss,...'String','clock','fontsize',18,'fontname','times new roman');Tq=uicontrol(gcf,'style','push',...'unit','normalized','position',[0.74,0.66,0.17,0.08],...'BackgroundColor',0.6*[1,1,1],'ForegroundColor',[0.1,0.9,0.9],...'fontsize',18,'fontname','times new roman');sq='The calendar';uicontrol(gcf,'style','push',...'unit','normalized','position',[0.14,0.86,0.37,0.08],...'BackgroundColor',0.6*[1,1,1],'ForegroundColor',[0.1,0.9,0.9],...'fontsize',18,'fontname','times new roman','string',sq);trywhile 1set(Tq,'String',datestr(now,13));pause(1);endend计算万年历的Matlab程序(2008-12-21 13:59:19)标签:matlab万年历杂谈分类:Matlab实例function test_calendar(year,month)% 输入年份,月份,打印这个月的月历run = 0;ping = 0;fprintf('\n%s %s %s %s %s %s %s\n',...'日','一','二','三','四','五','六');% 计算从第一年到前一年的闰年和平年的个数for i =1:year-1if (mod(i,4)==0 & mod(i,100)~=0) | mod(i,400)==0run = run+1;elseping = ping+1;endend% 计算从第一年到当年前一个月的天数sum = 366*run+365*ping;for i = 1:month-1sum = sum+monthday(year,i);end% 获得这个月的天数n = monthday(year,month);temp = zeros(n,1);sum = sum+1;% 计算这个月第一天是星期几wkd = mod(sum,7);for i = 1:ntemp(wkd+i) = i;endl = 1;m = 1;% 打印日历for i = 1:length(temp)if temp(i) ==0temp2(l,m) = ' ';fprintf(' ');m = m+1;elsetemp2(l,m) = temp(i);if temp(i) >= 10fprintf('%d ',temp(i)); elsefprintf('%d ',temp(i)); endm = m+1;endif mod(i,7)==0fprintf('\n');m = 1;l = l+1;endendfprintf('\n');% 闰年和平年每月的天数function out = monthday(year,i)if mod(year,4)==0 & mod(year,100)~=0 | mod(year,400)==0data = [31 29 31 30 31 30 31 31 30 31 30 31];elsedata = [31 28 31 30 31 30 31 31 30 31 30 31];endout = data(i);举例:输入:>> test_calendar(2008,12)返回:日一二三四五六1 2 3 4 5 67 8 9 10 11 12 1314 15 16 17 18 19 2021 22 23 24 25 26 2728 29 30 31闲来无事,学了一些Matlab GUI的基础知识,想找个东西练一下手。
数字图像处理作业一姓名:学号:2013212189 班级:20132116021.GUI开发基本方法:(1)设置GUI界面的布局,添加菜单栏,工具栏,以及其他需要的控件,并修改控件的大小,位置等使界面美观。
(2)根据需要修改控件的属性,如:tag,string,enable,font,等属性。
(3)通过callback属性编写控件的回调函数以实现控件的功能。
2.控件之间协同工作的方法:(1)通过tag属性程序可以区分不同的按钮。
(2)通过handles句柄可以调用不同控件的不同属性,实现控件之间属性的互相调用。
通过set()/get()函数修改控件属性。
(3)通过global设置全局变量,或通过setappdata()/getappdata ()函数来实现控件之间数据的调用。
(4)通过feval()函数,实现不同控件回调函数的互相调用。
3.作业GUI的简单描述:(1)实现功能:可以通过菜单栏,工具栏,或者界面按钮选择图片,将图片转化为二值图片格式,显示图片,并可以保存图片。
(2)技术描述:a.通过[] = uigetfile()函数,[]=uiputfile()函数来选择或保存图片。
通过if isequal(filename,0) || isequal(pathname,0)来判断是否选择文件路径,避免在取消时出现错误。
b.通过set(handles.text_filename,'string',fpath);显示打开图片的路径名称。
c.通过imread(),imshow(),im2bw()函数来获取图片数据,显示图片和将图片转换为二值格式。
d.当图片没有进行二值化修改时,菜单按钮和工具栏的保存按钮应该是不可选的,所以在程序的开始*_OpeningFcn中,将按钮的‘Enable’属性设置为off。
set(handles.file_save,'Enable','off');set(handles.tool_save,'Enable','off');e.在菜单栏的退出按钮执行退出之前,应该先判断修改后的图片是否保存。
matlab gui界面设计实例
以下是一个简单的MATLAB GUI界面设计实例:
1. 打开MATLAB软件并创建一个新的GUI文件,首先需要添加一个静态文本标签来说明该程序的用途。
2. 在接下来的步骤中,我们将添加一个单选按钮和一组复选框,允许用户选择他们的喜好和选项。
3. 其他元素可添加日期选择器,文本框和按钮等等。
4. 最后,我们需要添加一个事件处理程序,以便处理用户点击“提交”按钮时的操作。
通过这样一个简单的实例,我们可以学习到MATLAB GUI界面的基本设计原则和步骤,以及如何处理用户交互事件并使用MATLAB功能实现功能。
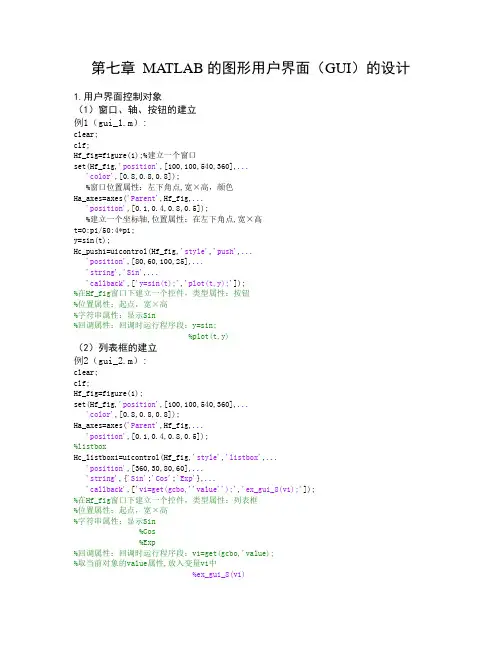
第七章MATLAB的图形用户界面(GUI)的设计1.用户界面控制对象(1)窗口、轴、按钮的建立例1(gui_1.m):clear;clf;Hf_fig=figure(1);%建立一个窗口set(Hf_fig,'position',[100,100,540,360],...'color',[0.8,0.8,0.8]);%窗口位置属性:左下角点,宽×高,颜色Ha_axes=axes('Parent',Hf_fig,...'position',[0.1,0.4,0.8,0.5]);%建立一个坐标轴,位置属性:在左下角点,宽×高t=0:pi/50:4*pi;y=sin(t);Hc_push1=uicontrol(Hf_fig,'style','push',...'position',[80,60,100,25],...'string','Sin',...'callback',['y=sin(t);','plot(t,y);']);%在Hf_fig窗口下建立一个控件,类型属性:按钮%位置属性:起点,宽×高%字符串属性:显示Sin%回调属性:回调时运行程序段:y=sin;%plot(t,y)(2)列表框的建立例2(gui_2.m):clear;clf;Hf_fig=figure(1);set(Hf_fig,'position',[100,100,540,360],...'color',[0.8,0.8,0.8]);Ha_axes=axes('Parent',Hf_fig,...'position',[0.1,0.4,0.8,0.5]);%listboxHc_listbox1=uicontrol(Hf_fig,'style','listbox',...'position',[360,30,80,60],...'string',{'Sin';'Cos';'Exp'},...'callback',['v1=get(gcbo,''value'');','ex_gui_8(v1);']);%在Hf_fig窗口下建立一个控件,类型属性:列表框%位置属性:起点,宽×高%字符串属性:显示Sin%Cos%Exp%回调属性:回调时运行程序段:v1=get(gcbo,'value);%取当前对象的value属性,放入变量v1中%ex_gui_8(v1)%调用自定义函数ex_gui_8,%传递参数v1子程序的调用(ex_gui_8)function y=ex_gui_8(v)t=0:pi/50:4*pi;switch vcase 1y=sin(t);case 2y=cos(t);case 3y=exp(t);endplot(t,y);(3)菜单的建立例3(gui_3.m):clear;clf;Hf_fig=figure(1);set(Hf_fig,'position',[100,100,540,360],...'color',[0.8,0.8,0.8]);Ha_axes=axes('Parent',Hf_fig,...'position',[0.1,0.4,0.8,0.5]);t=0:pi/50:4*pi;Hm_m1=uimenu(gcf,'Label','User');%建立顶菜单项UserHm_plot=uimenu(Hm_m1,'Label','Plot');%在顶菜单项User下建立分菜单项PlotHm_sin=uimenu(Hm_plot,'Label','Sin',...'callback',['y=sin(t);','plot(t,y);']);%在分菜单项Plot下建立子菜单项Sin%回调时运行程序y=sin(t),plot(t,y)Hm_cos=uimenu(Hm_plot,'Label','Cos',...'separator','on',...'callback',['y=cos(t);','plot(t,y);']);2.用GUI设计工具设计图形用户界面(GUI)设计(1)GUI设计工具的启动GUI设计工具用GUIDE命令启动,或点相应菜单项:File—New—Gui—Blank GUI(2)GUI编程举例:①建立一个按钮与坐标轴a)点菜单项:File—New—Gui—Blank GUIb)点按钮、坐标轴图标,拖到图中,调整大小c)光标移到按钮位置,点图标property Inspecto r,点属性string,写sin。
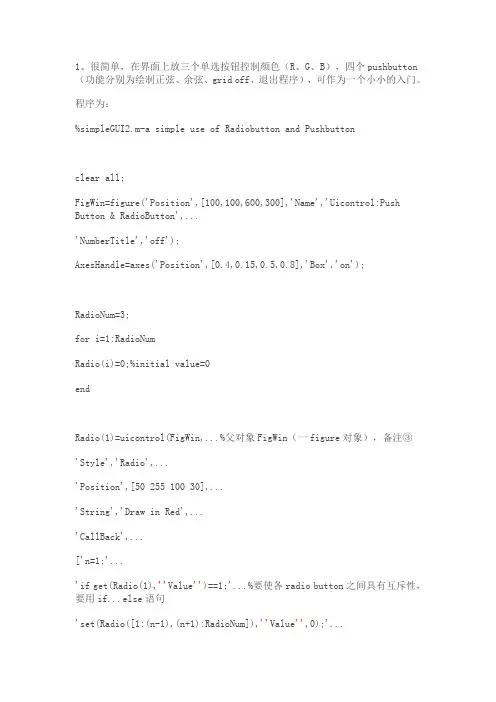
1、很简单,在界面上放三个单选按钮控制颜色(R、G、B),四个pushbutton (功能分别为绘制正弦、余弦、grid off、退出程序),可作为一个小小的入门。
程序为:%simpleGUI2.m-a simple use of Radiobutton and Pushbuttonclear all;FigWin=figure('Position',[100,100,600,300],'Name','Uicontrol:Push Button & RadioButton',...'NumberTitle','off');AxesHandle=axes('Position',[0.4,0.15,0.5,0.8],'Box','on');RadioNum=3;for i=1:RadioNumRadio(i)=0;%initial value=0endRadio(1)=uicontrol(FigWin,...%父对象FigWin(一figure对象),备注③'Style','Radio',...'Position',[50 255 100 30],...'String','Draw in Red',...'CallBack',...['n=1;'...'if get(Radio(1),''Value'')==1;'...%要使各radio button之间具有互斥性,要用if...else语句'set(Radio([1:(n-1),(n+1):RadioNum]),''Value'',0);'...'else;'...%要加上分号,一种规定?参备注①'set(Radio(1),''Value'',1);'...'end;'...'ColorStr=''r'';'...'set(FunHandle,''Color'',''red'')']);%曲线颜色根据radio button的选项实时变化,ColorStr是一个全局变量Radio(2)=uicontrol(FigWin,...'Style','Radio',...'Position',[50 215 100 30],...'String','Draw in Green',...'CallBack',...['n=2;'...'if get(Radio(2),''Value'')==1;'...'set(Radio([1:(n-1),(n+1):RadioNum]),''Value'',0);'...'else;'...'set(Radio(2),''Value'',1);'...'end;'...'ColorStr=''g'';'...'set(FunHandle,''Color'',''green'')']);Radio(3)=uicontrol(FigWin,...'Style','Radio',...'Position',[50 175 100 30],...'String','Draw in Blue',...'CallBack',...['n=3;'...'if get(Radio(3),''Value'')==1;'...'set(Radio([1:(n-1),(n+1):RadioNum]),''Value'',0);'...'else;'...'set(Radio(3),''Value'',1);'...'end;'...'ColorStr=''b'';'...'set(FunHandle,''Color'',''blue'')']);push1=uicontrol(FigWin,...'Style','pushbutton',...'Position',[50 135 100 30],...'String','Plot sin(x)',...'CallBack',...['subplot(AxesHandle);' ...%注意父对象是AxesHandle而非FigWin!参备注②'x=0:.1:4*pi;'...'FunHandle=plot(x,sin(x),ColorStr);'...%ColorStr变量的值受radiobutton控制'axis([0 4*pi -1 1]);'...'grid on;'...'xlabel(''x'');'...'ylabel(''y=sin(x)'');']);push2=uicontrol(FigWin,...'Style','pushbutton',...'Position',[50 95 100 30],...'String','Plot cos(x)',...'CallBack',...['subplot(AxesHandle);' ...'x=0:.1:4*pi;'...'FunHandle=plot(x,cos(x),ColorStr);'... 'axis([0 4*pi -1 1]);'...'grid on;'...'xlabel(''x'');'...'ylabel(''y=cos(x)'');']);push3=uicontrol(FigWin,...'Style','pushbutton',...'Position',[50 55 100 30],...'String','Grid off',...'CallBack','grid off;');%参备注①push4=uicontrol(FigWin,...'Style','pushbutton',...'Position',[50 15 100 30],...'String','Exit',...'CallBack','close(FigWin)');%绘制初始曲线ColorStr='r';set(Radio(1),'Value',1);X=0:0.1:4*pi;FunHandle=plot(X,sin(X),ColorStr); axis([0 4*pi -1 1]);xlabel('x');ylabel('y=sin(x)');grid on;运行结果://有些注意的地方用红色标识。
近年来,MATLAB在科学计算和工程领域中的应用变得越来越广泛。
其中,GUI(Graphical User Interface)程序设计作为MATLAB的一个重要应用领域,对于帮助用户更直观地理解和使用MATLAB具有重要意义。
本文将以MATLAB设计GUI程序为主题,探讨其原理、实现方法和实际例题,并对其进行深入解析和探讨。
1. GUI程序设计的基本原理在MATLAB中,GUI程序设计主要通过图形用户界面工具包(GUIDE)来实现。
GUIDE工具包提供了一系列可以直观拖放的元素,包括按钮、文本框、下拉菜单等,用户可以通过拖拉这些元素的方式来设计出自己理想的界面。
MATLAB还提供了丰富的回调函数,用户可以将不同控件的回调函数与自定义函数进行绑定,实现交互式的操作。
2. GUI程序设计的实现方法为了更深入地理解GUI程序设计,我们可以以一个简单的例子来说明其实现方法。
假设我们需要设计一个简单的温度转换器,用户可以输入摄氏温度,然后通过点击按钮来实现摄氏温度到华氏温度的转换。
我们可以通过GUIDE工具包来设计界面,添加一个文本框用于输入摄氏温度,一个按钮用于触发转换操作,以及一个用于显示结果的文本框。
我们可以在回调函数中编写转换的过程,当用户点击按钮时,根据用户输入的摄氏温度进行计算,并将结果显示在结果文本框中。
3. 实际例题:温度转换器GUI程序设计现在,让我们按照上面的思路来实际设计一个温度转换器的GUI程序。
我们打开MATLAB并新建一个GUI程序,接着使用GUIDE工具包来设计界面,按照前文描述的方法添加文本框、按钮和结果文本框。
我们为按钮添加点击事件的回调函数,编写摄氏温度到华氏温度的转换算法,并将结果显示在结果文本框中。
我们保存并运行程序,测试其功能和效果。
4. 总结与思考通过上述例题的实际操作,我们更深入地理解了MATLAB的GUI程序设计原理和实现方法。
GUI程序设计能够帮助我们更直观地操作MATLAB,提高使用效率和便利性。
一个实例搞定MATLAB界面编程作者:彭军邮件:pjun9@博客:/pengjun下面请跟我一步一步做一个图像处理的程序,如果您坚持做完这个实例,我想MATLAB界面编程对您而言,就没有什么难度了。
当然,我这里说的是,您首先要有一定的MATLAB 编程基础。
还有,我的MATLAB版本是2008a。
在2008a以前的版本中没有工具栏编辑器,如果需要工具栏要手动写程序,这个我就不多讲了。
好了,废话少说,跟我来吧!在MATLAB的命令窗口(Command Window)中运行guide命令,来打开GUIDE界面,如下:然后,选择空模板(Blang GUI),点击OK,即可打开GUIDE的设计界面,如下:点击工具栏上的菜单编辑器(Menu Editor),打开菜单编辑器,如下:在Menu Bar中新建一个菜单项,名字为“文件”,其他设置请看下图:在“文件”菜单下添加菜单项:“打开”,“保存”,“退出”。
见下图:如果需要在菜单项“退出”上面添加一个分割线的话,选中“Separator above this item”就行了。
保存我的界面为pjimage.fig.保存完毕之后,会自动打开pjimage.m文件,而我们所有的程序都是要写在这个M文件里面的。
在编程中,我们的每一个鼠标动作都对应一个Callback 函数。
那么我们的菜单项也是如此的。
在界面上,单击鼠标右键选择“Property Inspector”,即可打开属性窗口。
当我们点击不同的控件时,其对应的属性都会在这里显示,我们可以进行修改。
最主要的属性莫过于Tag属性和String属性。
设置当前Figure窗口的Tag属性为:figure_pjimage,窗口的标题(Name属性)为:图像处理实例。
如下:然后,点击工具栏的保存按钮。
之后,点击工具栏的运行按钮(Run Figure)。
注意,工具栏的图标都会有提示的,像运行按钮的提示就是Run Figure.我们会看到如下的界面:那说明,我们保存的.fig文件的目录不是当前目录,但是没关系啊,我们只要点击“Change Directory”来改变当前目录。
(1 利用Matlab 的图形用户界面(GUI )功能,设计与实现实验主界面;(2 实现在“数值计算”图形用户界面中的各项数值计算,如实现Matlab 的线性方程组的求解、数据统计与分析、数值插值、曲线拟合、常微分方程的数值求解等数值计算;(3 利用Matlab 的二维、三维绘图功能,实现图形用户界面(GUI )中的数值计算的可视化,即给出数值计算实例的同时实现该实例的图形化描述。
如下图给出了一个简单的GUI 界面,学生可以参考如下图设计出自己的GUI 界面。
figure('Color' ,[1,1,1],'Position' ,[100,100,700,600],...'Name' , '' , ...'NumberTitle' , 'off' , 'MenuBar' , 'none' ;uicontrol('Style' , 'Frame' , 'Position' ,[0,0.08,0.45,1],...'Units' , 'normalized' , 'Back' ,[0,1,1];XIANQIU=['a=str2num(get(xishu,''String'';', ...'b=str2num(get(changshu,''String'';', ...'b=b'';x=a\b;', ...'set(jieguo,''string'',x;'];uicontrol('Style' , 'Push' , 'Position' ,[0.02,0.92,0.20,0.06],...'String' , 'ÏßÐÔ·½³Ì×éÇó½â', 'Units' , 'normalized' , 'Call' ,XIANQIU;uicontrol('Style' , 'Text' , 'Position' ,[0.01,0.83,0.1,0.05],... 'Units' , 'normalized' , 'Horizontal' , 'center' , ...'String' , 'ϵÊý¾ØÕó', 'Back' ,[0,1,1];xishu=uicontrol('Style' , 'Edit' , 'Position' ,[0.16,0.83,0.25,0.06],... 'Units' ,'normalized' , 'Back' ,[0,1,0];uicontrol('Style' , 'Text' , 'Position' ,[0.01,0.72,0.1,0.05],... 'Units' , 'normalized' , 'Horizontal' , 'center' , ...'String' , '³£ÊýÏî¾ØÕó', 'Back' ,[0,1,1];changshu=uicontrol('Style' , 'Edit' , 'Position' ,[0.16,0.72,0.25,0.06],.. .'Units' , 'normalized' , 'Back' ,[0,1,0];uicontrol('Style' , 'Push' , 'Position' ,[0.02,0.63,0.20,0.06],... 'String' ,'Êýֵͳ¼ÆÓë·ÖÎö';uicontrol('Style' , 'Text' , 'Position' ,[0.23,0.63,0.2,0.05],... 'Units' , 'normalized' , 'Horizontal' , 'center' , ...'String' , 'ÔÚϵÊý¾ØÕóÊäÈë¿òÖÐÊäÈëÒª·ÖÎöµÄ¾ØÕó', 'Back' ,[0,1,1];uicontrol('Style' , 'Push' , 'Position' ,[0.06,0.55,0.1,0.05],... 'String' , 'ÊýÖµ²åÖµ';uicontrol('Style' , 'Push' , 'Position' ,[0.22,0.55,0.1,0.05],... 'String' , 'ÇúÏßÄâºÏ';uicontrol('Style' , 'Text' , 'Position' ,[0.005,0.45,0.05,0.05],... 'Units' , 'normalized' , 'Horizontal' , 'center' , ...'String' , 'X' , 'Back' ,[0,1,1];chazhi=uicontrol('Style' , 'Edit' , 'Position' ,[0.05,0.45,0.15,0.06],... 'Units' ,'normalized' , 'Back' ,[0,1,0];uicontrol('Style' , 'Text' , 'Position' ,[0.2,0.45,0.05,0.05],... 'Units' , 'normalized' , 'Horizontal' , 'center' , ...'String' , 'Y' , 'Back' ,[0,1,1];nihe=uicontrol('Style' , 'Edit' , 'Position' ,[0.25,0.45,0.15,0.06],... 'Units' ,'normalized' , 'Back' ,[0,1,0];XIANXING=['s=(get(changwei,''String'';', ...'c=(get(tiaojian,''String'';', ...'c_f=dsolve(''s'',''b'',''x'';', ...'set(jieguo,''string'',char(c_f;'];uicontrol('Style' , 'Push' , 'Position' ,[0.02,0.35,0.25,0.06],...'String' , '³£Î¢·Ö·½³ÌÊýÖµÇó½â', 'Units' , 'normalized' , 'Call' ,XIANXING;chengwei=uicontrol('Style' , 'Edit' , 'Position' ,[0.16,0.25,0.25,0.06],.. .'Units' , 'normalized' , 'Back' ,[0,1,0];uicontrol('Style' , 'Text' , 'Position' ,[0.01,0.25,0.1,0.05],... 'Units' , 'normalized' ,'Horizontal' , 'center' , ...'String' , '΢·Ö·½³Ì', 'Back' ,[0,1,1];tiaojian=uicontrol('Style' , 'Edit' , 'Position' ,[0.16,0.15,0.25,0.06],.. .'Units' , 'normalized' , 'Back' ,[0,1,0];uicontrol('Style' , 'Text' , 'Position' ,[0.01,0.15,0.1,0.05],... 'Units' , 'normalized' ,'Horizontal' , 'center' , ...'String' , '³õÖµÌõ¼þ', 'Back' ,[0,1,1];h_axes=axes('position' ,[0.5,0.15,0.4,0.4];jieguo=uicontrol('Style' , 'text' , 'Position' ,[0.5,0.6,0.45,0.25],... 'Units' , 'normalized' , 'Back' ,[0,1,0];uicontrol('Style' , 'Text' , 'Position' ,[0.6,0.85,0.3,0.1],... 'Units' , 'normalized' ,'Horizontal' , 'center' , ...'String' , '½á¹û', 'Back' ,[1,1,1],'FontSize' ,35;uicontrol('Style' , 'Push' , 'Position' ,[0.018,0.02,0.08,0.05],... 'String' , 'Í˳ö', 'Units' , 'normalized' , 'Call' , 'close' ;uicontrol('Style' , 'Push' , 'Position' ,[0.65,0.025,0.08,0.05],...'String' , '°¡Êµ´òʵ', 'Units' , 'normalized' , 'Call' , '»æͼº¯Êý°´Å¥';。
matlab gui设计实例以下是一个简单的MATLAB GUI 设计实例,用于绘制正弦曲线:打开MATLAB,新建一个GUI 项目。
在GUI 设计器中,添加一个axes组件,用于绘制图形。
添加一个push button组件,用于触发绘图操作。
添加一个text component,用于显示当前角度值。
双击push button组件,打开callback函数,在其中编写绘图代码:matlabfunction pushbutton1_Callback(hObject, eventdata, handles)% hObject handle to pushbutton1 (see GCBO)% eventdata reserved - to be defined in a future version of MATLAB % handles structure with handles and user data (see GUIDATA)% Get the current angle value from text componentangle = str2double(get(handles.text1,'String'));% Plot the sine curvey = sin(angle * pi/180);plot(handles.axes1, linspace(-2,2,100), y);title('Sine Curve');xlabel('X');ylabel('Y');运行GUI 程序,打开界面,输入角度值并单击“绘图”按钮,即可在axes 组件中绘制正弦曲线。
以上是一个简单的MATLAB GUI 设计实例,通过这个实例可以学习如何在MATLAB 中设计GUI 并添加事件处理程序来响应用户的操作。
matlab gui实例MATLAB GUI实例MATLAB GUI是一种基于图形用户界面的交互式工具,它可以帮助用户快速创建自己的图形界面,并且可以通过简单的拖放操作来实现各种功能。
在本文中,我们将介绍一个简单的MATLAB GUI实例,以帮助初学者更好地理解和掌握这一工具。
首先,我们需要创建一个新的MATLAB GUI。
在MATLAB主界面中,选择“新建”->“GUI”->“App Designer”,然后选择“Blank App”模板。
接下来,我们需要添加一些基本的组件,例如按钮、文本框和列表框。
这些组件可以通过拖放操作从左侧的“组件”面板中添加到GUI窗口中。
在本例中,我们将创建一个简单的计算器应用程序,用户可以通过输入两个数字和选择一个操作符来计算结果。
因此,我们需要添加两个文本框用于输入数字,一个列表框用于选择操作符,一个按钮用于触发计算操作,并且一个文本框用于显示结果。
这些组件可以通过以下代码添加到GUI窗口中:```matlabclassdef Calculator < matlab.apps.AppBase% Properties that correspond to app componentsproperties (Access = public)UIFigure matlab.ui.FigureNumber1EditField matlab.ui.control.NumericEditField Number2EditField matlab.ui.control.NumericEditField OperatorListBox matlab.ui.control.ListBoxCalculateButton matlab.ui.control.ButtonResultEditField matlab.ui.control.NumericEditField end% Callbacks that handle component eventsmethods (Access = private)% Button pushed function: CalculateButtonfunction CalculateButtonPushed(app, event)% Get the input valuesnum1 = app.Number1EditField.Value;num2 = app.Number2EditField.Value;op = app.OperatorListBox.Value;% Calculate the resultswitch opcase '+'result = num1 + num2;case '-'result = num1 - num2;case '*'result = num1 * num2;case '/'result = num1 / num2;end% Display the resultapp.ResultEditField.Value = result; endend% App initialization and constructionmethods (Access = private)% Create UIFigure and componentsfunction createComponents(app)% Create UIFigure and set propertiesapp.UIFigure = uifigure('Name', 'Calculator');app.UIFigure.Position = [100 100 640 480];% Create Number1EditFieldapp.Number1EditField = uieditfield(app.UIFigure,'numeric');app.Number1EditField.Position = [50 400 100 22];% Create Number2EditFieldapp.Number2EditField = uieditfield(app.UIFigure,'numeric');app.Number2EditField.Position = [200 400 100 22];% Create OperatorListBoxapp.OperatorListBox = uilistbox(app.UIFigure);app.OperatorListBox.Items = {'+', '-', '*', '/'};app.OperatorListBox.Position = [350 400 100 80];app.OperatorListBox.Value = '+';% Create CalculateButtonapp.CalculateButton = uibutton(app.UIFigure, 'push'); app.CalculateButton.ButtonPushedFcn = createCallbackFcn(app, @CalculateButtonPushed, true);app.CalculateButton.Position = [500 400 100 22];app.CalculateButton.Text = 'Calculate';% Create ResultEditFieldapp.ResultEditField = uieditfield(app.UIFigure, 'numeric'); app.ResultEditField.Position = [50 300 100 22];app.ResultEditField.Value = 0;endend% App creation and deletionmethods (Access = public)% Construct appfunction app = Calculator% Create UIFigure and componentscreateComponents(app);% Show the figure after all components are createdapp.UIFigure.Visible = 'on';endendend```在上面的代码中,我们定义了一个名为“Calculator”的类,它继承自“matlab.apps.AppBase”类。
本人初学GUI ,针对网上版本的混乱,学得一头雾水,特重新整理如下,供大家参考。
1.首先我们新建一个 GUI 文件:File/New/GUI 如下图所示;选择 Blank GUI(Default),点击 OK 。
2.进入GUI 开发环境以后添加 3个编辑文本框(Edit Text ),2个静态文本框(Static Text ), 和一个Push Button 按钮,布置如下图所示;⑷修改Pushbutton 按钮的属性,“ string 改为“ Add ” “ tag 改为“ add ”⑸另外2个Static 文本就是的“ string 修改为"+ ”"=”(6)点击“保存”,名字任意取,自动弹出 M 文件(我的是7.0版本,不知其他版本会不 会如此)。
(1) 第一个 “in putl ”(2) 第二个 “input2 ”(3)第三个“ Edit Text! ”的用来存储第一个加数,我们将“Edit Tex2”的用来存储第二个加数,我们将"Edit Tex3"的 “string 改为 “Q ” “tag 为““ string 改为 “ 0,” “ tag 改为 “ string 改为 “ 0” “ tag 改为 an swer3•我们先为第一个Edit Text文本框添加代码,即读取第一个加数;点击上图所示红色方框,选择input1_Callback,光标便立刻移到下面这段代码(程序自动生成)的位置。
function in put1_Callback(hObject, even tdata, han dies)% hObject han dle to in putl (see GCBO)% eve ntdata reserved - to be defi ned in a future version of MATLAB% han dles structure with han dles and user data (see GUIDATA)% Hints: get(hObject, ' String ' ) returns cpnttlnasoext% str2double(get(hObject, ' String ' )) returnscontents of editl as a double然后在上面这段代码的下面插入如下代码:%以字符串的形式来存储数据文本框1的内容•如果字符串不是数字,则现实空白内容input=str2num(get(hObject,'String')); %检查输入是否为空.如果为空,则默认显示为0 if(isempty(i nput))set(hObject,'Stri ng','0')endguidata(hObject,handles);%保存handles结构体,只要在handles结构体有改变时,才需要保存%guidata(hObject, handles);%这里由于handles没有改变,故这里其实没有必要,但是为了避免潜在的不必要麻烦,建议在所有Callback都添加该命令。
一个不错的Matlab的gui界面设计实例
%非常漂亮的日历,
function CalendarTable;
% calendar 日历
% Example:
% CalendarTable;
S=datestr(now);
[y,m,d]=datevec(S);
% d is day
% m is month
% y is year
DD={'Sun','Mon','Tue','Wed','Thu','Fri','Sat'};
close all
figure;
for k=1:7;
uicontrol(gcf,'style','text',...
'unit','normalized','position',[0.02+k*0.1,0.55,0.08,0.06],...
'BackgroundColor',0.6*[1,1,1],'ForegroundColor','b',...
'String',DD(k),'fontsize',16,'fontname','times new roman');
end
h=1;
ss='b';
qq=eomday(y,m);
for k=1:qq;
n=datenum(y,m,k);
[da,w] = weekday(n);
if k==d;
ss='r';
end
uicontrol(gcf,'style','push',...
'unit','normalized','position',[0.02+da*0.1,0.55-h*0.08,0.08,0.06] ,...
'BackgroundColor',0.6*[1,1,1],'ForegroundColor',ss,...
'String',num2str(k));
ss='b';
if da==7;
h=h+1;
end
end
uicontrol(gcf,'style','push',...
'unit','normalized','position',[0.6,0.66,0.12,0.08],...
'BackgroundColor',0.6*[1,1,1],'ForegroundColor',ss,...
'String','clock','fontsize',18,'fontname','times new roman');
Tq=uicontrol(gcf,'style','push',...
'unit','normalized','position',[0.74,0.66,0.17,0.08],...
'BackgroundColor',0.6*[1,1,1],'ForegroundColor',[0.1,0.9,0.9],...
'fontsize',18,'fontname','times new roman');
sq='The calendar';
uicontrol(gcf,'style','push',...
'unit','normalized','position',[0.14,0.86,0.37,0.08],...
'BackgroundColor',0.6*[1,1,1],'ForegroundColor',[0.1,0.9,0.9],...
'fontsize',18,'fontname','times new roman','string',sq);
try
while 1
set(Tq,'String',datestr(now,13));
pause(1);
end
end
计算万年历的Matlab程序(2008-12-21 13:59:19)
标签:matlab万年历杂谈分类:Matlab实例function test_calendar(year,month)
% 输入年份,月份,打印这个月的月历
run = 0;
ping = 0;
fprintf('\n%s %s %s %s %s %s %s\n',...
'日','一','二','三','四','五','六');
% 计算从第一年到前一年的闰年和平年的个数
for i =1:year-1
if (mod(i,4)==0 & mod(i,100)~=0) | mod(i,400)==0
run = run+1;
else
ping = ping+1;
end
end
% 计算从第一年到当年前一个月的天数
sum = 366*run+365*ping;
for i = 1:month-1
sum = sum+monthday(year,i);
end
% 获得这个月的天数
n = monthday(year,month);
temp = zeros(n,1);
sum = sum+1;
% 计算这个月第一天是星期几
wkd = mod(sum,7);
for i = 1:n
temp(wkd+i) = i;
end
l = 1;
m = 1;
% 打印日历
for i = 1:length(temp)
if temp(i) ==0
temp2(l,m) = ' ';
fprintf(' ');
m = m+1;
else
temp2(l,m) = temp(i);
if temp(i) >= 10
fprintf('%d ',temp(i));
else
fprintf('%d ',temp(i));
end
m = m+1;
end
if mod(i,7)==0
fprintf('\n');
m = 1;
l = l+1;
end
end
fprintf('\n');
% 闰年和平年每月的天数
function out = monthday(year,i)
if mod(year,4)==0 & mod(year,100)~=0 | mod(year,400)==0
data = [31 29 31 30 31 30 31 31 30 31 30 31];
else
data = [31 28 31 30 31 30 31 31 30 31 30 31];
end
out = data(i);
举例:
输入:
>> test_calendar(2008,12)
返回:
日一二三四五六
1 2 3 4 5 6
7 8 9 10 11 12 13
14 15 16 17 18 19 20
21 22 23 24 25 26 27
28 29 30 31
闲来无事,学了一些Matlab GUI的基础知识,想找个东西练一下手。
看中了windows的日期与时间显示面板,于是依葫芦画瓢,用Matlab 做了一个,嘿嘿,觉得还挺像模像样的。
下面是效果图。
今日进一步完成了农历的计算和显示。