2012大学生数学建模试题[1]
- 格式:doc
- 大小:83.50 KB
- 文档页数:6
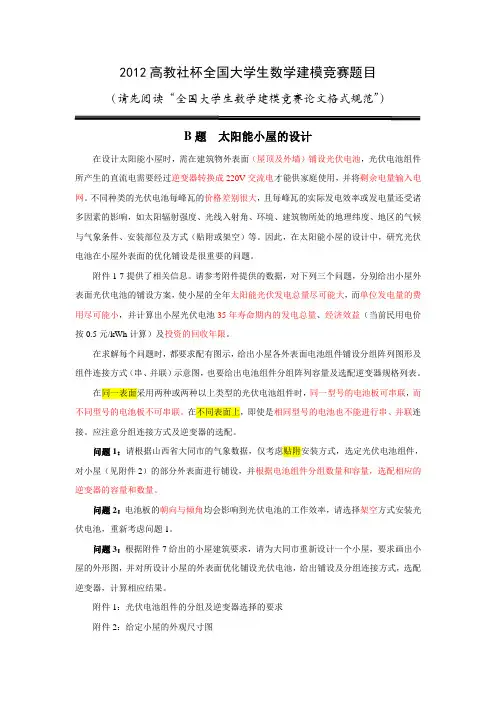
2012高教社杯全国大学生数学建模竞赛题目(请先阅读“全国大学生数学建模竞赛论文格式规范”)B题太阳能小屋的设计在设计太阳能小屋时,需在建筑物外表面(屋顶及外墙)铺设光伏电池,光伏电池组件所产生的直流电需要经过逆变器转换成220V交流电才能供家庭使用,并将剩余电量输入电网。
不同种类的光伏电池每峰瓦的价格差别很大,且每峰瓦的实际发电效率或发电量还受诸多因素的影响,如太阳辐射强度、光线入射角、环境、建筑物所处的地理纬度、地区的气候与气象条件、安装部位及方式(贴附或架空)等。
因此,在太阳能小屋的设计中,研究光伏电池在小屋外表面的优化铺设是很重要的问题。
附件1-7提供了相关信息。
请参考附件提供的数据,对下列三个问题,分别给出小屋外表面光伏电池的铺设方案,使小屋的全年太阳能光伏发电总量尽可能大,而单位发电量的费用尽可能小,并计算出小屋光伏电池35年寿命期内的发电总量、经济效益(当前民用电价按0.5元/kWh计算)及投资的回收年限。
在求解每个问题时,都要求配有图示,给出小屋各外表面电池组件铺设分组阵列图形及组件连接方式(串、并联)示意图,也要给出电池组件分组阵列容量及选配逆变器规格列表。
在同一表面采用两种或两种以上类型的光伏电池组件时,同一型号的电池板可串联,而不同型号的电池板不可串联。
在不同表面上,即使是相同型号的电池也不能进行串、并联连接。
应注意分组连接方式及逆变器的选配。
问题1:请根据山西省大同市的气象数据,仅考虑贴附安装方式,选定光伏电池组件,对小屋(见附件2)的部分外表面进行铺设,并根据电池组件分组数量和容量,选配相应的逆变器的容量和数量。
问题2:电池板的朝向与倾角均会影响到光伏电池的工作效率,请选择架空方式安装光伏电池,重新考虑问题1。
问题3:根据附件7给出的小屋建筑要求,请为大同市重新设计一个小屋,要求画出小屋的外形图,并对所设计小屋的外表面优化铺设光伏电池,给出铺设及分组连接方式,选配逆变器,计算相应结果。
SummaryMany scholars conclude that leaf shape is highly related with the veins. Based on this theory, we assume the leaf growth in each direction satisfies a function. For the leaves in the same tree, the parameters are different; for those of separate trees, the function mode is different. Thus the shape of leaf differs from that of another. In the end of section 3, we simulate one growing period and depict the leaf shape.Through thousands of years of evolution, the leaves find various wa ys to make a full use of natural resources, including minimizing overlapping individual shadows. In order to find the main factors promoting the evolution of leaves, we analyze the distribution of adjacent leaves and the equilibrium point of photosynthesis and respiration. Besides, we also make a coronary hierarchical model and transmission model of the solar radiation to analyze the influence of the branches.As to the tree structure and the leaf shape, first we consider one species. Different tree shapes have different space which is built up by the branch quality and angle, effect light distribution, ventilation and humidity and concentration of CO2 in the tree crown. These are the factors which affect the leaf shape according to the model in section 1. Here we analyze three typical tree shapes: Small canopy shape, Open center shape and Freedom spindle shape, which can be described by BP network and fractional dimension model. We find that the factors mainly affect the function of Sthat affects the additional leaf area. Factors are assembled in different ways to create different leaf shapes. So that the relationship between leaf shape and tree profile/branching structure is proved.Finally we develop a model to calculate the leaf mass from the basic formula of . By adjusting the crown of a tree to a half ellipsoid, we first define thefunction of related factors,such as the leaf density and the effective ratio of leaf area. Then we develop the model using calculus. With this model, weapproximately evaluate the leaf mass of a middle-sized tree is 141kg.Dear editor,How much the leaves on a tree weigh is the focus of discussion all the time. Our team study on the theme following the current trend and we find something interesting in the process.The tree itself is component by many major elements. In our findings, we analyze the leaf mass with complicated ones, like leaf shape, tree structure and branch characteristics, which interlace with each other.With the theory that leaf shape is highly related with the veins, we assume theleaf growth in each direction satisfies a function . For the leaves in thesame tree, the parameters are different; for those of separate trees, the function mode is di fferent. That’s why no leaf shares the same shape. Also, we simulate one growing period and depict the leaf shape.In order to find the main factors promoting the evolution of leaves, we analyze the distribution of adjacent leaves and the equilibrium point of photosynthesis and respiration. Besides, we also make a coronary hierarchical model and transmission model of the solar radiation to analyze the influence of the branches.As to the tree structure and the leaf shape, different tree shapes have differe nt space which is built up by the branch quality and angle, effect light distribution, ventilation and humidity and concentration of CO2 in the tree crown that affect leaf shapes. Here we analyze three typical tree shapes which can be described by BP network and fractional dimension model. We find that the factors mainly affect the function of Sthat affects the additional leaf area. Factors are assembled in different ways to create different leaf shapes. So that the relationship between leaf shape and tree profile or branching structure is proved.Finally we develop the significant model to calculate the leaf mass from thebasic formula of . By adjusting the crown of a tree to a half ellipsoid,we first define the function of related factors and then we develop the model using calculus. With this model, we approximately evaluate the leaf mass of a middle-sized tree is 141kg.We are greatly appreciated that if you can take our findings into consideration. Thank you very much for your precious time for reading our letter.Yours sincerely,Team #14749Contents1. Introduction (4)2. Parameters (4)3. Leaves have their own shapes (5)3.1 Photosynthesis is important to plants (5)3.2 How leaves grow? (6)3.3 Build our model (7)3.4 A simulation of the model (10)4. Do the shapes maximize exposure? (14)4.1 The optimum solution of reducing overlapping shadows (14)4.1.1 The distribution of adjacent leaves (14)4.1.2 Equilibrium point of photosynthesis and respiration (15)4.2 The influence of the “volume” of a tree and its branches (17)4.2.1 The coronary hierarchical model (17)4.2.2 Spatial distribution model of canopy leaf area (18)4.2.3 Transmission model of the solar radiation (19)5. Is leaf shape related to tree structure? (20)5.1 The experiment for one species (21)5.2 Different tree shapes affect the leaf shapes (23)5.2.1 The light distribution in different shapes (23)5.2.2 Wind speed and humidity in the canopy (23)5.2.3 The concentration of carbon dioxide (24)5.3 Conclusion and promotion (25)6. Calculus model for leaf mass (26)6.1 How to estimate the leaf mass? (26)6.2 A simulation of the model (28)7. Strengths and Weakness (29)7.1 Strengths (29)7.2 Weaknesses (30)8. Reference (30)1. IntroductionHow much do the leaves on a tree weigh? Why do leaves have the various shapes that they have? How might one estimate the actual weight of the leaves? How might one classify leaves?We human-beings have never stopped our steps on exploring the natural world. But, as a matter of fact, the answer to those questions is still unresolved. Many scientists continue to study on this area. Recently , Dr. Benjamin Blonder (2010) achieved a new breakthrough on the venation networks and the origin of the leaf econo mics spectrum. They defined a standardized set of traits – density , distance and loopiness and developed a novel quantitative model that uses these venation traits to model leaf-level physiology .Now, it is commonly thought that there are four key leaf functional traits related to leaf economics: net carbon assimilation rate, life span, leaf mass per area ratio and nitrogen content.2. Parametersthe area a leaf grows decided by photosynthesisthe additional leaf area in one growing periodthe leaf growing obliquity Pthe total photosynthetic rate 0d R the dark respiration rate of leavesn P the net photosynthetic rateh the height of the canopyd the distance between two branchesdi the illumination intensity of scattered light from a given directionthe solar zenith angleh the truck highh the crown high13. Leaves have their own shapes3.1 Photosynthesis is important to plantsIt is widely accepted that two leaves are different, no matter where they are chosen from; even they are from the very tree. To understand how leaves grow is helpful to answer why leaves have the various shapes that they have.The canopy photosynthesis and respiration are the central parts of most biophysical crop and pasture simulation models. In most models, the acclamatory responses of protein and the environmental conditions, such as light, temperature and CO2 concentration, are concerned[1].In 1980, Farquhar et al developed a model named FvCB model to describe photosynthesis[2]:The FvCB model predicts the net assimilation rate by choosing the minimum between the Rubisco-limited net photosynthetic rate and the electron transport-limited net photosynthetic rate.Assume A n, A c, A j are the symbols for net assimilation rate, the Rubisco-limited net photosynthetic rate and the electron transport-limited net photosynthetic rate respectively, and the function can be described as:(1)(2)where and are the intercellular partial pressures of CO2 and O2,respectively, and are the Michaelis–Menten coefficients ofRubisco for CO2and O2, respectively, is the CO2compensation point inthe absence of (day respiration in andis the photosystem II electron transport rate that is used for CO2fixation and photorespiration[3][4].We apply the results of this model to build the relationship between the photosynthesis and the area a leaf grows during a period of time. It can be released as:(3)and are the area of the target leaf and the period of time it grows.is a function which can transfer the amount ofCO2into the area the leaf grows and the are parameters which affect S p. S p can be used as a constraint condition in our model.3.2 How leaves grow?As the collocation of computer hardware and software develops, people can refer to bridging biology, morphogenesis, applied mathematics and computer graphics to simulate living organisms[5], thus how to model leaves is of great challenge. In 2001, Dengler and Kang[6]brought up the thought that leaf shape is highly related to venation patterns. Recently, Runions[7] brought up a method to portray the leaf shape by analyzing venation patterns. Together with the Lindenmayer system (L-system), an advanced venation model can adjust the growth better that it solved the problem occurred in the previous model that the secondary veins are retarded.We knowleaves have various shapes.For example, leaves can be classified in to simple leaves which have an undivided blade and compound leaves whose blade is divided into two or more distinctleaflets such as the Fabaceae. As to the shape of a leaf, it may have marginal dentations of the leaf blades or not, and like a palm with various fingers or an elliptical cake. Judd et al defined a set of terms which describe the shape of leaves as follows [8]:We chose entire leaves to produce this model as a simplification. What’s more, they confirmed again that the growth of venations relates with that of the leaf.To disclose this relationship, Relative Elementary Rate of Growth (RERG) can be introduced to depict leaves growth [9]. RERG is defined as the growth rate per distance, in the definitive direction l at a point p of the growing object, yielding(4)Considered RERG , the growth patterns of leaves are also different. Roth-Nebelsick et al brought up four styles in their paper [10]:3.3 Build our modelWe chose marginal growth to build our model. Amid all above-mentioned studies, weFigure 3.1 Terms pertinent to the description of leaf shapes.Figure 3.2 A sample leaf (a) and the results of its: (b) marginal growth, (c) uniform isotropic (isogonic) growth, (d) uniform anisotropic growth, and (e) non-uniform anisotropic growth.Figure 3.3 The half of a leaf is settled in x-y plane like this with primary vein overlapping x-axis. The leaf grows in the direction of .assume that the leaf produce materials it needs to grow by photosynthesis to expand its leaf area from its border and this process is only affected by what we have discussed in the previous section about photosynthesis. The border can be infinitesimally divided into points. Set as the angle between the x-axis and thestraight line connecting the grid origin and one point on the curve,andas the growth distance in the direction of . To simplify the model, we assume that the leaf grows symmetrical. We put half of the leaf into the x-y plane and make the primary vein overlap x-axis.This is how we assume the leaf grows.In one circle of leaf growth, anything that photosynthesis provided transfers into theadditional leaf area, which can be described as:(5)while in the figure.In this case, we can simulate leaf growth thus define the leaf shape by using iterative operations the times N a leaf grow in its entire circle ①.① For instance, if the vegetative circle of a leaf is 20 weeks on average, the times of iterative operations N can beset as 20 when we calculate on a weekly basis.Figure 3.4 The curves of the adjacent growing period and their relationship.First, we pre-establish the border shape of a leaf in the x-y plane, yielding . where , the relevant satisfies:(6)(7) In the first growing period, assume , the growth distance in the direction of ,satisfies:(8)(9) It releases the relationship of the coordinates in the adjacent growing period. In this case, we can use eq.(9)to predict the new border of the leaf after one period of growth②:(10)And the average simple recursions are③:②That means, in the end of period 1.③As we both change the x coordinate and the y coordinate, in the new period, these two figures relate through those in the last period in the functions.(11)After simulate the leaf borders of the interactive periods, use definite integral ④ to settle parametersin the eq.(8) then can be calculated in each direction of , thus the exact shape of a leaf in the next period is visible.When the number of times N the leaf grows in its life circle applies above-mentioned recursions to iterate N times and the final leaf shape can be settled.By this model, we can draw conclusions about why leaves have different shapes. For the leaves on the same tree, they share the same method of expansion which can be described as the same type of function as Eq.(8). The reason why they are different, not only in a sense of big or small, is that in each growing period they acquire different amount of materials used to expand its own area. In a word, the parameters in the fixedly formed eq.(8) are different for any individual leaf on the same tree. For the leaves of different tree species, the corresponding forms of eq.(8) are dissimilar. Some are linear, some are logarithmic, some are exponential or mixtures of that, which settle the totally different expansion way of leaf, are related with the veins. On that condition, the characters can be divided by a more general concept such as entire or toothed.3.4 A simulation of the modelWe set the related parameters by ourselves to simulate the shape of a leaf and to express the model better.First we initialize the leaf shape by simulating the function of a leaf border at the④The relationship must meet eq.(5).Figure 3.5 and the recurrence relations.beginning of growing period 1 in the x-y plane. By observation, we assume that themovement of the initial leaf border satisfied:(12)Suppose the curve goes across the origin of coordinates, then the constraint conditionscan be:(13)Thus the solution to eq.(13) is:(14)By using Mathematica we calculatewhereandthe area of the half leaf is: (15)Wesettleaccording to the research by S. V . Archontoulisin et al [11] in eq.(3). On a weekly basis, theparameter. In eq.(15), we have .Figure 3.6When assume ,thus constraint condition eq.(5) becomes: (16)When eq.(8) is linear and after referring to Runions’s paper, we assume that Y -valuedecreases when X-value increases, which means the leaf grows faster at the end of theprimary vein. If the grow rate at the end of the primary vein is 0,as ,eq.(8) can be described as: (17)where b is decided by eq.(16).To settle the value of b , we calculate multiple sets of data by Excel then use a planecurve to trace them and get the approximation of b . In this method, we use grid toapproximate .Apparently,is monotone.When b is 2: The square of each square is 0.0139cm 2, and the total number of the squares in theadditional area is about 240. SoFigure 3.7When b is 2.5:Thesquare of each squareis 0.0240cm 2, and the total number of the squares in theadditional area is about 201. SoWhen b is 3:The square of each square is 0.0320cm 2, and the total number of the squares in the additional area is about 193. SoAfter comparing, we can draw a conclusion that fit eq.(16)best; accordingly, in period 1: (18)In each growing period, may be different for the amount of material produced isFigure 3.9Figure 3.8related with various factors, such as the change of relative location and CO 2 or O 2concentration, and other reasons. By using the same method, the leaf shape in period2 or other period can be generated on the basis of the previous growing period untilthe end of its life circle.What’s more, when eq.(8) is remodeled, the corresponding leaf shape can be changed.With , the following figure shows the transformationof a leaf shape in the firstgrowing period with the samesettled above and we can see that the shape will be dissected in the end.4. Do the shapes maximize exposure?4.1 The optimum solution of reducing overlapping shadows4.1.1 The distribution of adjacent leavesV ein is the foundation of the leaves. With the growing of veins, the leaves graduallyexpand around. The distribution of main and lateral veins plays an important decisiverole in the shapes of leaves. The scientists created a mathematical model which usesthree decisive factors - the relationship between the rate of photosynthesis, leaf life,carbon consumption or nitrogen consumption, to simulate the leaves’ shape. Becauseof carbon consumption is a constant for one tree, and we take the neighboring leavesin the same growth cycle to observe. So, we can only focus on one factor - the rate ofphotosynthesis.Figure 3.10The shape differs from figure 3.7-3.9, as the kind offunction of is different. In this case, it is a cubic model while a linear model in figure 3.7-3.9.Through the observation of dicotyledon, leaves on a branch will grow in a staggered way that can reduce the overlapping individual shadows of adjacent leaves and make them get more sunlight (Figure 4.1).Figure 4.1 The rotation distribution of leavesBase on the similar environment, we assume that adjacent leaves nearly have the same shape. From the perspective of looking down, the leaves grow from a point on the branch. So, we can simplify the vertical view of leaves as a circle of which the radius is the length of a vein which is represented with r. The width of the leaf is represented with w. The angle between two leaves is represented with β(Figure4.2).Figure 4.2 The vertical view of leavesThe leaves should use the space as much as possible, and for the leaf with one main vein, oval is the best choice. In general, βis between 15°and 90°. In this way, effectively reduce the direct overlapping area. According to the analysis of the first question, r and w are determined by the rate of photosynthesis and respiration. Besides, the width of leaf is becoming narrower when the main vein turns to be thinner.4.1.2 Equilibrium point of photosynthesis and respirationThe organism produced by photosynthesis firstly satisfies needs of leaf itself. Then the remaining organism delivered to the root to meet the growth needs of the tree. As we know, respiration needs to consume organism. If the light is not sufficient, organism produced by photosynthesis may no longer be able to afford the materials required for the growth of leaves. There should be an equilibrium point so as toprevent the leaf is behindhand in its circumstances.The formula [12] that describes the photosynthetic rate in response to light intensity with gradual exponential growth index can be expressed as:(19) Where P is total photosynthetic rate, m ax P is maximum photosynthetic rate ofleaves, a is initial solar energy utilization and I is photosynthetic photon quanta flux density .The respiration rate is affected by temperature ,using the formal of index to describe as follows:025102T d d R R -=⋅ (20)Where T is temperature and 0d R is the dark respiration rate of leaves, when the temperature is 25 degrees. As a model parameter, 0d R can be determined bynonlinear fitting. Therefore, the net photosynthetic rate can be expressed in the indexform as follows:(21)Where n P is the net photosynthetic rate, which does not include the concentration ofcarbon dioxide and other factors. The unit of n P is 21m ol m s μ--⋅⋅.We assume that the space for leaf growth is limited, the initial area of the leaf is 0S . At this point, the entire leaf happens to be capable of receiving sunlight. If the leaf continue to grow, some part of the leaf will be in the shadows and the area in the shadows is represented with x . Ignore the fluctuation cycle of photosynthesis and respiration, on average, the duration of photosynthesis is six hours per day . In the meanwhile, the respiration is ongoing all the time. When the area increased to S , we established an equation as follows:(22)where μ is the remaining organism created by the leaf per day . And from where 0μ=, which means the organism produced by photosynthesis has all been broken down completely in the respiration, we get the equilibrium point.4n n d S P x P R ⋅=+ (23) The proportion of the shaded area in the total area:4nn d P xS P R =+ (24)Cite an example of oak trees, we found the following data (Figure 4.3), which shows the relationship between net photosynthesis and dark respiration during 160 days. Thehabitat of the trees is affected by the semi-humid monsoon climate.Figure 4.3 The diurnal rate of net photosynthesis and dark respiration [13]In general, 217n P m ol m s μ--=⋅⋅,214d R m ol m s μ--=⋅⋅. Taking the given numbersinto the equation, we can get the result.0025xS =From the result, we can see that in the natural growth of leaves, with the weakening of photosynthesis, the leaves will naturally stop growing once they come across the blade between blocked. Therefore, the leaves can always keep overlapping individual shadows about 25%, so as to maximize exposure.4.2 The influence of the “volume” of a tree and its branches4.2.1 The coronary hierarchical modelMr. Bōken and Dr. J. Fischer (1987) found that in order to adequate lighting, leaves have different densities and the branches is distributed according to certain rules. They observed tropical plants in Miami, found that the ratio of main branch and two side branches is 1:0.94:0.87, and the angles between them are 24.4°and 36.9°. According to the computer simulation, the two angles can maximize the exposure of leaves.For simply, we use hemisphere to simulate the shape of the canopy. According to the light transmittance rate, we can divide the canopy into outer and inner two layers(Figure 4.3). The volume of the hemisphere depends on the size and distribution of branches.Figure 4.3 The coronary hierarchical modelThe angle between the branches will affect the depth of penetration of sun radiation and the distribution of leaves. Besides, thickness of the branches will affect the transfer of nutrients to the leaves.4.2.2 Spatial distribution model of canopy leaf areaAssume that the distribution of leaves is uniform in the section xz but not uniform in the y direction, as the figure 4.3. Then, we can get the formula of leaf area index (LAI) as follows [14]:/20/21(,)h d d dz x z dx LAI d -∂=⎰⎰(25)Where h is the height of the canopy , d is the distance between two branches, and (,)x z ∂ is the leaf area density function of the micro-body at the point (,)x z . x a is the function of leaf area which means the distribution of cross-section of the X direction, and Its value is a dimensionless, defined as follows: /2/21()d x d a x dx LAI d -=⎰ (26)()()x s a x d LAI C x =⋅⋅ (27)For the canopy which is not uniform in the horizontal direction, the distribution of its leaves is not entirely clear. We use s C to represent the distribution function of thedensity of leaves. s C can be expressed as a quadratic function or a Gaussiandistribution function.4.2.3 Transmission model of the solar radiationAssume that the attenuation of the solar radiation accords with the law of Beer-Lambert. The attenuation value at a point of canopy where the light arrives with a certain angle of incidence and azimuth is proportional to the length of the path, and the length can be calculated by Goudriaan function. Approximate function of the G function is shown as follows [15]:00(12)cos G G k G θ=+- (28)where k is a parameter decided by different plants.Take a micro unit in the canopy . Direct sunlight intercepted in this micro unit can be expressed in the following form:()(,)b b L dI I z G z dLAI =-Θ (29)Where b I means the direct sunlight, Θ is the solar zenith angle and L dL A I is the LAI on the path of light.Figure 4.4 Micro unit of the canopyThrough the integral and the chain rule, we can get the transmittance at the point (',')x z as follows:(,)[()]tan sin ()(',')exp()()h b b z G z a x z a z I x z I h ΘΘ∆Φ+=-⎰ (30)Average direct transmission rate:/2/21(')(',')'d b b d t z t x z dx d --=⎰(31)Different with the direct light, the scattered light in all directions is intercepted by theleaf surface from the upper hemisphere. The irradiance d dI of scattering at the point(',')x z can be expressed as follows:'cos d d b dI i t d ωθ=⋅⋅ (32) where d i is the illumination intensity of scattered light from a given direction.The transmission rate of the sun scattered light is as follows:2/2'00(',')1sin cos ()d b d I x z t d d I h ππθθθϕπ=⎰⎰ (33) Average scattering transmission rate:/2/21(')(',')'d d d d t z t x z dx d --=⎰(34)Global solar radiation reaching the canopy with a given depth z :(')()[(1)(')(')]d b d d I z I h k t z k t z ---=-+ (35)According to eq.(30) and eq.(33), the maximum depth the solar radiation can reach has a major link with h and θ. The shape of leaves have a relationship with photosynthesis. So, the h and θ of branches do have an influence on the leaves. Results showed that the light level and light utilization of high stem and open ce nter shape as well as small and sparse canopy shape were better than others .Double canopy shape ,spindle shape and center shape took second place ,while big canopy shape had the lowest light distribution [16].5. Is leaf shape related to tree structure?Due to internal and external factors, there are many kinds of tree shapes in the nature. For example, the apple's tree shape is semi-ellipsoidal, the willow's is hemispherical, the peach's likes a cup, the pine's likes cone and so on. The shape of their leaves varies. The leaf shape of apple is oval, pine's is needle, and the Indus's is palm. Is leaf shape related to tree shape? Even for the same species, there are many kinds of tree shapes. For instance, Small canopy shape, Open center shape, Freedom spindle shape, high stem and open center shape, Double canopy shape and so on. The sizes of leaves are different. Does the tree profile/branching structure effects the leaf shape?5.1 The experiment for one speciesTo solve this problem, we first consider the relationship of one tree species such as apple, which is semi-ellipsoidal. According to the second question, the hemispherical model is further extended to the semi-ellipsoidal model. Every tree individual shows irregularly because of natural and man-made factors, which reflects on the diversity of the crown in the canopy height direction of the changing relationship between the crown and canopy height. Figure 5.1 shows the relationship.Figure5.1 Schematic diagram of tree crown contourWhere 0h means the truck high, 1h means the crown high, 8710,,,,d d d d ⋅⋅⋅ meanscrown diameter. Tree shape with the scale change can be characterized in fractal dimension. Across the same scales, a fixed fractal dimension indicates the boundary shape's self-similarity; on different scales, the change of fractal dimension means that different processes or limiting factor has superiority. (Wiens, 1989)[17] According to the application of BP network and fractional dimension, we describe the tree shapes.[18]According to Li Guodong and Zhang Junke's work which detected and evaluated in different tree shapes of ‘Fuji’ apple. We choose three kinds of tree shapes to study; they are Small canopy shape, Open center shape and Freedom spindle shape as figure5.2 shows.。
承诺书我们仔细阅读了中国大学生数学建模竞赛的竞赛规则.我们完全明白,在竞赛开始后参赛队员不能以任何方式(包括电话、电子邮件、网上咨询等)与队外的任何人(包括指导教师)研究、讨论与赛题有关的问题。
我们知道,抄袭别人的成果是违反竞赛规则的, 如果引用别人的成果或其他公开的资料(包括网上查到的资料),必须按照规定的参考文献的表述方式在正文引用处和参考文献中明确列出。
我们郑重承诺,严格遵守竞赛规则,以保证竞赛的公正、公平性。
如有违反竞赛规则的行为,我们将受到严肃处理。
我们授权全国大学生数学建模竞赛组委会,可将我们的论文以任何形式进行公开展示(包括进行网上公示,在书籍、期刊和其他媒体进行正式或非正式发表等)。
我们参赛选择的题号是(从A/B/C/D中选择一项填写): C我们的参赛报名号为(如果赛区设置报名号的话):所属学校(请填写完整的全名):参赛队员(打印并签名) :1.2.3.指导教师或指导教师组负责人(打印并签名):日期:年月日赛区评阅编号(由赛区组委会评阅前进行编号):编号专用页赛区评阅编号(由赛区组委会评阅前进行编号):全国统一编号(由赛区组委会送交全国前编号):全国评阅编号(由全国组委会评阅前进行编号):脑卒中发病环境因素分析及干预摘要:脑卒中(俗称脑中风)是目前威胁人类生命的严重疾病之一,为了让脑卒中高危人群能够及时采取干预措施,需要进行疾病的风险评估。
本文先对数据进行统计处理,然后分析各个量之间的关系,再建立数学模型,利用数据拟合计算各个量之间的函数关系,最后求解得出结论。
在问题一中,通过对脑卒中的发病人群进行了统计和分析,分别研究了四个不同年份的患者,将他们按不同年龄、不同性别以及不同职业分别进行划分,然后通过建表和作图将他们进行统计和分析,从而判断脑卒中在不同人群中的发病情况:男性比女性的发病率偏高,且男女的平均比为1.35:1;青少年患病率较低,占29%;中老年人患病率偏高,占70%,而且患病率逐年增加,平均年龄为69.77339,发病年龄最高的为76岁;农民、退休人员、工人的患病率比其他职业的人群高,其中农民发病率最高,为67.46%。
2011高教社杯全国大学生数学建模竞赛城市表层土壤重金属污染分析摘要本文主要研究重金属对城市表层土壤污染的问题,我们根据题目所给定的一些数据和信息分析并建立了扩散传播模型、权重分配模型、对比模型和转换模型解决问题。
首先,我们利用Matlab 软件拟出该城区地势图(图1),根据所给数据绘出该地区的三维地势及采样点在其上的综合空间分布图。
之后将8种重金属的浓度等高线投影到该地区三维地形图曲面上,接着分别计算8种重金属在五个区域的平均值,立体图和平面图(图1附件)相结合便可得出8种重金属元素在该城区的空间分布。
其次,在确定该城区内不同区域重金属的污染程度时,我们运用两种方法进行解答。
先假设各重金属毒性及其它性质相同,运用公式ijij P C P ='求出各区域各金属相对于背景平均值的比值作为金属污染程度,再运用1ji ij j C C ==∑求出各区域重金属污染程度,并将各区进行比较。
之后,我们加上各重金属的毒性,对各重金属求出权数,再结合国标重金属污染等级和已知的各组数据来确定金属的污染程度。
由上述两种方法的对比,更准确地得出重金属对各区的影响程度。
即: 工业区>交通区>生活区>公园绿地区>山区 并根据第一个模型的数据来说明重金属污染的主要原因。
再次,对重金属污染物的传播特征进行了分析,判断出重金属污染物主要是通过大气、土壤和水流进行传播。
在分析之中,我们得出这三种状态的传播并不是孤立存在的,而是可以相互影响和叠加的,因此,我们分别建立三个传播模型,再对这三个传播模型进行了时间和空间上的拟合,得出重金属浓度最高的区域图,并结合各重金属的分布图(图6)来确定各污染源的位置。
最后,本题中只给出了重金属对土壤的污染,对于研究城市地质环境的演变模式,还需要搜集一些信息(图7)。
根据每种因素对地质环境的影响程度进行由定性到定量的转化。
建立同一地质时期地质环境中各因素的正影响和负影响的权重分配模型,再对这些权重进行验算和修正。
![2012数学建模作业参考答案(部分)[1]](https://uimg.taocdn.com/179ca9767fd5360cba1adb41.webp)
2012高教社杯全国大学生数学建模竞赛承诺书我们仔细阅读了中国大学生数学建模竞赛的竞赛规则.我们完全明白,在竞赛开始后参赛队员不能以任何方式(包括电话、电子邮件、网上咨询等)与队外的任何人(包括指导教师)研究、讨论与赛题有关的问题。
我们知道,抄袭别人的成果是违反竞赛规则的, 如果引用别人的成果或其他公开的资料(包括网上查到的资料),必须按照规定的参考文献的表述方式在正文引用处和参考文献中明确列出。
我们郑重承诺,严格遵守竞赛规则,以保证竞赛的公正、公平性。
如有违反竞赛规则的行为,我们将受到严肃处理。
我们授权全国大学生数学建模竞赛组委会,可将我们的论文以任何形式进行公开展示(包括进行网上公示,在书籍、期刊和其他媒体进行正式或非正式发表等)。
我们参赛选择的题号是(从A/B/C/D中选择一项填写): A我们的参赛报名号为(如果赛区设置报名号的话):所属学校(请填写完整的全名):CXXY参赛队员(打印并签名) :1.2.3.指导教师或指导教师组负责人(打印并签名):日期: 2012年 09 月 10 日赛区评阅编号(由赛区组委会评阅前进行编号):2012高教社杯全国大学生数学建模竞赛编号专用页赛区评阅编号(由赛区组委会评阅前进行编号):赛区评阅记录(可供赛区评阅时使用):评阅人评分备注全国统一编号(由赛区组委会送交全国前编号):全国评阅编号(由全国组委会评阅前进行编号):A题葡萄酒的评价摘要问题一:针对两组评酒员的评价结果需要进行多个平均数间的差异显著性检验,首先应该对数据进行正态分布检验,结论是每一个葡萄酒样品的评价得分都服从正态分布,之后利用SPSS软件进行两独立样本T检验模型进行显著性检验得出两组评酒员的评价结果有显著性差异,结合方差分析得出第二组评分更可信。
问题二:根据酿酒葡萄的理化指标采用聚类分析和主成分分析的方法模型对酿酒葡萄评价,再结合问题一中葡萄酒的质量评价,利用正态分布将两者标准化到统一的评分尺度中,对两者赋予不同的权重系数求总得分,进而对这些酿酒葡萄划分成5个等级。
2012数学建模题目一、题目描述近年来,随着互联网技术的不断进步,移动互联网已经成为人们生活中不可或缺的一部分,而移动互联网产业的发展也越来越成熟。
然而,随着移动互联网用户数量的不断增长,如何提高移动互联网用户的使用体验成为了重要的问题。
本题要求通过对用户行为分析,建立数学模型,预测用户在移动互联网上的行为,并通过模型优化提高用户使用体验。
二、问题分析基于移动互联网用户的行为特征,我们可以将用户的使用过程分为以下几个阶段:1. 需求获取阶段:用户首先会通过各种渠道获取使用移动互联网的需求信息,例如通过搜索引擎、社交媒体等方式获取信息。
在这个阶段,用户主要进行信息搜索和筛选,并逐渐形成清晰的需求。
2. 功能使用阶段:在用户确定了需求之后,用户会选择相应的应用程序进行使用。
在这个阶段,用户主要进行应用程序的功能使用。
3. 反馈阶段:用户使用应用程序的过程中会对应用程序的界面、功能、速度等方面进行评价,并可能会向软件开发者反馈问题。
通过对这三个阶段的分析,我们可以发现用户行为具有以下特征:1. 多样性:用户的需求各不相同,对应用程序的评价也因人而异。
2. 实时性:用户使用移动互联网的过程中可能会随时变化,需要及时调整模型。
3. 复杂性:用户使用移动互联网的过程中涉及到多种维度的信息,需要通过数学模型进行分析和预测。
基于以上特征,我们需要建立合适的数学模型进行分析和预测。
三、模型建立为了建立数学模型,我们需要对用户行为数据进行采集、处理和分析。
具体地,我们需要考虑以下几个问题:1. 数据采集:我们需要通过各种手段进行数据的采集,例如使用爬虫技术对用户行为数据进行抓取。
2. 数据处理:在获取了足够的用户行为数据之后,我们需要对数据进行清洗、转换和统计,以便于进行数学模型的分析。
3. 数据分析:我们需要对数据进行统计分析,了解用户的行为特征和规律,并构建对应的数学模型进行预测。
基于以上思路,我们可以建立以下数学模型:1. 需求获取模型在需求获取阶段,用户通过搜索引擎、社交媒体等方式进行信息获取。
(请先阅读“全国大学生数学建模竞赛论文格式规范”)A题葡萄酒的评价确定葡萄酒质量时一般是通过聘请一批有资质的评酒员进行品评。
每个评酒员在对葡萄酒进行品尝后对其分类指标打分,然后求和得到其总分,从而确定葡萄酒的质量。
酿酒葡萄的好坏与所酿葡萄酒的质量有直接的关系,葡萄酒和酿酒葡萄检测的理化指标会在一定程度上反映葡萄酒和葡萄的质量。
附件1给出了某一年份一些葡萄酒的评价结果,附件2和附件3分别给出了该年份这些葡萄酒的和酿酒葡萄的成分数据。
请尝试建立数学模型讨论下列问题:1. 分析附件1中两组评酒员的评价结果有无显著性差异,哪一组结果更可信?2. 根据酿酒葡萄的理化指标和葡萄酒的质量对这些酿酒葡萄进行分级。
3. 分析酿酒葡萄与葡萄酒的理化指标之间的联系。
4.分析酿酒葡萄和葡萄酒的理化指标对葡萄酒质量的影响,并论证能否用葡萄和葡萄酒的理化指标来评价葡萄酒的质量?附件1:葡萄酒品尝评分表(含4个表格)附件2:葡萄和葡萄酒的理化指标(含2个表格)附件3:葡萄和葡萄酒的芳香物质(含4个表格)(请先阅读“全国大学生数学建模竞赛论文格式规范”)B题太阳能小屋的设计在设计太阳能小屋时,需在建筑物外表面(屋顶及外墙)铺设光伏电池,光伏电池组件所产生的直流电需要经过逆变器转换成220V交流电才能供家庭使用,并将剩余电量输入电网。
不同种类的光伏电池每峰瓦的价格差别很大,且每峰瓦的实际发电效率或发电量还受诸多因素的影响,如太阳辐射强度、光线入射角、环境、建筑物所处的地理纬度、地区的气候与气象条件、安装部位及方式(贴附或架空)等。
因此,在太阳能小屋的设计中,研究光伏电池在小屋外表面的优化铺设是很重要的问题。
附件1-7提供了相关信息。
请参考附件提供的数据,对下列三个问题,分别给出小屋外表面光伏电池的铺设方案,使小屋的全年太阳能光伏发电总量尽可能大,而单位发电量的费用尽可能小,并计算出小屋光伏电池35年寿命期内的发电总量、经济效益(当前民用电价按0.5元/kWh计算)及投资的回收年限。
2012年数学建模练习题要求:1. 完成时间:见到题目开始,5月10日结束,每个报名培训同学在5月9日-12日之间由各学院联络员收集打印稿并交到9号楼9层920,数学系办公室。
特别是有意参加全国竞赛的同学必须提交。
这个作业是选拔队员的参考内容之一。
电子稿提交zbjianmo@,电子稿文件名:建模学号姓名2. 本练习题每个人独立完成,不接受合作完成的。
3. 一本二本AB任选1个,C题必做;信商完成AD两题4. 按照数学建模的格式完成论文(格式要求见后面,并上网查阅全国数学建模竞赛格式)5. 请参加培训的同学阅读以下全国赛题6. 请参加培训同学上网查找历年全国数学建模竞赛题目,了解题意,便于讲授时盲目。
以下题目优先看一下:眼科医院病床安排(2009);高校学费收取(2008);世博会的影响力(2010B);奥运场馆(2004年A)钢管的订购与运输(2000B)A、红心大战游戏的结果评价(本题不规定具体格式)WINDOWS自带红心大战游戏,黑桃Q为13分;每个红桃1分。
每局下来一般总分为26分;若有一方收的所有红桃和黑桃Q,则本人得0分,其余三人每人得26分。
连续几次,当其中一个人得分超过100分时,这个人输,而得分最少的为赢。
因此玩家都力求尽量少得分。
现有若干位玩此游戏的人(A,B,C,D,E,…),均取得胜利(即计算机中三方有一方超100分,而本人分数最少),请给出一个评价函数,用以区分这些玩家的水平(每人都独立与计算机玩)。
B 公交车问题(不要求格式)835支线非周末早晨胜利桥东发车时间为6:20, 6:30 , 6:40 6:50,7:05 7:20 7:30 7:40 7:50 8:00835支线从胜利桥东出发的到主要站点时间大致为从中北大学校医院返回胜利桥东每个区间运行时间跟来时相同1. 一个人早晨7:30从胜利桥东坐835支线车到南环路口,在路上会迎面碰到对面开过来的835支线,从胜利桥东开始到南环路口会遇到几辆835支,相遇的时间分别是几点?2.一般公交车安排时间一方面是保证车不太拥挤,另一方面考虑减少“汇车”。
2012年大学生数学建模竞赛赛题注意:1. 本处列了3个题目,各队可以从中任选一个完成,也可以从2012年数学建模夏令营题目中选取一个完成。
因这些题目均有一定难度,因此交卷时间推迟一周,就是到5月15日交卷。
纸质稿提交理学院团委,电子版发送zbjianmo@2. 选择数学建模夏令营题目的队请到数学系登记一下,便于跟老师交流。
全国数学建模组委会2012年夏令营赛题/苏北地区2012年建模竞赛试题/3. 所有参赛同学不要有畏难情绪,尽量完成,做到什么程度算什么程度,对于难度大的题目,不一定要完成全部问题。
无论做到什么程度,都要按时提交。
A题原油开采与输送问题某炼油厂有四口自备油井,为了满足炼油厂的需要,炼油厂一方面计划再打一些油井,另一方面从外部购买部分原油。
该炼油厂现有的四口油井经过多年使用后,年产油量也在逐渐减少,在表1中给出它们在近9年来的产油量粗略统计数字。
表1 现有各油井在近几年的产油量(万吨)根据专家研究和预测,拟计划打的8口油井基本情况如下:表2 打井费用(万元)和当年产油量(万吨)每口油井的年产油量还会以平均每年10%左右的速率减少炼油厂与附近一个油田的输油管道距离20公里,铺设管道的费用为L.0(万元),QP51.066其中Q表示每年的可供油量(万吨/年),L表示管道长度(公里)。
铺设管道从开工到完成需要三年时间,且每年投资铺设管道的费用为万元的整数倍。
要求完成之后,每年能够通过管道至少提供100万吨油。
炼油厂从2010年开始,连续三年,每年最多可提供60万元用于打井和铺设管道,为了保证从2012至2016年这五年间每年分别能至少获得150、160、170、180、190万吨油,请作出一个从2010年起三年的打井和铺设管道计划,以使整个计划的总开支尽量节省。
B稀土资源的开发与储备问题囤积中国廉价稀土。
目前美国90%以上稀土由中国进口,美国政府为保护本土的稀土资源采取了严厉的强制措施,不但完全停止出口,还封存矿山。
西安邮电大学2011-2012第一学期《数学建模》选修课试题卷班级:软件1003班姓名:学号:成绩:一、解释下列词语,并举例说明(每小题满分5分,共15分)1.模型答:模型:所研究的系统、过程、事物或概念的一种表达形式,也可指根据实验、图样放大或缩小而制作的样品,一般用于展览或实验或铸造机器零件等用的模子。
例如飞机模型,用压制或浇灌方法使材料成为一定形状的工具。
通称“模型”。
2.数学模型答:数学模型:用数学语言描述的一类模型。
数学模型可以是一个或一组代数方程、微分方程、差分方程、积分方程或统计学方程,也可以是它们的某种适当的组合,通过这些方程定量地或定性地描述系统各变量之间的相互关系或因果关系。
除了用方程描述的数学模型外,还有用其他数学工具,如代数、几何、拓扑、数理逻辑等描述的模型。
需要指出的是,数学模型描述的是系统的行为和特征而不是系统的实际结构。
3.抽象模型答:抽象模型:是三维建模里这么称呼的就跟抽象雕塑的一样的。
实际不存在,理论上却存在,并用思维对事物进行客观认识的理论或者框架。
对获得的感性材料和感性经验,运用理性思维进行一番老粗取梢、去伪存真、由此及彼、由表及里的改造制作工夫,去掉事物非本质的、表面的、偶然的东西,抽取出事物本质的、内在的、必然的东西,揭示客观对象的本质和规律而建立的模型。
二、简答题(每小题满分8分,共24分)1.模型的分类答:按照模型替代原型的方式,模型可以简单分为形象模型和抽象模型两类,形象模型:直观模型、物理模型、分子结构模型等;抽象模型:思维模型、符号模型,数学模型等。
2.数学建模的基本步骤答:(1)建模准备:数学建模是一项创新活动,它所面临的课题是人们在生产和科研中为了使认识和实践进一步发展必须解决的问题。
建模准备就是要了解问题的实际背景,明确建模的目的,掌握对象的各种信息,弄清实际对象的特征,情况明才能方法对;(2)建模假设:根据实际对象的的特征和建模的目的,在掌握必要资料的基础上,对原型进行抽象、简化,把那些反映问题本质属性的形态、量及其关系抽象出来,简化掉那些非本质的因素,使之摆脱原型的具体复杂形态,形成对建模有用的信息资源和前提条件,并且用精确的语言作出假设,是建模过程关键的一步。
承诺书我们仔细阅读了中国大学生数学建模竞赛的竞赛规则.我们完全明白,在竞赛开始后参赛队员不能以任何方式(包括电话、电子邮件、网上咨询等)与队外的任何人(包括指导教师)研究、讨论与赛题有关的问题。
我们知道,抄袭别人的成果是违反竞赛规则的, 如果引用别人的成果或其他公开的资料(包括网上查到的资料),必须按照规定的参考文献的表述方式在正文引用处和参考文献中明确列出。
我们郑重承诺,严格遵守竞赛规则,以保证竞赛的公正、公平性。
如有违反竞赛规则的行为,我们将受到严肃处理。
我们授权全国大学生数学建模竞赛组委会,可将我们的论文以任何形式进行公开展示(包括进行网上公示,在书籍、期刊和其他媒体进行正式或非正式发表等)。
我们参赛选择的题号是(从A/B/C/D中选择一项填写): B 我们的参赛报名号为(如果赛区设置报名号的话):所属学校(请填写完整的全名):贵州师范大学参赛队员 (打印并签名) :1. 宋家贵2. 樊佐举3. 李红指导教师或指导教师组负责人 (打印并签名):教练组日期: 2012 年 09 月 10 日赛区评阅编号(由赛区组委会评阅前进行编号):编号专用页赛区评阅编号(由赛区组委会评阅前进行编号):全国统一编号(由赛区组委会送交全国前编号):全国评阅编号(由全国组委会评阅前进行编号):太阳能小屋的设计摘要随着太阳能在日常生活中的普及,研究太阳能光伏发电系统也因此具有重要的意义。
为了解决问题一,首先对太阳能电池进行筛选,这是一个最优化问题,通过对小屋最大经济效率的计算,进而得到太阳能电池板的最优组合。
为了使小屋的发电总量、经济效益最大,从而决定了各电池组件之间的数量及连接方式,选择逆变器的数量和容量。
对于问题二,为了实现太阳能光伏电池板最佳倾角的设计及优化[1],通过MATLAB 建立倾斜放置的电池组件接收太阳辐射模型,计算得到光伏板上的辐射能,进而建立倾斜面上总辐射的函数,该函数是关于斜面倾斜角的一个函数,通过求解该函数的极大值,从而得到光伏太阳能电池板的最佳倾角。
数学建模作业题注意事项:作业共十题,每题十分,全部是比较简单的建模计算题,题目既是课本上的习题,在课本304~315有参考解答,又是在线题库的题目,在题库里有更详细的解答。
学员应该先自己动脑筋解决,然后才参考一下课本及题库的解答。
评分高低主要是看完成作业的态度、独立程度和表达清晰程度。
上传的作业必须是包括全部作业的单独一份word文档,必须自己录入,不允许扫描,不允许直接插入题库答案中的图片。
严重违反者,不及格。
请于有效期结束前两周(11月31日24时之前)提交上传作业,教师在12月1~3日第一次批改,请学员在12月4~5日查看成绩,不及格的学员可以在课程答疑栏目提出或者课程论坛提出重交申请,12月6~7日教师删除原作业后,这些学员可以在12月15日之前重交作业。
每人只有一次重交机会。
作业题与考试相关(当然不会一模一样),认真完成作业的学员,必将在考试取得好成绩。
一、教材76页第1章习题1第7题(来自高中数学课本的数学探究问题,满分10分)表1.17是某地一年中10天的白昼时间(单位:小时),请选择合适的函数模型,并进行数据拟合.表1.17 某地一年中10天的白昼时间日期1月1日2月28日3月21日4月27日5月6日白昼时间 5.59 10.23 12.38 16.39 17.26 日期6月21日8月14日9月23日10月25日11月21日白昼时间19.40 16.34 12.01 8.48 6.13答:根据地理常识,某地的白昼时间是以一年为周期而变化的,以日期在一年中的序号为自变量x,以白昼时间为因变量y,则根据表1.17的数据可知在一年(一个周期)内,随着x的增加,y先增后减,y大约在6月21日(夏至)达到最大值,在12月21日(冬至)达到最小值,在3月21日(春分)或9月21日(秋分)达到中间值。
选择正弦函数作为函数模型。
根据表1.17的数据,推测A,b和的值,作为非线性拟合得预测该地12月21日的白昼时间为5.49小时。
2012 年美国大学生数学建模竞赛MCM、ICM 试题2012 MCM A: The Leaves of a Tree“How much do the leaves on a tree weigh?” How might one estimate the actual weight of the leaves (or for that matter any other parts of the tree)? How might one classify leaves? Build a mathematical model to describe and classify leaves. Consider and answer the following:▪Why do leaves have the various shapes that they have?▪Do the shapes “minimize” overlapping individual shadows that are cast, so as to maximize exposure? Does the distrib ution of leaves within the “volume” of the tree and its branches effect the shape?▪Speaking of profiles, is leaf shape (general characteristics) related to tree profile/branching structure?▪How would you estimate the leaf mass of a tree? Is there a correlation between the leaf mass and the size characteristics of the tree (height, mass, volume defined by the profile)?In addition to your one page summary sheet prepare a one page letter to an editor of a scientific journal outlining your key findings.2012 MCM B: Camping along the Big Long RiverVisitors to the Big Long River (225 miles) can enjoy scenic views and exciting white water rapids. The river is inaccessible to hikers, so the only way to enjoy it is to take a river trip that requires several days of camping. River trips all start at First Launch and exit the river at Final Exit, 225 miles downstream. Passengers take either oar- powered rubber rafts, which travel on average 4 mph or motorized boats, which travel on average 8 mph. The trips range from 6 to 18 nights of camping on the river, start to finish.. The government agency responsible for managing this river wants every trip to enjoy a wilderness experience, with minimal contact with other groups of boats on the river. Currently, X trips travel down the Big Long River each year during a six month period (the rest of the year it is too cold for river trips). There are Y camp sites on the Big Long River, distributed fairly uniformly throughout the river corridor. Given the rise in popularity of river rafting, the park managers have been asked to allow more trips to travel down the river. They want to determine how they might schedule an optimal mix of trips, of varying duration (measured in nights on the river) and propulsion (motor or oar) that will utilize the campsites in the best way possible. In other words, how many more boat trips could be added to the Big Long River’s rafting season? The river managers have hired you to advise them on ways in which to develop the best schedule and on ways in which to determine the carrying capacity of the river, remembering that no two sets of campers can occupy the same siteat the same time. In addition to your one page summary sheet, prepare a one page memo to the managers of the river describing your key findings.。
福建师范大学第九届大学生数学建模竞赛暨2012年全国大学生数学建模竞赛选拔赛题目注意:1、请在A题和B题中任选一道题作答;2、答卷以论文方式提交,书写格式参照正式发表的论文,包括论文名、作者姓名、中文摘要、内容(问题分析、模型假设、模型建立、模型求解、模型验证等方面)、参考文献(如果是引用互联网上的文章也要注明网址)和附录(例如计算过程中编写的程序);3、答卷统一使用WORD编排,按照比赛注意事项的要求发送电子版论文,并上交用A4规格的复印纸打印的纸质版论文。
4、请在论文中注明学院、专业、学号、联系电话、电子邮箱。
A题汽车公司的生产计划与决策某汽车公司拟生产一批新款式的轿车,初步确定有以下几种配置方案可供选择(括号内为成本价):发动机E 2.0L(e1=2.1万元),1.8 L(e2=1.7万元),1.6L(e3=1.5万元)换挡D 手动(d1=1.3万元)自动(d2=2.2万元)天窗W 无天窗(w1=0万元)手动天窗(w2=0.5万元),电动天窗(w3=0.8万元)整车的其他成本是C0=8万元。
(1)各种车型的预计售价和市场需求量如表1,试确定每一种车型的生产成本和预计销售利润。
(2)如果该汽车公司有10条生产线,每条生产线每天工作8小时,试问应该如何安排生产计划可使每月(按30天计算)所获利润最大?(3)公司市场情报部门预测到未来一段时期各种车型的市场需求量会增加一倍,故考虑将生产线由原来的10条增加到15条,此外,考虑到同时生产两种或两种以上配置的轿车的成本较高,公司决定只选择一种配置车型进行生产,同时将生产线由10条增加到15条,此时应该如何安排生产计划可使每月(按30天计算)所获利润最大?(4)由于问题(3)中的市场需求是一个预测值,随着市场行情的变化,实际需求量与该值可能有一定的误差。
因此按预测数据做出的生产计划可能有一定的风险因素。
进一步考虑预期市场的销售量是按一定的概率分布来实现的,具体的概率分布如表2所示。
2012年大学生数学建模竞赛赛题注意:1. 本处列了3个题目,各队可以从中任选一个完成,也可以从2012年数学建模夏令营题目中选取一个完成。
因这些题目均有一定难度,因此交卷时间推迟一周,就是到5月15日交卷。
纸质稿提交理学院团委,电子版发送zbjianmo@2. 选择数学建模夏令营题目的队请到数学系登记一下,便于跟老师交流。
全国数学建模组委会2012年夏令营赛题/苏北地区2012年建模竞赛试题/3. 所有参赛同学不要有畏难情绪,尽量完成,做到什么程度算什么程度,对于难度大的题目,不一定要完成全部问题。
无论做到什么程度,都要按时提交。
A题原油开采与输送问题某炼油厂有四口自备油井,为了满足炼油厂的需要,炼油厂一方面计划再打一些油井,另一方面从外部购买部分原油。
该炼油厂现有的四口油井经过多年使用后,年产油量也在逐渐减少,在表1中给出它们在近9年来的产油量粗略统计数字。
表1 现有各油井在近几年的产油量(万吨)根据专家研究和预测,拟计划打的8口油井基本情况如下:表2 打井费用(万元)和当年产油量(万吨)炼油厂与附近一个油田的输油管道距离20公里,铺设管道的费用为L.0(万元),QP51.066其中Q表示每年的可供油量(万吨/年),L表示管道长度(公里)。
铺设管道从开工到完成需要三年时间,且每年投资铺设管道的费用为万元的整数倍。
要求完成之后,每年能够通过管道至少提供100万吨油。
炼油厂从2010年开始,连续三年,每年最多可提供60万元用于打井和铺设管道,为了保证从2012至2016年这五年间每年分别能至少获得150、160、170、180、190万吨油,请作出一个从2010年起三年的打井和铺设管道计划,以使整个计划的总开支尽量节省。
B稀土资源的开发与储备问题囤积中国廉价稀土。
目前美国90%以上稀土由中国进口,美国政府为保护本土的稀土资源采取了严厉的强制措施,不但完全停止出口,还封存矿山。
日本92%的稀土依赖中国进口,据《金融时报》,日本只将进口的1/3用于生产,其余用做战略储备。
2010年10月10日,香港《明报》社评指出,科技大国日本早在20年前就开始落实稀土储备,日本的策略具有深厚战略意图。
业内人士曾估计,日本储备的稀土已够用40至50年。
2010年10月16日,中国商务部官员表示,中国现有的稀土资源仅能维持未来15至20年的需求,有可能还需要进口。
2010年11月17日,媒体报道:中国前9月对日出口稀土增长167%,占出口总量49% 今年前9个月中国出口稀土3.22万吨,其中对日本出口1.6万吨,同比增长167%,占中国稀土出口总量的49.8%;对美国出口稀土6200吨,占出口总量19%,同比增长5.5% 商务部新闻发言人姚坚16日在回答记者提问时介绍说,今年前9个月中国出口稀土3.22万吨,其中对日本出口1.6万吨,同比增长167%,占中国稀土出口总量的49.8%。
姚坚介绍说,1至9月,中国稀土出口平均价格为每吨1.48万美元。
除了日本是中国稀土出口的主要目的国外,前9个月中国对美国出口稀土6200吨,全年占出口总量19%,同比增长5.5%。
2010年我国出口稀土39813吨,比原计划30258吨高出9555吨。
2012年3月13日:美国总统奥巴马专门就对华贸易问题发表讲话,并罕见地亲自出面宣布美国已联合欧盟和日本向世界贸易组织(WTO)提起一项针对中国限制稀土出口的贸易诉讼。
请完成以下问题:1. 搜集关于中国稀土的数据,包括我国和世界各国1990年以来稀土生产、使用、储量、开采、出口量、外汇收入等相关数据。
2. 根据收集的数据,建立相应数学模型,对我国未来五年的稀土储量进行预测。
3. 根据我国未来的需要,通过建立数学模型,说明我国应该如何合理管理和开发稀土资源?4. 完成1000-1500字的报告,阐明你对我国稀土开发利用的意见和建议。
C题碳排放约束下的江苏省煤炭消费量预测(本题是苏北地区2012年数学建模赛题)1978年改革开放以来,中国的经济发展取得了举世瞩目的成就。
2010年国内生产总值达到39.8万亿元,跃居世界第二位,国家财政收入达到8.3万亿元,“十一五”期间实现GDP 年均增长11.2%。
但是中国经济的高速增长是建立在高投入、高消耗、低效益的粗放型生产方式上,对中国的能源消耗和环境保护产生了巨大的压力。
煤炭是我国经济发展不可缺少的基础能源,中国煤炭消费量呈现指数形式增长,从1953年的7145万吨到2010年的312236万吨,翻了近44倍。
2007年2月至11月间,联合国政府气候变化专门委员会(IPCC)陆续发布的第四次气候变化评估的四个部分指出地球表面气温在过去的一百年间上升了0.74℃,到2100年可能比1980~1999年时高出1.1℃~6.4℃;而且在过去50年间,全球气候变暖超过90%的可能性与人类使用的石油等化石燃料产生的温室气体有关。
现有研究表明,全球气候变暖危及能源、粮食、水资源、生态和公共卫生等,将直接影响人类的生存和发展,给全球的可持续发展带来了严峻的挑战,已经被国际社会公认为威胁人类生存安全的最重大环境问题。
目前,大气中温室气体的水平或存量相当于大约430ppm二氧化碳,这个浓度已经使全球变暖了0.5℃以上,而且由于气候系统的惯性,气温还在继续上升,到2035年温室气体在大气中的存量可能将达到550ppm二氧化碳当量。
未来几十年里,全球平均温度变化超过5℃的风险概率目前至少是50%,这将把人类带入未知的更可怕世界。
不断加剧的温室效应将会严重影响全球经济发展,其严重程度不亚于两次世界大战加上经济大萧条。
为了遏制全球气候变暖,联合国、国际性组织和世界各国政府展开了积极的努力。
1992年签署的《联合国气候变化框架公约》(简称《公约》),被认为是冷战结束后最重要的国际公约之一。
1997年12月,在日本京都召开的《公约》第三次缔约方大会上达成了《京都议定书》(简称《议定书》),《议定书》要求三十多个国家(包括发达国家和经济转型国家)在2008至2012年使温室气体的排放量平均比1990年减少5.2%以上。
在得到占发达国家1990年二氧化碳排放总量的55%以上的缔约发达国家批准后,《议定书》于2005年2月16日正式生效。
这标志着国际社会进入了一个实质性减排温室气体的阶段,人类发展史上首次具有了一个国际法律框架,用以限制人类活动对地球系统的碳循环和气候变化的干扰。
2005年启动的后定都谈判,2007年国际社会达成的“巴厘路线图”,2009年召开的哥本哈根会议等,都是国际社会所作出的具有标志性的努力。
在此背景下,以减少碳排放为核心内容的低碳经济应运而生。
20世纪90年代以来,中国始终把可持续发展战略作为基本国策,转变以浪费资源和牺牲环境为代价的传统经济发展模式,努力实现经济可持续发展、社会全面进步、资源永续利用、环境不断改善和生态良性循环的协调统一。
在“十一五”规划经济社会发展主要指标中,除了以往的环境指标,还新增了“十一五”末单位GDP能源消耗比“十五”期末降低20%左右这一约束性指标,而这个指标最终在“拉闸限电”等硬性措施下勉强完成19.1%。
中国已于2009年11月26日正式对外宣布控制温室气体排放的清晰量化目标,决定到2020年使单位国内生产总值二氧化碳排放强度在2005年的基础上下降40%~45%。
并且,在第十二个五年规划纲要中,中国新增单位国内生产总值二氧化碳排放降低17%的指标,二氧化碳排放问题已成为我国参与国际竞争中不可回避的问题。
从节能指标到二氧化碳减排指标的确立,中国政府已经把能源环境问题上升到从未有过的高度,也证明中国努力推行实施低碳经济发展的决心。
2011年8月31日,国务院关于印发《“十二五”节能减排综合性工作方案》的通知。
全国31个省市自治区被划分为5类地区,每类地区确定一个节能指标,分别为降低18%、17%、16%、15%和10%。
第一类地区包括天津、上海、江苏、浙江和广东,单位GDP能耗降低率最高,为18%;第二类地区包括北京、河北、辽宁和山东,单位GDP能耗降低率为17%;第三类地区包括山西、吉林、黑龙江、安徽、福建、江西、河南、湖北、湖南、重庆、四川和陕西,单位GDP能耗降低率为16%;第四类地区包括内蒙古、广西、贵州、云南、甘肃和宁夏,单位GDP能耗降低率为15%;第五类地区包括海南、西藏、青海和新疆,其单位GDP 能耗降低率为10%。
2011年12月1日,国务印发了《“十二五”控制温室气体排放工作方案》的通知,方案对目标任务作了分解,明确了各地区单位生产总值二氧化碳排放下降指标,江苏省的下降目标是19%,略低于广东省的19.5%。
江苏省“十二五”规划中也给出了到2015年非化石能源占一次能源消费比重为7%左右的目标。
至于到2020年的减排目标,参考以及国务院在2009年公布的我国到2020年单位GDP二氧化碳排放减少40~45%的目标。
具体江苏省碳排放约束指标见表1。
表1 江苏省碳排放约束指标碳排放约束指标名称单位地区生产总值能耗降低(%)单位地区生产总值二氧化碳排放减少(%)非化石能源占一次能源消费比重(%)指标值2015年18 19 7左右2020年50注:2015年指标值是以2010年为基期,2020年指标值是以2005年为基期。
根据2007年IPCC第四次评估报告,温室气体增加的主要来源是化石燃料燃烧。
其中化石燃料燃烧所导致的二氧化碳排放在2004年占总碳排放将近95.3%。
CO2排放量采用排放系数法,碳排放系数是指每一种能源燃烧或使用过程中单位能源所产生的碳排放数量。
排放系数法是一种由IPCC向各国推荐的温室气体排放的清单编制方法。
碳排放量到CO2排放量的转换系数为44/12,即单位质量碳排放相当于44/12质量的CO2排放。
对于每种能源的单位能耗碳排放系数,不同使用者采用的估计值是有差别的(见表2)。
表2 各种能源的碳排放系数(单位:万t/万t)数据来源煤炭石油天然气水电、核电DOE/EIA1 0.7020 0.4780 0.3890 0日本能源经济研究所0.7560 0.5860 0.4490 0国家发改委能源所20.7476 0.5825 0.4435 01DOE:美国能源部;EIA:美国能源信息署。
2资料来源: 国家发展和改革委员会能源研究所. 中国可持续发展能源暨碳排放情景分析[R]. 2003.国家科委气候变化项目0.7260 0.5830 0.4090 0以煤炭为主的化石能源的消费是引以温室气体排放的主要诱因。
一方面,经济的发展离不开煤炭为主的能源支撑;另一方面,环境承载力迫使煤炭为主的化石能源不能盲目的无限制利用,这是一个有能源开发利用的两难问题。