大学英语图表作文写作
- 格式:ppt
- 大小:66.50 KB
- 文档页数:11

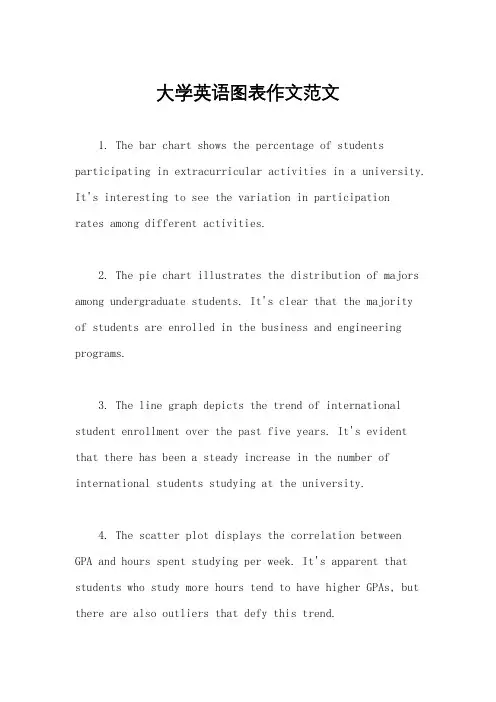
大学英语图表作文范文1. The bar chart shows the percentage of students participating in extracurricular activities in a university. It's interesting to see the variation in participationrates among different activities.2. The pie chart illustrates the distribution of majors among undergraduate students. It's clear that the majorityof students are enrolled in the business and engineering programs.3. The line graph depicts the trend of international student enrollment over the past five years. It's evident that there has been a steady increase in the number of international students studying at the university.4. The scatter plot displays the correlation between GPA and hours spent studying per week. It's apparent that students who study more hours tend to have higher GPAs, but there are also outliers that defy this trend.5. The table presents the average class sizes in various departments. It's notable that classes in the humanities department tend to be smaller compared to those in the science and technology departments.6. The heatmap indicates the peak times of library usage throughout the day. It's clear that the library is most crowded during the late afternoon and evening hours.7. The radar chart showcases the skills and competencies developed by students through internships.It's impressive to see the diverse range of skills that students have acquired in areas such as communication, problem-solving, and teamwork.8. The histogram displays the distribution of student grades in a particular course. It's evident that the majority of students fall within the average grade range, with a smaller number of students achieving high or low grades.9. The box plot illustrates the variability in student performance on a standardized test. It's interesting to see the range of scores, as well as any outliers that may indicate exceptional performance or areas for improvement.10. The area chart shows the allocation of university funding across different departments. It's clear that a significant portion of the budget is allocated to research and development, reflecting the university's commitment to academic excellence.。
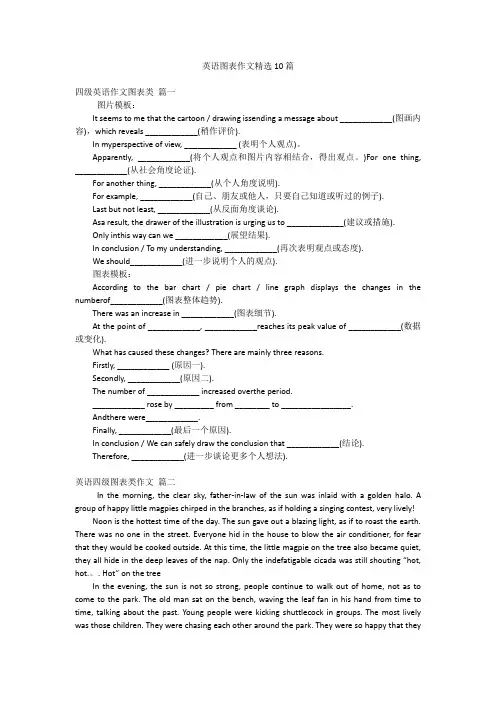
英语图表作文精选10篇四级英语作文图表类篇一图片模板:It seems to me that the cartoon / drawing issending a message about ____________(图画内容),which reveals ____________(稍作评价).In myperspective of view, ____________ (表明个人观点)。
Apparently, ____________(将个人观点和图片内容相结合,得出观点。
)For one thing, ____________(从社会角度论证).For another thing, ____________(从个人角度说明).For example, ____________(自己、朋友或他人,只要自己知道或听过的例子).Last but not least, ____________(从反面角度谈论).Asa result, the drawer of the illustration is urging us to _____________(建议或措施).Only inthis way can we ____________(展望结果).In conclusion / To my understanding, ____________(再次表明观点或态度).We should____________(进一步说明个人的观点).图表模板:According to the bar chart / pie chart / line graph displays the changes in the numberof____________(图表整体趋势).There was an increase in ____________(图表细节).At the point of ____________, ____________reaches its peak value of ____________(数据或变化).What has caused these changes? There are mainly three reasons.Firstly, ____________ (原因一).Secondly, ____________(原因二).The number of ____________ increased overthe period.____________ rose by _________ from ________ to ________________.Andthere were____________.Finally, ____________(最后一个原因).In conclusion / We can safely draw the conclusion that ____________(结论).Therefore, ____________(进一步谈论更多个人想法).英语四级图表类作文篇二In the morning, the clear sky, father-in-law of the sun was inlaid with a golden halo. A group of happy little magpies chirped in the branches, as if holding a singing contest, very lively!Noon is the hottest time of the day. The sun gave out a blazing light, as if to roast the earth. There was no one in the street. Everyone hid in the house to blow the air conditioner, for fear that they would be cooked outside. At this time, the little magpie on the tree also became quiet, they all hide in the deep leaves of the nap. Only the indefatigable cicada was still shouting “hot, hot.。
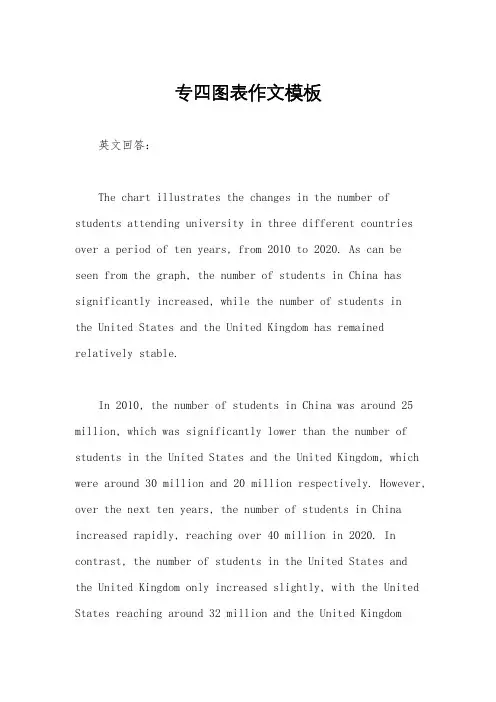
专四图表作文模板英文回答:The chart illustrates the changes in the number of students attending university in three different countries over a period of ten years, from 2010 to 2020. As can be seen from the graph, the number of students in China has significantly increased, while the number of students inthe United States and the United Kingdom has remained relatively stable.In 2010, the number of students in China was around 25 million, which was significantly lower than the number of students in the United States and the United Kingdom, which were around 30 million and 20 million respectively. However, over the next ten years, the number of students in China increased rapidly, reaching over 40 million in 2020. In contrast, the number of students in the United States and the United Kingdom only increased slightly, with the United States reaching around 32 million and the United Kingdomreaching around 22 million in 2020.There are several reasons for this trend. Firstly,China has experienced rapid economic growth over the past decade, which has led to an increase in the number of families who can afford to send their children to university. Secondly, the Chinese government has invested heavily in education, with the aim of producing more highly skilled graduates who can contribute to the country's economic development. Finally, the popularity of online education has also contributed to the increase in the number of students in China.中文回答:这张图表展示了三个不同国家在2010年至2020年期间大学生人数的变化情况。

英语作文图表作文(五篇范文)第一篇:英语作文图表作文图表分析作文1As is clearly shown in the table/ figure/ graph / chart, 图表总体描述 between 年代 and 年代.Especially, 突出的数据变化.There are three reasons for 具体表示急剧上升、下降或特殊现象的词.To begin with, 原因一.In addition / Moreover, 原因二.For example, 具体例证.Last but no least, 原因三.In short,总结上文.As far as I am concerned, / For my part, / As for me,作者自己的观点.On the one hand, 理由一.On the other hand, 理由二.In brief,总结上文.图表分析作文2The table / figure / graph / chart shows that 图表总述from 年代to年代.It is self-evident that突出的数据变化.Three possible reasons contribute to 具体表示急剧上升、下降或特殊现象的词或代词代替上文内容.One reason is that原因一.Another reason is that 原因二.For instance,举例证.What’s more原因三.As a result, 重述上文之趋势.However, in my opinion 作者观点.For one thing,理由一.For another, 理由二.T o sum up,总结上文.图表分析作文3It can be seen from the table / figure / graph / chart that图表总述between年代and年代.Especially,突出的数据变化.Why are there such great changes during 图表涉及的年头数years? There are mainly two reasons explaining具体表示急剧上升、下降或特殊现象的词或代词代替上文内容.First,原因一.In the old days,比较法说明过去的情况.But now,说明现在的情况.Second,原因二.As a result,总结上文.In my viewpoint,作者自己的观点.On the one hand,论点一.On the other hand,论点二.图表分析作文4As the table / figure / graph / chart shows,图表总述in the past years年代.Obviously,突出的数据变化.Why are there suchsharp contrasts during 图表涉及的年头 years?Two main factors contribute to具体表示急剧上升、下降或特殊现象的词或代词代替上文内容.First of all,原因一.In the past,比较法说明过去的情况.But now 说明现在的情况.Moreover,原因二.Therefore,总结上文.As I see it,作者自己的观点.For one thing,论点一.For another,论点二.图表作文补充句型• As is shown in the graph…如图所示…•The graph shows that…图表显示…•As can be seen from the table,…从表格中可以看出…•From the chart, we know that…从这张表中,我们可知…• All these data clearly prove the fact that… 所有这些数据明显证明这一事实,即…• The increase of ….In the ci ty has reached to 20%.….在这个城市的增长已达到20%.• In 1985, the number remained the same.1985年,这个数字保持不变.• There was a gradual decline in 1989.1989年,出现了逐渐下降的情况.第二篇:英语图表作文图表描述专题训练(一)这类作文时,注意以下几点:第一,审题时,除了要把握好图表的表层信息外,还要分析图标的深层含义,如原因、根源、可能的发展趋势等。
图表作文图表作文提示部分包括图表和文字要点提示两部分。
图表的类型主要有:圆形(饼型)图(pie chart)、柱形图(直型图)(graph)、曲线图(chart)和数据统计表(表格)(table)。
图表作文的写作容包括综合理解、客观详述和主观表达。
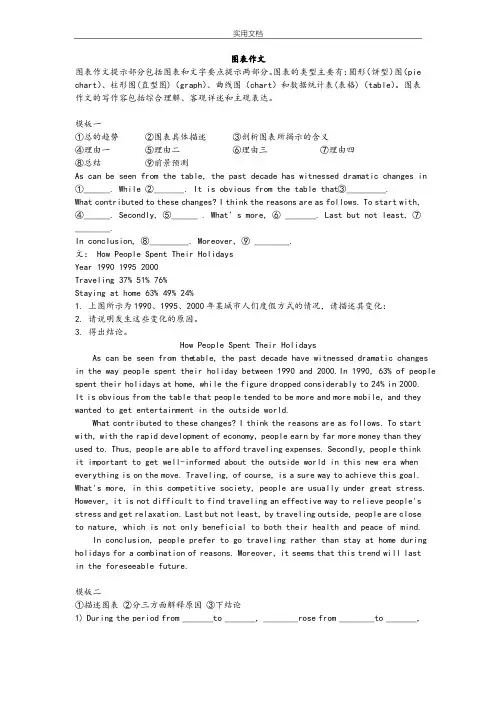
模板一①总的趋势②图表具体描述③剖析图表所揭示的含义④理由一⑤理由二⑥理由三⑦理由四⑧总结⑨前景预测As can be seen from the table, the past decade has witnessed dramatic changes in ①______. While②_______. It is obvious from the table that③_________.What contributed to these changes?I think the reasons are as follows.To start with,④______. Secondly,⑤______ . What’s more,⑥ _______. Last but not least,⑦________.In conclusion,⑧_________. Moreover,⑨ ________.文: How People Spent Their HolidaysYear 1990 1995 2000Traveling 37% 51% 76%Staying at home 63% 49% 24%1.上图所示为1990、1995、2000年某城市人们度假方式的情况,请描述其变化:2.请说明发生这些变化的原因。
3.得出结论。
How People Spent Their HolidaysAs can be seen from the table,the past decade have witnessed dramatic changes in the way people spent their holiday between 1990 and 2000.In 1990, 63% of people spent their holidays at home,while the figure dropped considerably to24%in2000.It is obvious from the table that people tended to be more and more mobile,and they wanted to get entertainment in the outside world.What contributed to these changes?I think the reasons are as follows.To start with,with the rapid development of economy,people earn by far more money than they used to.Thus,people are able to afford traveling expenses.Secondly,people thinkit important to get well-informed about the outside world in this new era when everything is on the move.Traveling,of course,is a sure way to achieve this goal. What's more, in this competitive society, people are usually under great stress. However,it is not difficult to find traveling an effective way to relieve people's stress and get st but not least,by traveling outside,people are closeto nature, which is not only beneficial to both their health and peace of mind.In conclusion, people prefer to go traveling rather than stay at home during holidays for a combination of reasons.Moreover,it seems that this trend will lastin the foreseeable future.模板二①描述图表②分三方面解释原因③下结论1)During the period from_______to_______,________rose from________to_______,while _______ decreased from _______ to _______.2)We believe that three reasons can account for this phenomenon.First,____.Second,____. Third, _____.3) ___.We are happy to see that things are becoming better and better nowadays. We can imagine that ___.文: Health Gains in Developing Countries1.以下图为依据描述发展中国家的期望寿命(1ife expectancy)和婴儿死亡率(infant mortality)的变化情况2.说明引起变化的各种原因Health Gains in Developing CountriesDuring the period from1960to1990,the life expectancy of developing countries rose from 40 years to nearly 60 years, while infant mortality decreased from 200 deaths per 1000 births to around 100.We believe that three reasons can account for this phenomenon. First, economy develops quickly in developing countries during this period, and living quality improves significantly as a result.Second,people's health conditions also become better and better with the development of national health care systems. When they become richer and richer, they care more about personal health conditions. Third, medical sciences also develop at a fantastic speed,and it is much safer for mothersto give birth.We are happy to see that things are becoming better and better nowadays.We can imagine that people will live longer and the infant mortality will again fall. [1996.6. CET-6]模板三①描述图表②解释图表③补充解释1)During the period between_______and________,________declined abruptly from_______ to ________, while ________ increased sharply from ________ to _______. 2)Several reasons can account for this pared with_________is much cheaper and more convenient__________ . Apart from that, _________.3) However, there are still a number of people who _________, generally for two reasons. On one hand,________. On the other hand, ________.文: Film Is Giving Way to TV1.电影观众越来越少2.电视观众越来越多,因为……3.然而,还是有人喜欢看电影,因为……Film Is Giving Way to TVDuring the period between1975and1985,film-goers declined abruptly from85,000to about12,000,while TV-watchers increased sharply from5,000to more than100,000.Several reasons can account for this phenomenon. Compared with a film, TV is much cheaper and more convenient--you don't have to leave your house at all.Apart from that, you have many choices while watching TV, but a film concentrates on a certain topic.However, there are still a number of people who enjoy going to the cinema,generally for two reasons. On the one hand, the audio-visual effect of a cinema is much better. On the other hand, in a quiet and comfortable place such as a cinema,you can concentrate on what you are watching and get the most of the film.作业:2002年06月英语四级写作试题Directions: For this part, you are allowed thirty minutes to write a composition on the topic Student Use of Computers.You should write at least 120words,and base your composition on the chart and the outline given below:181614121086420三维柱形图 11990199520001.上图所示为1990年、1995年、2002年某校大学生使用计算机的情况,请描述其变化;2.请说明发生这些变化的原因(可从计算机的用途、价格或社会发展等方面加以说明);3.你认为目前大学生在计算机使用中有什么困难或问题。

英语图表作文模板及范文(通用12篇)英语图表作文模板及范文第1篇The table/chart diagram/graph shows (that)According to the table/chart diagram/graphAs (is) shown in the table/chart diagram/graphAs can be seen from the table/chart/diagram/graph/figures,figures/statistics shows (that)……It can be seen from the figures/statisticsWe can see from the figures/statisticsIt is clear from the figures/statisticsIt is apparent from the figures/statisticstable/chart/diagram/graph figures (that) ……table/chart/diagram/graph shows/describes/illustrates图表类英语作文范文The past years have witnessed a mounting number of Chinese scholars returning from overseas. As is lively illustrated by the column chart, the number of returnees climbed from a mere thousand in 2023 to over thousand in 2023, at an annual increase rate of around 50%.A multitude of factors may have led to the tendency revealed by the chart, but the following are the critical ones from my perspective. First and foremost, along with the development of Chinese economy andsociety, the number of Chinese studying abroad has been soaring in the past years, which has provided an expanding base for the number of returnees. In the second place, the government has enacted a series of preferential policies to attract overseas Chinese scholars back home. Last but not least, the booming economy, science and technology in this country have generated more attative job opportunites for scholars returning from overseas.The waves of returnees will definitely contribute to this nation’s development, since they have brought back not only advanced science and technology but also pioneering concepts of education and management. With more scholars coming back from overseas, and with the concerted efforts of the whole nation, we have reasons to expect a faster rejuvenation of this country.更多培训课程:苏州个人提升英语更多学校信息:苏州虎丘区朗阁教育机构咨询电话:英语图表作文模板及范文第2篇Students tend to use computers more and more frequently nowadays. Reading this chart, we can find that the average number of hours a student spends on the computer per week has increased sharply. In 1990, it was less than 2 hours; and in 1995, it increased to almost 4 hours, and in 2000, the number soared to 20 hours.Obviously computers are becoming increasingly popular. There areseveral reasons for this change. First, computers facilitate us in more aspects of life. Also, the fast development of the Internet enlarges our demands for using computers. We can easily contact with friends in remote places through the Internet. Besides, the prices of computers are getting lower and lower, which enables more students to purchase them. However, there still exist some problems, such as poor quality, out-of-date designs and so on. And how to balance the time between using computers and studying is also a serious problem. Anyhow, we will benefit a lot from computers as long as we use them properly.英语图表作文模板及范文第3篇As can be clearly seen from the graph/table/chart (As is shown in the table/figure), great changed have taken place in_______, The_________ have/has skyrocketed/jumped from _____ to _____. When it comes to the reasons for the changes, different people give different explanations. Here I shall just give a begin with, ______What’s more,___________, Last but not least, ________. While it is desirable that ___________, there are still some problems and difficulties for __________ Firstly, __________ ,In addition, __________ ,In a word, __________ .以上就是为大家整理的英语专四图表作文范文模板,希望能够对大家有所帮助。
图表类英语作文模板篇一:英语四级图表作文模板(1)模版1According to the chart / graph / diagram / table, we clearly learn that _________. As early as _________,___________. Then,_________. Last,__________. In contrast, by _________,__________. There are many reasons accounting for _________. Firstly, _________.Secondly,__________. Finally,_________. As a result,_________.As far as I am concerned,_________. For one thing,__________. For another,________. In brief, I hold that__________.(2)模版2What is shown in the chart / graph / diagram / table above indicates that in recent years, more and more people pay attention to _________. The number of those who _________ has increased ________, and furthermore,____________.There are two factors responsible for the changes. In the first place,_________. Moreover,__________. Yet, it is noticeable that __________.From the analysis, we can safely draw the conclusionthat__________. It is possible that in the future, the tendency will__________.(3)模版3As is shown inthe chart / graph / diagram / table above, __________ has charged drastically in the past _________. While ___________,now the percentage of__________ is __________. Meanwhile, the number of _________ has soared up to ________.There are mainly two possible reasons contributing to the rapid changes. The first is that _________. Secondly,__________.In my point of view, the changes have a great influence on _________. At the same time,_______. To sum up ,_________.篇二:大学英语四级写作图表类作文模板新东方在线[ ]网络课堂电子教材系列大学英语四级写作图表类作文模板(1)模版1According to the chart / graph / diagram / table, we clearly learn that _________. As early as _________,___________. Then,_________. Last,__________. In contrast, by _________,__________.There are many reasons accounting for _________. Firstly, _________.Secondly,__________. Finally,_________. As aresult,_________.As far as I am concerned,_________. For one thing,__________. For another,________. In brief, I hold that__________.(2)模版2What is shown in the chart / graph / diagram / table above indicates that in recent years, more and more people pay attention to _________. The number of those who _________ has increased ________, and furthermore,____________.There are two factors responsible for the changes. In the first place,_________. Moreover,__________. Yet, it is noticeable that __________.From the analysis, we can safely draw the conclusion that__________. It is possible that in the future, the tendency will__________.新东方在线[ ]网络课堂电子教材系列(3)模版3As is shown in the chart / graph / diagram / table above, __________ has charged drastically in the past _________. While ___________,now the percentage of__________ is __________. Meanwhile, the number of _________ has soared up to ________. There are mainly two possible reasons contributing to the rapid changes. The first is that _________. Secondly,__________.In my point of view, the changes have a great influence on _________. At the same time,_______. To sum up ,_________.篇三:大学英语四级图表作文模板图标作文It is obvious in the table/ graphic that the rate/ number/amount of ___ has undergone dramatic changes. It has gone up/grown/fallen/ dropped considerably in recent years.What is the reason for this change? Mainly there are……. reasons behind the situation reflected in the graphic / table. First of all,……More importantly, …….Most important of all,………From the above discussions, we have enough reason to predict what will happen in the near future. The trend described in the graphic / table will continue for quite a long time.谚语作文第一段:1.The well-known proverb “_____”has long been accepted by all of us. It tells us that________2.There is a famous saying, “______”, which meansthat_______. If you want to be successful, you should_____3.“_____”is a well-known proverb which all of us are familiar with. It means that___________4.Have you ever thought of the famous proverb”___”? tome , it indicates that_____-结论1. Judging from the examples given above , we may safely come to the conclusion that ______. So why not_____?2. From what has been discussed above, we should understand the meaning of “____”more clearly. On the one hand, _______. One the other hand, ________. The best way is to _________。
大学图表作文英语模板Attending college is a significant milestone in many people's lives. It is a time of growth, learning, and exploration. However, it can also be a time of stress, pressure, and uncertainty. In this essay, we will explore the various challenges and opportunities that college presents, as well as the impact it has on students' lives. First and foremost, college is a time of academic challenge. Students are expected to take on a heavy course load, complete assignments, and prepare for exams. This can be incredibly demanding and overwhelming, especially for those who are not used to such a rigorous academic environment. The pressure to excel and meet high expectations can lead to stress, anxiety, and burnout. Many students struggle to balance their academic responsibilities with other aspects of their lives, such as work, extracurricular activities, and socializing. In addition to academic challenges, college also presents social and emotional hurdles. For many students, college is their first time living away from home, which can be a major adjustment. They may feel homesick, lonely, or isolated. Making new friends and finding a sense of belonging in a new environment can be difficult. Moreover, the pressure to fit in and socialize can be overwhelming for some students, leading to feelings of inadequacy or social anxiety. Furthermore, the financial burden of college is a significant concern for many students. The cost of tuition, books, housing, and other expenses can be exorbitant, leading to financial stress and hardship. Some students may have to work multiple jobs or take out loans to afford their education, which can have a negative impact ontheir mental and emotional well-being. The fear of graduating with a mountain of debt can also be a source of anxiety and uncertainty for many students. Despite these challenges, college also presents numerous opportunities for personal and professional growth. It is a time for students to explore their interests, discover their passions, and develop new skills. College provides access to a wide range of resources, such as libraries, research facilities, and expert faculty, which can enrich students' learning experiences. Moreover, college offers opportunities for students to engage in extracurricular activities, internships, and study abroad programs, which can broaden their horizons and enhance their personal and professional development. In addition, college is a time forstudents to form meaningful relationships and build a strong support network. Many students form lifelong friendships and connections with their peers, as well as with faculty and staff. These relationships can provide emotional support, guidance, and mentorship, which are invaluable during the tumultuous college years. Moreover, college is a time for students to explore their identity, values, and beliefs, and to develop a sense of autonomy and independence. In conclusion, college is a time of both challenges and opportunities. It is a period of academic, social, and emotional growth, as well as a time of stress, pressure, and uncertainty. Despite the difficulties that college presents, it is atransformative experience that can shape students' lives in profound ways. It is a time for students to discover their passions, develop new skills, form meaningful relationships, and prepare for their future careers. Ultimately, college is a time for students to learn, grow, and thrive.。
大学英语四六级图表类作文的写作方法大学英语四六级图表类作文的写作方法第一段:说明图表开篇句:As the bar chart shows, the number of people below the poverty line decreased dramatically during the years of 1978 to 1997.扩展句:1、As early as 1978, about 250 million people were under the poverty line.2、Then seven years later, the number became three fifths that of 1978.3、And arriving in the year 1997, the number was reduced to 50 millions.第二段:解释图表变化原因主题句:Several factors contribute to the sharp decrease of the below-poverty population.扩展句:1、 The reform and opening following 1978 enabled the peasants to become much better off.2、And with the development of Chinese economy, that policy also omproved city dwellers lives greatly.3、 Furthermore, the high-tech introduced made it possible for the countrys economy as a whole to take off.4、 All these result in the great fall of the Chinese population below the poverty line.第三段:提出解决办法结尾句:However, a further decrease in the number of poverty-stricken people is faced with some problems.扩展句:1、With quite few employees being laid off, the effect of which is not only discouraging, but also challenging.。
大学生业余活动图表英语作文In the vibrant ecosystem of university life, the amateur activities of students play a pivotal role in shaping their overall development. These activities range from cultural exchanges to sports competitions, each offering a unique set of benefits that enhance the academic experience.At the forefront of these amateur pursuits are sports. Whether it's the thrill of competition in intramural basketball or the camaraderie built through shared training sessions in running clubs, sports provide a healthy outlet for students to engage their bodies and minds. The discipline and teamwork instilled through sports help students develop resilience and leadership skills that are invaluable in their academic and professional careers.Cultural activities also play a significant role in the lives of university students. From language exchange groups to ethnic dance performances, these activities foster a sense of cultural awareness and appreciation. They provide students with an opportunity to explore their ownidentities while also learning to respect and understand the diverse backgrounds of their peers.Another significant aspect of amateur activities is volunteer work. Many students choose to dedicate their free time to causes such as environmental conservation, community development, and educational support. This not only helps them develop a sense of social responsibility but also equips them with practical skills and experience that they can carry forward into their professional lives. Lastly, academic competitions and workshops offer students a chance to extend their learning beyond the classroom. By participating in events like science fairs, debate tournaments, and research seminars, students can hone their critical thinking skills, problem-solving abilities, and communication techniques. These skills are crucial for success in both academic and professional settings.In conclusion, the amateur activities of university students are as diverse as they are beneficial. They provide opportunities for personal growth, cultural understanding, social engagement, and academic excellence.By participating in these activities, students can enrich their university experience and prepare themselves for the challenges and opportunities of the future.**大学生业余活动的多样性**在大学生活的生动生态系统中,学生的业余活动对于塑造他们的全面发展起着至关重要的作用。
(表)/graph(图表,曲线图)/diagram(图表)/chart(图表)Pie chart(饼状图)/bar graph(柱状图)/line graph(曲线图)2.开头的常常利用表达⑴It can be seen from the diagram that...⑵It has been shown from the figures that...⑶It is clear/ apparent from the figures/statistics that…⑷It is clear/ apparent from the table/chart/diagram/graph figures that…⑸The table/chart/diagram/graph shows that…⑹The table/chart/diagram/graph shows/describes/illustrates how…⑺According to the table/chart/diagram/graph,⑻As is shown in the table/chart/diagram/graph,⑼As is vividly betrayed in the table/chart/diagram/graph above,⑽As can be seen from the table/chart/diagram/graph that…⑾From the table/chart/diagram/graph, we can find that…⑿We can see from the chart (table/graph/figures/statistics) that...For example:⑴As is shown by the graph, there has been a rapid increase in the population of the country in the past fiveyears.⑵It can be concluded from the graph that there has been a great decline in birth rates in China in the pastfive years.⑶From the statistics given in the table it can be seen that the average personal income of the Chinesepeople increased (grew 、rose) rapidly from 1985 to 1990.This bar chart describes significant changes in the ownership of houses in a big city in China. It can be seen from the chart that a very noticeable trend from 1990 to 2000 was the dramatic increase in the privateownership of houses as opposed to the huge drop in the state ownership of houses. In 1990, three out of four houses were state-owned. However, by 2000, the percentage of the ownership of private houses has soared to 80%.The above chart reveals that the huge expansion in the private house ownership has been accompanied by a corresponding fall in the state ownership of houses in a span of a decade. (1990-2000)As is suggested ( unfolded / demonstrated / illustrated / mirrored ) in the above chart, with the sharp rise in the private ownership of houses, the state ownership of houses has dramatically ( substantially / alarmingly ) dropped in a passage of a decade. (1990-2000)According to the above chart, there has been a drastic growth in the private ownership of houses, while the state ownership of houses has shrunk steeply over the past decade. ( 1990-2000)From the above chart, we can see distinctly that the private ownership of houses has witnessed an huge rise as distinct from ( as opposed to / in contrast to / in comparison with ) the drastic decrease in the state ownership of houses in a matter of a decade. (1990-2000)2.图表数据描述的常常利用表达1.上升趋势⑴The number of …has increased/rose slightly/slowly/gradually/steadily/significantly/rapidly/dramatically/steeply/suddenly…from…year to…year/ between…year and…year.⑵The number of …has soared/rocketed to/over…in …year/in the year of…⑶There was a very sudden/rapid/dramatic/significant/sharp/steady gradual/slow/slight increase/rise in thenumber of …from…year to…year/ between…year and…year.For example:⑴The number of teaching staff members in this school has decreased to 700 persons.⑵The number of paticipants grew up to 300000 persons.⑶The number of colour TV sets produced by the factory increased (rose , grew , climbed) from 5000 in 1986 to 21000 in 1990.2.下降趋势The number of …has decreased/fallen/dropped slightly/slowly/gradually/steadily/significantly/rapidly/dramatically/steeply/suddenly…from…year to…year/ between…year and…year.There was a very sudden/steep/rapid/dramatic/significant/sharp/steady gradual/slow/slight decrease /decline/reduction/fall/drop in the number of …from…year to…year/ between…year and…year.3.先上升后下降的句型:...... increased slowly during…… and …… but fell sharply in …….A steady increase in …… during …… and …… followed the sharp fall in …….4.先下降后上升的句型:…… fell before …… began to make a recovery ………… continue the recovery, climbing to ………… dropped during …… but increased again in ………… fell and then pick up during ………… collapsed before rising to ……at the end of ……5.波动There was a minor fluctuation between……remained fairly steady fluctuating between…and ……… fluctuated sharply all through ……6.稳固The number of …remained steady/stable from…year to…year/ between…year and…year.The number of…stayed the same from…year to…year/ between…year and…year.There was little change/hardly any change/no change in the number of…from…year to…year/ between…year and…year.… hardly changed through the period between ……and …3.结尾的常常利用表达As the report indicates…One of the most surpris ing finds was…Overall, the chart demonstrate that…From the diagram it can be safely concluded that…In conclusion, …In summary, we can see that…I. 上图所示为某校大学生平均每周利用运算机的时刻: 1990年(2 hours)、1995年(4 hours)、2002年(14 hours),请描述其转变;II. 请说明发生这些转变的缘故(可从运算机的用途、价钱或社会进展等方面加以说明);III. 你以为目前大学生在运算机利用中有什么困难或问题。