深深房A:2010年三季度业绩预告修正公告 2010-10-15
- 格式:pdf
- 大小:58.90 KB
- 文档页数:2
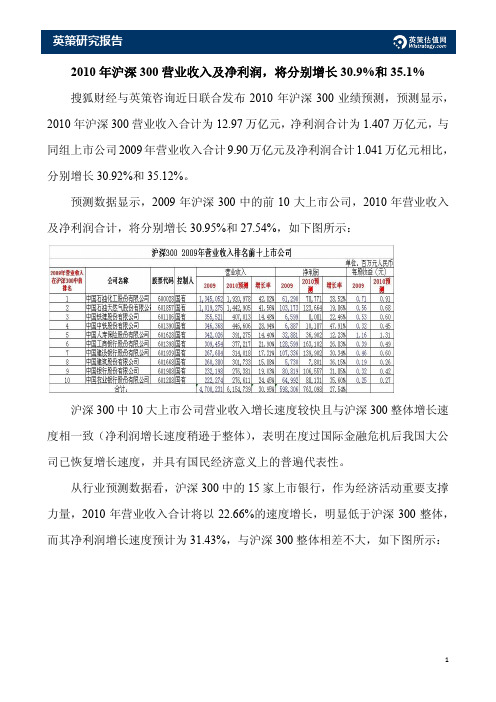
2010年沪深300营业收入及净利润,将分别增长30.9%和35.1%搜狐财经与英策咨询近日联合发布2010年沪深300业绩预测,预测显示,2010年沪深300营业收入合计为12.97万亿元,净利润合计为1.407万亿元,与同组上市公司2009年营业收入合计9.90万亿元及净利润合计1.041万亿元相比,分别增长30.92%和35.12%。
预测数据显示,2009年沪深300中的前10大上市公司,2010年营业收入及净利润合计,将分别增长30.95%和27.54%,如下图所示:沪深300中10大上市公司营业收入增长速度较快且与沪深300整体增长速度相一致(净利润增长速度稍逊于整体),表明在度过国际金融危机后我国大公司已恢复增长速度,并具有国民经济意义上的普遍代表性。
从行业预测数据看,沪深300中的15家上市银行,作为经济活动重要支撑力量,2010年营业收入合计将以22.66%的速度增长,明显低于沪深300整体,而其净利润增长速度预计为31.43%,与沪深300整体相差不大,如下图所示:从沪深300中占比较大,也是国民经济重要支柱产业——建筑建材行业的预测数据看,其中12大建筑建材行业上市公司2010年营业收入及净利润,将分别以19.9%和32.71%的速度增长,低于沪深300整体增长速度,如下图所示:从另一基础产业——钢铁行业的预测数据看,沪深300中17家钢铁企业2010年预计将获得24.34%的营业收入增长率,低于沪深300整体的增占速度,而近125.29%的净利润增长率,系因2009年末整个钢铁行业对库存大幅计提减值准备使盈利基数过低所致,并不意味着钢铁企业盈利能力的提升。
17家钢铁上市公司2010年的预计表现,如下图所示:预测数据进一步显示,在经济复苏情况下,作为经济运行先行官和主要能源供应者的煤炭行业18大上市公司,2010年营业收入和净利润增长率,都与沪深300整体水平相当,分别为30.62%和36.97%,如下图所示:与此同时,能源最终形式的提供者——沪深300中的12大电力行业上市公司,2010年营业收入增长速度预计为31.59%,略高于沪深300整体增长速度,并与煤炭行业增长率接近,而预计净利润增长率为15.93%,不仅低于煤炭行业整体水平,也低于沪深300整体水平,这主要是政府对电价进行限制所致。
(000029 深深房A 200029深深房B)深圳经济特区房地产(集团)股份有限公司ShenZhen Special Economic Zone Real Estate&Properties (Group).co.,Ltd、2010年半年度报告二〇一〇年八月二十三日目录第一节重要提示-------------------------------------------------1 第二节公司基本情况---------------------------------------------2 第三节股本变动和主要股东持股情况-------------------------------4 第四节董事、监事、高级管理人员情况-----------------------------6 第五节管理层讨论与分析-----------------------------------------7 第六节重要事项------------------------------------------------12 第七节财务报告------------------------------------------------16 第八节备查文件------------------------------------------------16 附:财务报告--------------------------------------------17第一节重要提示本公司董事会、监事会及其董事、监事、高级管理人员保证本报告所载资料不存在任何虚假记载、误导性陈述或者重大遗漏,并对其内容的真实性、准确性和完整性负个别及连带责任。
没有董事声明对半年度报告内容的真实性、准确性、完整性无法保证或存在异议。
董事夏桂英因公未能出席本次董事会会议,委托董事长周建国代为出席会议并行使表决权;董事文利因公未能出席本次董事会会议,委托董事姜丽花代为出席会议并行使表决权。
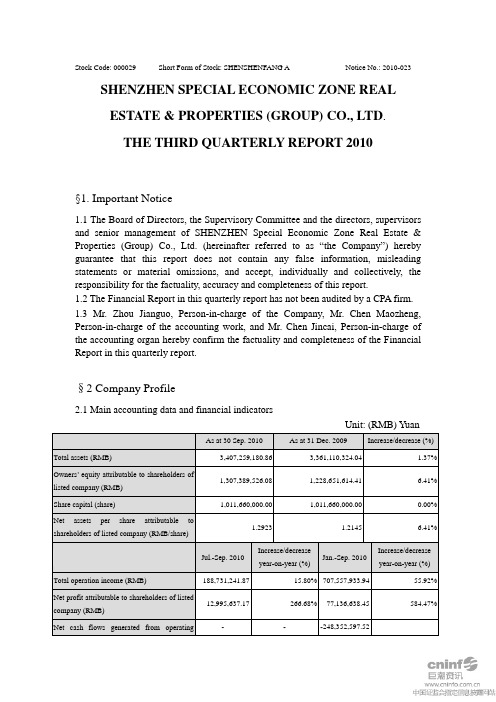
Stock Code: 000029 Short Form of Stock: SHENSHENFANG A Notice No.: 2010-023 SHENZHEN SPECIAL ECONOMIC ZONE REALESTATE & PROPERTIES (GROUP) CO., LTD.THE THIRD QUARTERLY REPORT 2010§1. Important Notice1.1 The Board of Directors, the Supervisory Committee and the directors, supervisorsand senior management of SHENZHEN Special Economic Zone Real Estate & Properties (Group) Co., Ltd. (hereinafter referred to as “the Company”) hereby guarantee that this report does not contain any false information, misleading statements or material omissions, and accept, individually and collectively, the responsibility for the factuality, accuracy and completeness of this report.1.2 The Financial Report in this quarterly report has not been audited by a CPA firm.1.3 Mr. Zhou Jianguo, Person-in-charge of the Company, Mr. Chen Maozheng,Person-in-charge of the accounting work, and Mr. Chen Jincai, Person-in-charge of the accounting organ hereby confirm the factuality and completeness of the Financial Report in this quarterly report.§2 Company Profile2.1 Main accounting data and financial indicatorsUnit: (RMB) YuanAs at 30 Sep. 2010 As at 31 Dec. 2009 Increase/decrease (%) Total assets (RMB) 3,407,259,180.863,361,110,324.04 1.37% Owners’ equity attributable to shareholders oflisted company (RMB)1,307,389,526.081,228,651,614.41 6.41% Share capital (share) 1,011,660,000.001,011,660,000.00 0.00% Net assets per share attributable toshareholders of listed company (RMB/share)1.2923 1.2145 6.41%Jul.-Sep. 2010Increase/decreaseyear-on-year (%)Jan.-Sep. 2010Increase/decreaseyear-on-year (%)Total operation income (RMB) 188,731,241.8715.80%707,557,933.94 55.92% Net profit attributable to shareholders of listedcompany (RMB)12,995,637.17266.68%77,136,638.45 584.47% Net cash flows generated from operating - --248,352,597.52activities (RMB)Net cash flows per share generated fromoperating activities (RMB/share)- - -0.25 Basic earnings per share (RMB/share) 0.0128265.71%0.0762 586.49% Diluted earnings per share (RMB/share) 0.0128265.71%0.0762586.49% Weighted average return on net assets (%) 1.00%0.71% 6.09% 5.16% Weighted average return on net assets afterdeducting extraordinary gains and losses (%)1.00%0.72% 5.33% 4.89%Items of non-recurring gains and losses Amount from year-begin to theend of this report periodNotesGains and losses from disposal of non-current assets 9,595,497.65Gains and losses from changes in fair value of the held tradablefinancial assets and liabilities, and investment income from disposal oftradable financial assets and liabilities and available-for-sale financialassets, excluding the effective hedging businesses related with thenormal operation of the Company188,148.35Other non-business income and expenses besides the above items 31,144.09Effect on income tax -7,786.00Total 9,807,004.09-2.2 Total number of shareholders at period-end and shareholding of top tenshareholders holding tradable sharesUnit: shareTotal number of shareholders at the period-end98,610Shareholding of top ten shareholders holding tradable sharesFull name of shareholderNumber of tradableshares held at period-endType of shareShenzhen Investment Holdings Co., Ltd. 642,884,262RMB Ordinary SharesCPI Financial Co., Ltd. 3,336,701RMB Ordinary Shares Banque Indosuez 1,310,800RMB Ordinary Shares Wang Zhongming 1,095,408Domestically listed foreign shares Guan Jinfeng 1,062,220RMB Ordinary SharesXu Taiying 780,000RMB Ordinary SharesXue Haoyuan 746,356RMB Ordinary Shares Zhang Rui 730,700RMB Ordinary Shares CHU KOON YUK 720,000Domestically listed foreign sharesICBC-GF China Securities 500 Index Securities678,580RMB Ordinary Shares Investment Fund (LOF)§ 3 Significant Events3.1 Particulars about major changes of main accounting statement items and financial indicators, as well as reasons for the changes√Applicable □InapplicableAs at 30 Sep. 2010, total assets of the Company was RMB 3,407,260,000, with an increase of 1.37% compared with RMB 3,361,110,000 at the year-begin, and liabilities totaled RMB 2,112,890,000, with a decrease of 1.52% compared with RMB 2,145,480,000 at the year-begin. Equity (net assets) attributable to shareholders of parent company was RMB 1,307,390,000, with an increase of 6.41% compared with RMB 1,228,650,000. Particulars about large changes in items and reason were as follows:Index of balance sheet: transactional financial assets was RMB 173,500, up by 101.08% compared with RMB 86,300 at the end of last year, mainly because the Company won the lot for new share in transaction; accounts receivable was RMB 27,366,200, up by 85.76% compared with RMB 14,732,400 at the end of last year, mainly because payment payable for constructional engineering and fund from sales of real estate increased; Payment in advance of RMB increased 32.72% compared with RMB 18,020,300 at the end of last year, mainly because payment for engineering in advance increased; short-term borrowing was RMB 14,800,000, down by 85.20% compared with RMB 100,000,000 at the end of last year, which was mainly due to return mature short-term borrowings from bank; Non-current liabilities due within one year was RMB 127,602,900, down by -44.43% compared with 229,607,200 at the end of last year, which was mainly due to return mature long-term borrowings from bank; long-term borrowing was RMB 1,070,218,200, up by 83.89% compared with RMB 581,986,500 at the end of last year, mainly because of new long-term borrowings from bank; accounts payable was RMB 146,875,700, down by -79.91% compared with RMB 730,944,400 at the end of last year, which was mainly because the Company paid the second installment fund for use right of two land in Guangming New District; Payment received in advance was RMB 406,039,600, with an increase of 158.43% compared with RMB 157,116,100 at the end of last year, mainly because the Company received fund for sales of 10th Phase of Jinye Island Project and fund for constructional engineering from Shenzhen Zhentong Engineering Co., Ltd; interest payable was RMB 41,059,800, with an increase of 66.32% compared with RMB 2468.77 at the end of last year, mainly because the Company withdrew interest for borrowings in advance.Index of incomes statement and cash flow statement: operating income was RMB 707557900, with an increase of 55.92% compared with RMB 453788400 at the same period of last year, mainly because income from sales of real estate and engineering increased; operating cost was RMB 469,522,200, with an increase of 36.87%compared with RMB 343,034,500 at the same period of last year, which was mainly due to increase with operating income; business taxes and surcharges were RMB 67,886,700, with an increase of 84.63% compared with RMB 36,768,700 at the same period of last year, which was due to increase with operating income; sales expense was RMB 8,453,800, with an increase of 68.36% compared with RMB 5,021,300 at the same period of last year, mainly because advertising and sales service expense increased; financial expense was RMB 453,59,300, with an increase of 181.29% compared with RMB 16,125,400 at the same period of last year, mainly because increase of borrowings caused interest expense increased; investment income was RMB 22,538,300, with an increase of 189.04% compared with RMB 7,797,700 at the same period of last year, which was mainly because income from share transferring and investment income from affiliated and jointed enterprises increased; net profit attributable to owners of parent company totaled RMB 77,136,700, with an increase of 584.47% compared with RMB 11,269,500 at the same period of last year, mainly because operating income increased, gross profit ratio rose and investment income increased; net cash flow from operating activities was RMB -248,352,600, with an increase of 56.10% compared with RMB -565,752,900 at the same period of last year, mainly because cash received from sales of goods and offering labor service increased; net cash flow from investing activities was RMB 10,515,300, with an increase of 39.20% compared with RMB 7,554,200 at the same period of last year, mainly because cash received from investment income increased; net cash flow from financing activities was RMB 261,373,600, with a decrease of 56.67% compared with RMB 603,193,900 at the same period of last year, mainly because cash paid for debt increased;3.2 Progress and influence of significant events, as well as the analysis on solutions 3.2.1 Non-standard audit opinion□Applicable √Inapplicable3.2.2 Whether the Company provided funds to the controlling shareholder or its related parties or provided guarantees to external parties in violation of the prescribed procedures□Applicable √Inapplicable3.2.3 Signing and execution of significant contracts concerning routine operations□Applicable √Inapplicable3.2.4 Others□Applicable √Inapplicable3.3 Fulfillment of commitments made by the Company, shareholders and the actual controller√Applicable □InapplicableCommitment CommitmentmakerContents of commitment ImplementationCommitment made in the share reform Shenzhen Shenzhen Investment Holding Co., Ltd. made The commitmentsInvestment Holdings Co. Ltd the following commitments concerning therelevant matters of the share merger reform ofSPG: “ ①The Company shall abide by therelevant laws, regulations and rules, and fulfillthe legal commitments; ②The Companyhereby declares that: The promisor shallfaithfully fulfill its commitments and shoulder corresponding responsibilities; Unless thetransferee agrees to and is able to fulfill the commitments, the promisor shall not transferthe held shares. ③The Company herebydeclares that: Should the promisor fail tofulfill its commitments prescribed in therelevant documents, it shall compensate theother shareholders for their losses caused thereupon.”have been fulfilledCommitment in the acquisition report orthe report on equity changesNaught Naught NaughtCommitment made in the significant asset reorganizationShenzhenInvestmentHoldings Co. LtdThe Shenzhen Sate-owned Assets Supervisionand Administration Commission issued theLetter on Relevant Matters ConcerningInformation Disclosure of SPG to ShenzhenInvestment Holdings Co., Ltd. in Oct. 2009,making a commitment that it would notconduct transfer of SPG share rights throughagreements, asset reorganization or othermatters (not including shareholding reductionin the secondary market) that have significantinfluence on SPG in the year and the nextyear.The commitmentis currently in theprocess ofexecution.Commitment made in the issuance Naught Naught Naught Other commitments (includingsupplementary ones)Naught Naught Naught3.4 Warnings of possible losses or major changes of the accumulative net profitachieved during the period from year-begin to the end of the next report period compared with the same period of last year, as well as explanation on reasons√Applicable □InapplicablePerformance forecast Significant increase in the same directionFrom the year-begin to the endof the next report periodSame period of last year Increase/decrease (%)Estimated accumulative net profit (RMB Ten thousand) 8,200.00 -- 8,700.002,021.74Increase 305.59%-- 330.32%Basic earnings per share (RMB/share) 0.0811 -- 0.08600.0200Increase 305.50%-- 330.00%Notes to performance forecast Mainly due to the increase of the real estate and construction project incomes3.5 Other significant events that need to be explained3.5.1 Investments into securities√Applicable □InapplicableUnit: RMB YuanSerial No. Securities variety Stock codeShort form ofstockInitialinvestmentamount(Yuan)Shares heldat period-end(share)Book value atperiod-endProportion intotalsecuritiesinvestment atperiod-end(%)Gains or lossesin report period1 Stock 002137Sea StarTechnology5,150.0097510,773.75 6.21% 5,623.752 Stock 601857 China NationalPetroleum50,100.003,00030,540.00 17.60% -19,560.003 Stock 601866ChinaShippingContainerLines13,240.002,0007,360.00 4.24% -5,880.004 Stock 601898 China CoalEnergy16,830.001,0009,920.00 5.72% -6,910.005 Stock 002440ZhejiangRuntu Co., Ltd31,200.001,00028,520.00 16.44% -2,680.006 Stock 601000 TangshanPort16,400.002,00015,060.00 8.68% -1,340.00 7 Stock 601018 NingboPort 22,200.006,00021,300.00 12.28% -900.008 Stock 780377 Subscription ofIndustrialSecurities50,000.005,00050,000.00 28.82% 0.00Other securities investments held at period-end 0.00- 0.000.00%0.00 Gains/ losses from securities investment sold in reportperiod- - - - 98,033.09 Total 205,120.00- 173,473.75 100%66,386.84 Explanation on securities investment:Stocks held by the Company were lottery of new shares, which has been sold incurrent day when benefit.3.5.2 Researches, interviews and visits received in report periodTime Place Way of Visitor Main discussion and materials provided by the Companyreception15 Jul. 2010 CompanyOfficeFieldresearchDonghai Securities andGuodu SecuritiesA general visit, with no written materials being provided by theCompany28 Jul. 2010 CompanyOfficeBy phone Individual investorInquiring reasons for the Company’s stock price fluctuations,with no written materials being provided by the Company13 Aug. 2010 CompanyOfficeBy phone Individual investorInquiring the time for disclosure of the Company’s semi-annualreport, with no written materials being provided by theCompany30 Aug. 2010 CompanyOfficeBy phone Individual investorInquiring about the Company’s semi-annual report, with nowritten materials being provided by the Company8 Sept. 2010 CompanyOfficeBy phone Individual investorInquiring about the Company’s project development and thesales situation, with no written materials being provided by theCompany19 Sept. 2010 CompanyOfficeBy phone Individual investorInquiring about the Company’s project development plans, withno written materials being provided by the Company29 Sept. 2010 CompanyOfficeBy phone Individual investorInquiring the Company’s operations and its opinion on thegovernment’s macro-control measures, with no writtenmaterials being provided by the Company3.6 Investments into derivatives□Applicable √Inapplicable3.6.1 Positions of derivatives investments held at period-end □Applicable √Inapplicable。

深圳目录序言 (3)一、城市经济 (4)1、城市宏观经济 (4)(1)GDP (4)(2)工业增加值 (4)(3)外贸进出口总额 (4)(4)固定资产投资 (4)(5)社会消费品零售总额 (4)2、城市房地产与经济发展的关系: (5)(1)房地产业与GDP (5)(2)房地产投资与固定资产投资 (5)(3)房地产业与消费 (5)(4)房地产业与财政收入 (5)二、产业政策 (5)1、产业政策综述 (5)2、产业政策解读 (5)3、产业政策展望 (6)三、土地供求 (6)1、经营性土地供应量 (6)2、经营性土地成交量 (6)3、经营性土地成交价格 (6)4、土地成交结构分析 (7)(1)成交区域分析 (7)(2)成交土地属性分析 (7)5、重点地块分析 (7)(1)G02109-0004地块 (7)(2)G14207-0186块地 (7)(3)G02113-0021地块 (7)四、行业发展 (7)1、开发投资额 (7)2、房地产新开工面积 (7)3、房地产竣工面积 (7)4、房地产施工面积 (7)五、市场交易 (8)1、商品房市场 (8)(1)市场综述 (8)(2)供求关系分析 (8)(3)供应量分析 (8)(4)成交量分析 (8)(5)成交均价分析 (8)2、住宅市场 (9)(1)市场概述 (9)(2)供求分析 (9)(3)供应分析 (9)(4)成交分析 (9)(5)价格分析 (10)(6)项目分析 (10)(7)新盘分析 (10)(8)市场存量分析 (12)3、办公市场 (13)(1)市场综述 (13)(2)供求关系分析 (13)(3)市场供应量分析 (14)(4)市场成交量分析 (14)(5)成交价格分析 (15)(6)个案分析-鸿隆世纪广场 (15)4、商业市场 (16)(1)市场概述 (16)(2)供求关系分析 ................................... 错误!未定义书签。

深圳发展银行股份有限公司2010年年度报告目录第一节重要提示 (1)第二节公司基本情况简介 (2)第三节财务数据和业务数据摘要 (3)第四节管理层讨论与分析 (6)第五节股本变动及股东情况 (36)第六节董事、监事、高级管理人员和员工情况 (41)第七节公司治理结构 (55)第八节股东大会情况简介 (59)第九节董事会报告 (60)第十节监事会报告 (68)第十一节重要事项 (71)第十二节财务报告 (78)第十三节董事、高级管理人员关于2010年年度报告的书面确认意见 (160)第十四节备查文件 (240)第一节重要提示本行董事会、监事会及董事、监事、高级管理人员保证本报告所载资料不存在任何虚假记载、误导性陈述或者重大遗漏,并对其内容的真实性、准确性和完整性承担个别及连带责任。
本行第八届董事会第二次会议审议了2010年年度报告正文及摘要。
参加本次董事会会议的董事共15人。
本次董事会会议一致同意此报告。
安永华明会计师事务所和安永会计师事务所分别根据国内和国际审计准则对本行2010年度财务会计报告进行了审计,并出具了标准无保留意见的审计报告。
本行董事长肖遂宁、行长理查德·杰克逊(Richard Jackson)、副行长兼首席财务官陈伟、会计机构负责人李伟权保证2010年年度报告中财务报告的真实、完整。
第二节公司基本情况简介(一)法定中文名称:深圳发展银行股份有限公司(简称:深圳发展银行,下称“本行”)法定英文名称:Shenzhen Development Bank Co., Ltd.(二)法定代表人:肖遂宁(三)董事会秘书:徐进证券事务代表:吕旭光联系地址:中国广东省深圳市深南东路5047号深圳发展银行大厦深圳发展银行董事会秘书处联系电话:(0755)82080387传真:(0755)82080386电子邮箱:dsh@(四)注册地址:中国广东省深圳市办公地址:深圳市深南东路5047号深圳发展银行大厦邮政编码:518001国际互联网网址:电子邮箱:dsh@(五)本行选定信息披露报刊:《中国证券报》、《证券时报》、《上海证券报》登载年度报告的中国证监会指定互联网网址:本行年度报告备置地点:本行董事会秘书处(六)本行股票上市交易所:深圳证券交易所股票简称:深发展A股票代码:000001(七)本行其他有关资料首次注册登记日期:1987年12月22日最近一次变更注册登记日期:2010年8月4日注册地点:深圳市罗湖区深南东路5047号企业法人营业执照注册号:440301103098545税务登记号码:国税440300192185379;地税440300192185379本行聘请的境内会计师事务所:安永华明会计师事务所办公地点:北京市东城区东长安街1号东方广场安永大楼(东三办公楼)16层本行聘请的境外会计师事务所:安永会计师事务所办公地点:香港中环金融街8号国际金融中心2期18楼(八)本报告分别以中、英文两种文字编制,在对两种文本的理解上发生歧义时,以中文文本为准。

国兴融达地产股份有限公司2010年第三季度季度报告全文§1 重要提示1.1 本公司董事会、监事会及董事、监事、高级管理人员保证本报告所载资料不存在任何虚假记载、误导性陈述或者重大遗漏,并对其内容的真实性、准确性和完整性负个别及连带责任。
1.2 公司第三季度财务报告未经会计师事务所审计。
1.3 公司负责人孙庆国、主管会计工作负责人王燕及会计机构负责人(会计主管人员)刘景同声明:保证季度报告中财务报告的真实、完整。
§2 公司基本情况2.1 主要会计数据及财务指标单位:元2010.9.302009.12.31增减幅度(%)总资产(元)669,373,531.43626,637,300.11 6.82%归属于上市公司股东的所有者权益(元)344,468,827.23353,056,806.12 -2.43%股本(股)180,999,720.00180,999,720.00 0.00%归属于上市公司股东的每股净资产(元/股) 1.901.95 -2.56%2010年7-9月比上年同期增减(%)2010年1-9月比上年同期增减(%)营业总收入(元)6,240.0060.00%6,900.00 76.92%归属于上市公司股东的净利润(元) -1,826,974.90-34.09%-8,587,978.89 -27.97%经营活动产生的现金流量净额(元) - - 44,514,421.93 458.67%每股经营活动产生的现金流量净额(元/股)- -0.2459 458.86%基本每股收益(元/股) -0.0101-34.67%-0.0474 -23.76%稀释每股收益(元/股) -0.0101-34.67%-0.0474 -23.76%加权平均净资产收益率(%) -0.53%-35.90%-2.46% -28.13%扣除非经常性损益后的加权平均净资产收益率(%) -0.53%-35.90%-2.46% -28.13%非经常性损益项目年初至报告期末金额附注非流动资产处置损益0.00合计0.00 -2.2 报告期末股东总人数及前十名无限售条件股东持股情况表单位:股报告期末股东总数(户)14,615前十名无限售条件流通股股东持股情况股东名称(全称)期末持有无限售条件流通股的数量种类江苏凯茂贸易有限公司3,098,744人民币普通股上海熔烁投资管理有限公司2,831,108人民币普通股四川平原实业发展有限公司2,312,236人民币普通股昆仑信托有限责任公司-甬江十七号2,300,000人民币普通股山东省国际信托有限公司-宝华2号证券投资1,900,000人民币普通股信托江苏翔威贸易有限公司1,394,837人民币普通股成都博瑞传播股份有限公司1,156,116人民币普通股李永生636,000人民币普通股刘宗豪612,875人民币普通股山东省国际信托有限公司-宝华1号证券投资580,000人民币普通股信托§3 重要事项3.1 公司主要会计报表项目、财务指标大幅度变动的情况及原因√适用□不适用1、净利润和每股收益比去年同期下降20%-30%,系公司在2010年前三季度没有新的项目开工销售,未能产生收益;2、营业总成本比去年同期增加28%,系管理费用痛痹增加所致;3、经营活动产生的现金流量净额比去年同期增加458.67%,系“国兴建业”土增税清算预缴了1,400万元税款及“重庆置业”受到往来款项。
南海发展股份有限公司6003232010年第三季度报告目录§1 重要提示 (2)§2 公司基本情况 (2)§3 重要事项 (3)§4 附录 (7)§1 重要提示1.1 本公司董事会、监事会及其董事、监事、高级管理人员保证本报告所载资料不存在任何虚假记载、误导性陈述或者重大遗漏,并对其内容的真实性、准确性和完整性承担个别及连带责任。
1.2 李松董事委托林祖希董事出席会议并行使表决权。
其他董事亲自出席会议并行使表决权。
1.3 公司第三季度财务报告未经审计。
1.4公司负责人姓名 何向明主管会计工作负责人姓名 陈慧霞会计机构负责人(会计主管人员)姓名 何彦英公司负责人何向明、主管会计工作负责人陈慧霞及会计机构负责人(会计主管人员)何彦英声明:保证本季度报告中财务报告的真实、完整。
§2 公司基本情况2.1 主要会计数据及财务指标币种:人民币本报告期末 上年度期末 本报告期末比上年度期末增减(%)总资产(元) 2,926,726,642.932,130,310,836.74 37.38所有者权益(或股东权益)(元) 1,483,164,587.731,007,983,639.10 47.14归属于上市公司股东的每股净资产(元/股) 5.47 3.72 47.14年初至报告期期末(1-9月)比上年同期增减(%)经营活动产生的现金流量净额(元) 159,552,451.76 -7.16每股经营活动产生的现金流量净额(元/股)0.59 -7.16报告期 (7-9月) 年初至报告期期末(1-9月)本报告期比上年同期增减(%)归属于上市公司股东的净利润(元) 466,712,738.90515,841,211.48 1,405.73基本每股收益(元/股) 1.722 1.903 1,405.73扣除非经常性损益后的基本每股收益(元/股)0.1050.286 -18.01稀释每股收益(元/股) 1.722 1.903 1,405.73加权平均净资产收益率(%) 37.3441.19 增加33.76个百分点扣除非经常性损益后的加权平均净资产收益率(%)2.28 6.19 减少1.31个百分点扣除非经常性损益项目和金额:单位:元 币种:人民币项目 年初至报告期期末金额 (1-9月)非流动资产处置损益 97,566.50狮山羊房岗土地转让收益 585,579,025.85除上述各项之外的其他营业外收入和支出 -1,237,989.64所得税影响额 -146,109,650.68合计 438,328,952.032.2 报告期末股东总人数及前十名无限售条件股东持股情况表单位:股 报告期末股东总数(户) 23,980前十名无限售条件流通股股东持股情况股东名称(全称) 期末持有无限售条件流通股的数量种类福建省华兴集团有限责任公司 13,466,344 人民币普通股 中国光大银行股份有限公司-摩根士丹利华鑫资源优选混合型证券投资基金6,242,686 人民币普通股 中国建设银行股份有限公司-摩根士丹利华鑫卓越成长股票型证券投资基金3,301,894 人民币普通股 海通-中行-FORTIS BANK SA/NV 3,262,991 人民币普通股 郭焕珍 1,591,193 人民币普通股 中国工商银行股份有限公司-招商中小盘精选股票型证券投资基金1,587,794 人民币普通股 中国建设银行股份有限公司-摩根士丹利华鑫领先优势股票型证券投资基金1,182,000 人民币普通股 交通银行-万家公用事业行业股票型证券投资基金 1,100,000 人民币普通股 博时基金公司-中信-中信证券股份有限公司 899,885 人民币普通股 中国建设银行-华夏红利混合型开放式证券投资基金 881,874 人民币普通股 §3 重要事项3.1 公司主要会计报表项目、财务指标大幅度变动的情况及原因√适用 □不适用1、报告期,资产负债表项目大幅变动原因分析(1) 货币资金比期初增加31264.80万元,增长了254.67%,主要原因是收到了狮山羊房岗土地转让金。
第36期2010年三季度业绩预增上市公司(4)证券代码证券简称业绩预告摘要09三季度每股收益(元)000060中金岭南净利润35,000万元~45,000万元,增长65.91%~113.31%0.74000078海王生物净利润3,900万元,增长51.37%0.03000537广宇发展净利润8950万元~10050万元,增长302.35%~351.8%0.07000982中银绒业净利润4,500万元~5,100万元,增长102.07%~129.01%0.11002008大族激光增长300%~330%0.24002024苏宁电器增长30%~50%0.57002027七喜控股增长30.00%~50.00%0.03002041登海种业增长150%~180%0.06002060粤水电增减变动0.00%~30.00%0.20002066瑞泰科技增长10.00%~30.00%0.31002140东华科技增长0.00%~30.00%0.60002142宁波银行增长50.00%~70.00%0.45002172澳洋科技增长50%~100%-0.36证券代码证券简称业绩预告摘要09三季度每股收益(元)600081东风科技增长1600%~1900%-0.04600584长电科技增长145~156倍0.12600626申达股份增长100%以上0.08600748上实发展增加50%以上0.09600963岳阳纸业增长50%以上0.29002192路翔股份增减变动0.00%~30.00%-0.05002244滨江集团增长20.00%~50.00%0.58002263大东南增长0.00%~50.00%0.17002297博云新材增长10.00%~30.00%———002332仙琚制药增长20.00%~50.00%———002341新纶科技增长30.00%~50.00%———002385大北农增减变动0.00%~30.00%———002430杭氧股份增长30.00%~50.00%———600019宝钢股份增幅为140%~160%0.7176精选资料DATA:赵迪E-mail:*****************ghts Reserved.。
罗顿发展股份有限公司6002092010年第三季度报告目录§1 重要提示 (2)§2 公司基本情况 (2)§3 重要事项 (3)§4 附录 (3)§1 重要提示1.1 本公司董事会、监事会及其董事、监事、高级管理人员保证本报告所载资料不存在任何虚假记载、误导性陈述或者重大遗漏,并对其内容的真实性、准确性和完整性承担个别及连带责任。
1.2 公司全体董事出席董事会会议。
1.3 公司第三季度财务报告未经审计。
1.4公司负责人姓名 李维先生主管会计工作负责人姓名 余前先生会计机构负责人(会计主管人员)姓名 徐庆明先生公司负责人李维先生、主管会计工作负责人余前先生及会计机构负责人(会计主管人员)徐庆明先生声明:保证本季度报告中财务报告的真实、完整。
§2 公司基本情况2.1 主要会计数据及财务指标币种:人民币本报告期末 上年度期末 本报告期末比上年度期末增减(%)总资产(元) 1,425,280,872.001,392,898,305.41 2.32所有者权益(或股东权益)(元) 616,196,398.89649,898,070.53 -5.19归属于上市公司股东的每股净资产(元/股)1.40 1.48 -5.41年初至报告期期末 (1-9月) 比上年同期增减(%)经营活动产生的现金流量净额(元) 47,328,063.28 39.68每股经营活动产生的现金流量净额(元/股)0.11 37.50报告期 (7-9月) 年初至报告期期末(1-9月)本报告期比上年同期增减(%)归属于上市公司股东的净利润(元) -11,455,538.34-33,701,671.64 -44.32基本每股收益(元/股) -0.03 -0.08 -50.00扣除非经常性损益后的基本每股收益(元/股)-0.03 -0.08 -50.00稀释每股收益(元/股) -0.03 -0.08 -50.00加权平均净资产收益率(%) -1.84-5.32 减少0.65个百分点扣除非经常性损益后的加权平均净资产收益率(%) -1.84-5.33减少0.65个百分点扣除非经常性损益项目和金额:单位:元 币种:人民币项目 年初至报告期期末金额 (1-9月)计入当期损益的政府补助(与企业业务密切相关,按照国家统一标准定额或定量享受的政府补助除外)68,983.00除上述各项之外的其他营业外收入和支出 -22,570.94少数股东权益影响额(税后) -4,074.55合计 42,337.512.2 报告期末股东总人数及前十名无限售条件股东持股情况表单位:股 报告期末股东总数(户) 57,240前十名无限售条件流通股股东持股情况股东名称(全称) 期末持有无限售条件流通股的数量 种类定南国际饭店 2,798,100人民币普通股邢汉尧 1,128,800人民币普通股黄木秀 1,005,600人民币普通股何虹 894,600人民币普通股许湘玲 700,000人民币普通股杨晓捷 684,700人民币普通股北京盈之源投资咨询有682,920人民币普通股限公司徐任 677,000人民币普通股左妍雅 600,000人民币普通股张华坤 600,000人民币普通股§3 重要事项3.1 公司主要会计报表项目、财务指标大幅度变动的情况及原因√适用 □不适用预付账款较期初增加55.80%,主要原因为上海工程公司预付工程项目材料款增加;应付账款较期初减少37.63%,主要原因为上海工程公司支付工程项目材料款增加;预收账款较期初增加34.78%,主要原因为上海工程公司收到工程进度款增加;其他应付款较期初增加50.70%,主要原因为收到沙河往来款项增加;净利润较上年同期增亏35.80%,主要原因为工程公司施工成本增加所致。
证券代码:000029 证券简称:深深房A公告编号:2011-005 深圳经济特区房地产(集团)股份有限公司2010年年度报告摘要§1 重要提示1.1 本公司董事会、监事会及其董事、监事、高级管理人员保证本报告所载资料不存在任何虚假记载、误导性陈述或者重大遗漏,并对其内容的真实性、准确性和完整性负个别及连带责任。
本年度报告摘要摘自年度报告全文,报告全文同时刊载于巨潮资讯网()。
投资者欲了解详细内容,应当仔细阅读年度报告全文。
1.2 公司年度财务报告已经中审国际会计师事务所审计并被出具了标准无保留意见的审计报告。
1.3 公司负责人周建国、主管会计工作负责人陈茂政及会计机构负责人(会计主管人员)陈金才声明:保证年度报告中财务报告的真实、完整。
§2 公司基本情况简介2.1 基本情况简介2.2 联系人和联系方式§3 会计数据和业务数据摘要3.1 主要会计数据单位:元3.2 主要财务指标单位:元非经常性损益项目√适用□不适用单位:元3.3 境内外会计准则差异□适用√不适用§4 股本变动及股东情况4.1 股份变动情况表单位:股限售股份变动情况表单位:股4.2 前10名股东、前10名无限售条件股东持股情况表单位:股4.3 控股股东及实际控制人情况介绍4.3.1 控股股东及实际控制人变更情况□适用√不适用4.3.2 控股股东及实际控制人具体情况介绍4.3.3 公司与实际控制人之间的产权及控制关系的方框图§5 董事、监事和高级管理人员5.1 董事、监事和高级管理人员持股变动及报酬情况董事、监事、高级管理人员报告期内被授予的股权激励情况□适用√不适用5.2 董事出席董事会会议情况连续两次未亲自出席董事会会议的说明§6 董事会报告6.1 管理层讨论与分析6.2 主营业务分行业、产品情况表单位:万元6.3 主营业务分地区情况单位:万元6.4 采用公允价值计量的项目√适用□不适用单位:元6.5 募集资金使用情况对照表□适用√不适用变更募集资金投资项目情况表□适用√不适用6.6 非募集资金项目情况√适用□不适用单位:万元6.7 董事会对公司会计政策、会计估计变更或重大会计差错更正的原因及影响的说明√适用□不适用6.8 董事会对会计师事务所“非标准审计报告”的说明□适用√不适用6.9 董事会本次利润分配或资本公积金转增股本预案公司最近三年现金分红情况表单位:元公司本报告期内盈利但未提出现金利润分配预案□适用√不适用§7 重要事项7.1 收购资产□适用√不适用7.2 出售资产□适用√不适用7.1、7.2所涉及事项对公司业务连续性、管理层稳定性的影响。
证券代码:000029、200029 证券简称:深深房A、 深深房B
(公告编号:2010-019)
深圳经济特区房地产(集团)股份有限公司
2010年3季度业绩预告修正公告
本公司及董事会全体成员保证公告内容的真实、准确、完整,没有虚假记载、误导性陈述或重大遗漏。
一、修正后本期业绩预计情况
1.业绩预告修正情况表
本报告期
2010年月1月1日—
2010年9月30日
项 目
修正前 修正后
上年同期
(2009年1月1日—
2009年 9月30日)
修正后的增减
变动幅度(%)
净利润 约6,600万元
—6,800万元
约7,700万元
—8,000万元
1,126.95 万元
* 增长:583.26%
—609.88%
基本每股收益 约0.0652元
—0.0672元
约0.0761元
—0.0791元
0.0111元
* 增长:585.58%
—612.61%
修正前的业绩预告披露情况
公司曾于以下时间、方式披露了本期业绩预告:
√ 公司2010年中期报告
2、公司2010年7-9月预计实现净利润约1,286-1,586万元,2009年7-9
月实现净利润354.42万元。
二、业绩预告修正预审计情况
本次业绩预测未经公司年审会计师事务所审计。
三、业绩修正原因说明
本公司本期业绩修正的主要原因为:公司报告期内新增乐群楼、乐怡楼裙楼销售结转收入。
四、其他相关说明
具体财务数据将在 2010 年三季度报告中进行详细披露。
公司董事会提醒投资者理性投资,注意投资风险。
深圳经济特区房地产(集团)股份有限公司董事会
2010 年 10 月 15 日。