2012年美国大学生数学建模竞赛题目B题英语达人全配套翻译
- 格式:doc
- 大小:32.50 KB
- 文档页数:2
2012 MCM/ICM Photograph & Video Release FormI hereby grant permission to the rights of my image, likeness and sound of my voice as recorded on audio or video tape. I understand that my image may be edited, copied, exhibited, published or distributed and waive the right to inspect or approve the finished product wherein my likeness appears. Additionally, I waive any right to royalties or other compensation arising or related to the use of my image or recording. I also understand that this material may be used in diverse outreach efforts within an unrestricted geographic area. Photographic, audio or video recordings may be used for the following purposes:•conference presentations•educational presentations or courses•informational presentations•on-line educational courses•educational videos and DVDs•reporting on commercial and not for profit outletsBy signing this release I understand this permission signifies that photographic or video recordings of me may be electronically displayed via the Internet or in the public educational setting.There is no time limit on the validity of this release nor is there any geographic limitation on where these materials may be distributed.This release applies to photographic, audio or video recordings collected as part of the sessions listed on this document only.By signing this form I acknowledge that I have completely read and fully understand the above release and agree to be bound thereby. I hereby release any and all claims against any person or organization utilizing this material for educational purposes.School ___________________________________________ Team Control Number __________________ Student Full Name_______________________________________________________________________ Street Address/P.O. Box___________________________________________________________________ City ___________________________________ State __________________ Zip Code________________ Country_____________________________________Phone_______________________________________Email Address_________________________________________________________________Signature_____________________________________ Date____________________________If this release is obtained from a student/presenter under the age of 19, then the signature of thatstudents/presenter’s parent or legal guardian is also required.Parent’s Signature______________________________ Date____________________________。
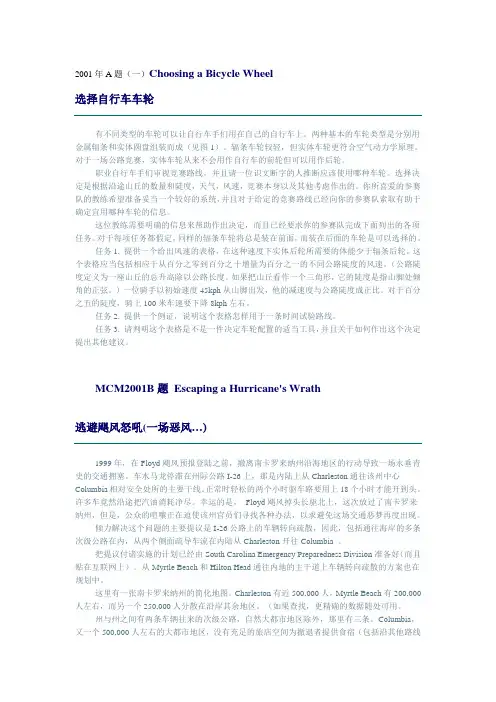
2001年A题(一)Choosing a Bicycle Wheel选择自行车车轮有不同类型的车轮可以让自行车手们用在自己的自行车上。
两种基本的车轮类型是分别用金属辐条和实体圆盘组装而成(见图1)。
辐条车轮较轻,但实体车轮更符合空气动力学原理。
对于一场公路竞赛,实体车轮从来不会用作自行车的前轮但可以用作后轮。
职业自行车手们审视竞赛路线,并且请一位识文断字的人推断应该使用哪种车轮。
选择决定是根据沿途山丘的数量和陡度,天气,风速,竞赛本身以及其他考虑作出的。
你所喜爱的参赛队的教练希望准备妥当一个较好的系统,并且对于给定的竞赛路线已经向你的参赛队索取有助于确定宜用哪种车轮的信息。
这位教练需要明确的信息来帮助作出决定,而且已经要求你的参赛队完成下面列出的各项任务。
对于每项任务都假定,同样的辐条车轮将总是装在前面,而装在后面的车轮是可以选择的。
任务1. 提供一个给出风速的表格,在这种速度下实体后轮所需要的体能少于辐条后轮。
这个表格应当包括相应于从百分之零到百分之十增量为百分之一的不同公路陡度的风速。
(公路陡度定义为一座山丘的总升高除以公路长度。
如果把山丘看作一个三角形,它的陡度是指山脚处倾角的正弦。
)一位骑手以初始速度45kph从山脚出发,他的减速度与公路陡度成正比。
对于百分之五的陡度,骑上100米车速要下降8kph左右。
任务2. 提供一个例证,说明这个表格怎样用于一条时间试验路线。
任务3. 请判明这个表格是不是一件决定车轮配置的适当工具,并且关于如何作出这个决定提出其他建议。
MCM2001B题Escaping a Hurricane's Wrath逃避飓风怒吼(一场恶风…)1999年,在Floyd飓风预报登陆之前,撤离南卡罗来纳州沿海地区的行动导致一场永垂青史的交通拥塞。
车水马龙停滞在州际公路I-26上,那是内陆上从Charleston通往该州中心Columbia相对安全处所的主要干线。
正常时轻松的两个小时驱车路要用上18个小时才能开到头。
We develop a model to schedule trips down the Big Long River. The goalComputing Along the Big Long RiverChip JacksonLucas BourneTravis PetersWesternWashington UniversityBellingham,WAAdvisor: Edoh Y. AmiranAbstractis to optimally plan boat trips of varying duration and propulsion so as tomaximize the number of trips over the six-month season.We model the process by which groups travel from campsite to campsite.Subject to the given constraints, our algorithm outputs the optimal dailyschedule for each group on the river. By studying the algorithm’s long-termbehavior, we can compute a maximum number of trips, which we define asthe river’s carrying capacity.We apply our algorithm to a case study of the Grand Canyon, which hasmany attributes in common with the Big Long River.Finally, we examine the carrying capacity’s sensitivity to changes in thedistribution of propulsion methods, distribution of trip duration, and thenumber of campsites on the river.IntroductionWe address scheduling recreational trips down the Big Long River so asto maximize the number of trips. From First Launch to Final Exit (225 mi),participants take either an oar-powered rubber raft or a motorized boat.Trips last between 6 and 18 nights, with participants camping at designatedcampsites along the river. To ensure an authentic wilderness experience,at most one group at a time may occupy a campsite. This constraint limitsthe number of possible trips during the park’s six-month season.We model the situation and then compare our results to rivers withsimilar attributes, thus verifying that our approach yields desirable results.Our model is easily adaptable to find optimal trip schedules for riversof varying length, numbers of campsites, trip durations, and boat speeds.No two groups can occupy the same campsite at the same time.Campsites are distributed uniformly along the river.Trips are scheduled during a six-month period of the year.Group trips range from 6 to 18 nights.Motorized boats travel 8 mph on average.Oar-powered rubber rafts travel 4 mph on average.There are only two types of boats: oar-powered rubber rafts and motorizedTrips begin at First Launch and end at Final Exit, 225 miles downstream.*simulates river-trip scheduling as a function of a distribution of trip*can be applied to real-world rivers with similar attributes (i.e., the Grand*is flexible enough to simulate a wide range of feasible inputs; andWhat is the carrying capacity of the riverÿhe maximum number ofHow many new groups can start a river trip on any given day?How should trips of varying length and propulsion be scheduled toDefining the Problemmaximize the number of trips possible over a six-month season?groups that can be sent down the river during its six-month season?Model OverviewWe design a model thatCanyon);lengths (either 6, 12, or 18 days), a varying distribution of propulsionspeeds, and a varying number of campsites.The model predicts the number of trips over a six-month season. It alsoanswers questions about the carrying capacity of the river, advantageousdistributions of propulsion speeds and trip lengths, how many groups canstart a river trip each day, and how to schedule trips.ConstraintsThe problem specifies the following constraints:boats.AssumptionsWe can prescribe the ratio of oar-powered river rafts to motorized boats that go onto the river each day.There can be problems if too many oar-powered boats are launched with short trip lengths.The duration of a trip is either 12 days or 18 days for oar-powered rafts, and either 6 days or 12 days for motorized boats.This simplification still allows our model to produce meaningful results while letting us compare the effect of varying trip lengths.There can only be one group per campsite per night.This agrees with the desires of the river manager.Each day, a group can only move downstream or remain in its current campsiteÿt cannot move back upstream.This restricts the flow of groups to a single direction, greatly simplifying how we can move groups from campsite to campsite.Groups can travel only between 8 a.m. and 6 p.m., a maximum of 9hours of travel per day (one hour is subtracted for breaks/lunch/etc.).This implies that per day, oar-powered rafts can travel at most 36 miles, and motorized boats at most 72 miles. This assumption allows us to determine which groups can reasonably reach a given campsite.Groups never travel farther than the distance that they can feasibly travelin a single day: 36 miles per day for oar-powered rafts and 72 miles per day for motorized boats.We ignore variables that could influence maximum daily travel distance, such as weather and river conditions.There is no way of accurately including these in the model.Campsites are distributed uniformly so that the distance between campsites is the length of the river divided by the number of campsites.We can thus represent the river as an array of equally-spaced campsites.A group must reach the end of the river on the final day of its trip:A group will not leave the river early even if able to.A group will not have a finish date past the desired trip length.This assumption fits what we believe is an important standard for theriver manager and for the quality of the trips.MethodsWe define some terms and phrases:Open campsite: Acampsite is open if there is no groupcurrently occupying it: Campsite cn is open if no group gi is assigned to cn.Moving to an open campsite: For a group gi, its campsite cn, moving to some other open campsite cm ÿ= cn is equivalent to assigning gi to the new campsite. Since a group can move only downstream, or remain at their current campsite, we must have m ÿ n.Waitlist: The waitlist for a given day is composed of the groups that are not yet on the river but will start their trip on the day when their ranking onthe waitlist and their ability to reach a campsite c includes them in theset Gc of groups that can reach campsite c, and the groups are deemed “the highest priority.” Waitlisted groups are initialized with a current campsite value of c0 (the zeroth campsite), and are assumed to have priority P = 1 until they are moved from the waitlist onto the river.Off the River: We consider the first space off of the river to be the “final campsite” cfinal, and it is always an open campsite (so that any number of groups can be assigned to it. This is consistent with the understanding that any number of groups can move off of the river in a single day.The Farthest Empty CampsiteOurscheduling algorithm uses an array as the data structure to represent the river, with each element of the array being a campsite. The algorithm begins each day by finding the open campsite c that is farthest down the river, then generates a set Gc of all groups that could potentially reach c that night. Thus,Gc = {gi | li +mi . c},where li is the groupÿs current location and mi is the maximum distance that the group can travel in one day.. The requirement that mi + li . c specifies that group gi must be able to reach campsite c in one day.. Gc can consist of groups on the river and groups on the waitlist.. If Gc = ., then we move to the next farthest empty campsite.located upstream, closer to the start of the river. The algorithm always runs from the end of the river up towards the start of the river.. IfGc ÿ= ., then the algorithm attempts tomovethe groupwith the highest priority to campsite c.The scheduling algorithm continues in this fashion until the farthestempty campsite is the zeroth campsite c0. At this point, every group that was able to move on the river that day has been moved to a campsite, and we start the algorithm again to simulate the next day.PriorityOnce a set Gc has been formed for a specific campsite c, the algorithm must decide which group to move to that campsite. The priority Pi is a measure of how far ahead or behind schedule group gi is:. Pi > 1: group gi is behind schedule;. Pi < 1: group gi is ahead of schedule;. Pi = 1: group gi is precisely on schedule.We attempt to move the group with the highest priority into c.Some examples of situations that arise, and how priority is used to resolve them, are outlined in Figures 1 and 2.Priorities and Other ConsiderationsOur algorithm always tries to move the group that is the most behind schedule, to try to ensure that each group is camped on the river for aFigure 1. The scheduling algorithm has found that the farthest open campsite is Campsite 6 and Groups A, B, and C can feasibly reach it. Group B has the highest priority, so we move Group B to Campsite 6.Figure 2. As the scheduling algorithm progresses past Campsite 6, it finds that the next farthest open campsite is Campsite 5. The algorithm has calculated that Groups A and C can feasibly reach it; since PA > PC, Group A is moved to Campsite 5.number of nights equal to its predetermined trip length. However, in someinstances it may not be ideal to move the group with highest priority tothe farthest feasible open campsite. Such is the case if the group with thehighest priority is ahead of schedule (P <1).We provide the following rules for handling group priorities:?If gi is behind schedule, i.e. Pi > 1, then move gi to c, its farthest reachableopen campsite.?If gi is ahead of schedule, i.e. Pi < 1, then calculate diai, the number ofnights that the group has already been on the river times the averagedistance per day that the group should travel to be on schedule. If theresult is greater than or equal (in miles) to the location of campsite c, thenmove gi to c. Doing so amounts to moving gi only in such a way that itis no longer ahead of schedule.?Regardless of Pi, if the chosen c = cfinal, then do not move gi unless ti =di. This feature ensures that giÿ trip will not end before its designatedend date.Theonecasewhere a groupÿ priority is disregardedisshownin Figure 3.Scheduling SimulationWe now demonstrate how our model could be used to schedule rivertrips.In the following example, we assume 50 campsites along the 225-mileriver, and we introduce 4 groups to the river each day. We project the tripFigure 3. The farthest open campsite is the campsite off the river. The algorithm finds that GroupD could move there, but GroupD has tD > dD.that is, GroupD is supposed to be on the river for12 nights but so far has spent only 11.so Group D remains on the river, at some campsite between 171 and 224 inclusive.schedules of the four specific groups that we introduce to the river on day25. We choose a midseason day to demonstrate our modelÿs stability overtime. The characteristics of the four groups are:. g1: motorized, t1 = 6;. g2: oar-powered, t2 = 18;. g3: motorized, t3 = 12;. g4: oar-powered, t4 = 12.Figure 5 shows each groupÿs campsite number and priority value foreach night spent on the river. For instance, the column labeled g2 givescampsite numbers for each of the nights of g2ÿs trip. We find that each giis off the river after spending exactly ti nights camping, and that P ÿ 1as di ÿ ti, showing that as time passes our algorithm attempts to get (andkeep) groups on schedule. Figures 6 and 7 display our results graphically.These findings are consistent with the intention of our method; we see inthis small-scale simulation that our algorithm produces desirable results.Case StudyThe Grand CanyonThe Grand Canyon is an ideal case study for our model, since it sharesmany characteristics with the Big Long River. The Canyonÿs primary riverrafting stretch is 226 miles, it has 235 campsites, and it is open approximatelysix months of the year. It allows tourists to travel by motorized boat or byoar-powered river raft for a maximum of 12 or 18 days, respectively [Jalbertet al. 2006].Using the parameters of the Grand Canyon, we test our model by runninga number of simulations. We alter the number of groups placed on thewater each day, attempting to find the carrying capacity for the river.theFigure 7. Priority values of groups over the course of each trip. Values converge to P = 1 due to the algorithm’s attempt to keep groups on schedule.maximumnumber of possible trips over a six-month season. The main constraintis that each trip must last the group’s planned trip duration. Duringits summer season, the Grand Canyon typically places six new groups onthe water each day [Jalbert et al. 2006], so we use this value for our first simulation.In each simulation, we use an equal number of motorized boatsand oar-powered rafts, along with an equal distribution of trip lengths.Our model predicts the number of groups that make it off the river(completed trips), how many trips arrive past their desired end date (latetrips), and the number of groups that did not make it off the waitlist (totalleft on waitlist). These values change as we vary the number of new groupsplaced on the water each day (groups/day).Table 1 indicates that a maximum of 18 groups can be sent down theriver each day. Over the course of the six-month season, this amounts to nearly 3,000 trips. Increasing groups/day above 18 is likely to cause latetrips (some groups are still on the river when our simulation ends) and long waitlists. In Simulation 1, we send 1,080 groups down river (6 groups/day?80 days) but only 996 groups make it off; the other groups began near the end of the six-month period and did not reach the end of their trip beforethe end of the season. These groups have negligible impact on our results and we ignore them.Sensitivity Analysis of Carrying CapacityManagers of the Big Long River are faced with a similar task to that of the managers of the Grand Canyon. Therefore, by finding an optimal solutionfor the Grand Canyon, we may also have found an optimal solution forthe Big Long River. However, this optimal solution is based on two key assumptions:?Each day, we put approximately the same number of groups onto theriver; and?the river has about one campsite per mile.We can make these assumptions for the Grand Canyon because they are true for the Grand Canyon, but we do not know if they are true for the Big Long River.To deal with these unknowns,wecreate Table 3. Its values are generatedby fixing the number Y of campsites on the river and the ratio R of oarpowered rafts to motorized boats launched each day, and then increasingthe number of trips added to the river each day until the river reaches peak carrying capacity.The peak carrying capacities in Table 3 can be visualized as points ina three-dimensional space, and we can find a best-fit surface that passes (nearly) through the data points. This best-fit surface allows us to estimatethe peak carrying capacity M of the river for interpolated values. Essentially, it givesM as a function of Y and R and shows how sensitiveM is tochanges in Y and/or R. Figure 7 is a contour diagram of this surface.The ridge along the vertical line R = 1 : 1 predicts that for any givenvalue of Y between 100 and 300, the river will have an optimal value ofM when R = 1 : 1. Unfortunately, the formula for this best-fit surface is rather complex, and it doesn’t do an accurate job of extrapolating beyond the data of Table 3; so it is not a particularly useful tool for the peak carrying capacity for other values ofR. The best method to predict the peak carrying capacity is just to use our scheduling algorithm.Sensitivity Analysis of Carrying Capacity re R and DWe have treatedM as a function ofR and Y , but it is still unknown to us how M is affected by the mix of trip durations of groups on the river (D).For example, if we scheduled trips of either 6 or 12 days, how would this affect M? The river managers want to know what mix of trips of varying duration and speed will utilize the river in the best way possible.We use our scheduling algorithm to attempt to answer this question.We fix the number of campsites at 200 and determine the peak carrying capacity for values of R andD. The results of this simulation are displayed in Table 4.Table 4 is intended to address the question of what mix of trip durations and speeds will yield a maximum carrying capacity. For example: If the river managers are currently scheduling trips of length?6, 12, or 18: Capacity could be increased either by increasing R to be closer to 1:1 or by decreasing D to be closer to ? or 12.?12 or 18: Decrease D to be closer to ? or 12.?6 or 12: Increase R to be closer to 4:1.ConclusionThe river managers have asked how many more trips can be added tothe Big Long Riverÿ season. Without knowing the specifics ofhowthe river is currently being managed, we cannot give an exact answer. However, by applying our modelto a study of the GrandCanyon,wefound results which could be extrapolated to the context of the Big Long River. Specifically, the managers of the Big Long River could add approximately (3,000 - X) groups to the rafting season, where X is the current number of trips and 3,000 is the capacity predicted by our scheduling algorithm. Additionally, we modeled how certain variables are related to each other; M, D, R, and Y . River managers could refer to our figures and tables to see how they could change their current values of D, R, and Y to achieve a greater carrying capacity for the Big Long River.We also addressed scheduling campsite placement for groups moving down the Big Long River through an algorithm which uses priority values to move groups downstream in an orderly manner.Limitations and Error AnalysisCarrying Capacity OverestimationOur model has several limitations. It assumes that the capacity of theriver is constrained only by the number of campsites, the trip durations,and the transportation methods. We maximize the river’s carrying capacity, even if this means that nearly every campsite is occupied each night.This may not be ideal, potentially leading to congestion or environmental degradation of the river. Because of this, our model may overestimate the maximum number of trips possible over long periods of time. Environmental ConcernsOur case study of the Grand Canyon is evidence that our model omits variables. We are confident that the Grand Canyon could provide enough campsites for 3,000 trips over a six-month period, as predicted by our algorithm. However, since the actual figure is around 1,000 trips [Jalbert et al.2006], the error is likely due to factors outside of campsite capacity, perhaps environmental concerns.Neglect of River SpeedAnother variable that our model ignores is the speed of the river. Riverspeed increases with the depth and slope of the river channel, makingour assumption of constant maximum daily travel distance impossible [Wikipedia 2012]. When a river experiences high flow, river speeds can double, and entire campsites can end up under water [National Park Service 2008]. Again, the results of our model don’t reflect these issues. ReferencesC.U. Boulder Dept. of Applied Mathematics. n.d. Fitting a surface to scatteredx-y-z data points. /computing/Mathematica/Fit/ .Jalbert, Linda, Lenore Grover-Bullington, and Lori Crystal, et al. 2006. Colorado River management plan. 2006./grca/parkmgmt/upload/CRMPIF_s.pdf .National Park Service. 2008. Grand Canyon National Park. High flowriver permit information. /grca/naturescience/high_flow2008-permit.htm .Sullivan, Steve. 2011. Grand Canyon River Statistics Calendar Year 2010./grca/planyourvisit/upload/Calendar_Year_2010_River_Statistics.pdf .Wikipedia. 2012. River. /wiki/River .Memo to Managers of the Big Long RiverIn response to your questions regarding trip scheduling and river capacity,we are writing to inform you of our findings.Our primary accomplishment is the development of a scheduling algorithm.If implemented at Big Long River, it could advise park rangerson how to optimally schedule trips of varying length and propulsion. Theoptimal schedule will maximize the number of trips possible over the sixmonth season.Our algorithm is flexible, taking a variety of different inputs. Theseinclude the number and availability of campsites, and parameters associatedwith each tour group. Given the necessary inputs, we can output adaily schedule. In essence, our algorithm does this by using the state of theriver from the previous day. Schedules consist of campsite assignments foreach group on the river, as well those waiting to begin their trip. Given knowledge of future waitlists, our algorithm can output schedules monthsin advance, allowing managementto schedule the precise campsite locationof any group on any future date.Sparing you the mathematical details, allow us to say simply that ouralgorithm uses a priority system. It prioritizes groups who are behindschedule by allowing them to move to further campsites, and holds backgroups who are ahead of schedule. In this way, it ensures that all trips willbe completed in precisely the length of time the passenger had planned for.But scheduling is only part of what our algorithm can do. It can alsocompute a maximum number of possible trips over the six-month season.We call this the carrying capacity of the river. If we find we are below ourcarrying capacity, our algorithm can tell us how many more groups wecould be adding to the water each day. Conversely, if we are experiencingriver congestion, we can determine how many fewer groups we should beadding each day to get things running smoothly again.An interesting finding of our algorithm is how the ratio of oar-poweredriver rafts to motorized boats affects the number of trips we can send downstream. When dealing with an even distribution of trip durations (from 6 to18 days), we recommend a 1:1 ratio to maximize the river’s carrying capacity.If the distribution is skewed towards shorter trip durations, then ourmodel predicts that increasing towards a 4:1 ratio will cause the carryingcapacity to increase. If the distribution is skewed the opposite way, towards longer trip durations, then the carrying capacity of the river will always beless than in the previous two cases—so this is not recommended.Our algorithm has been thoroughly tested, and we believe that it isa powerful tool for determining the river’s carrying capacity, optimizing daily schedules, and ensuring that people will be able to complete their trip as planned while enjoying a true wilderness experience.Sincerely yours,Team 13955。
2012 MCM ProblemsPROBLEM A:The Leaves of a Tree"How much do the leaves on a tree weigh?" How might one estimate the actual weight of the leaves (or for that matter any other parts of the tree)? How might one classify leaves? Build a mathematical mode l to describe and classify leaves. Consider and answer the following:• Why do leaves have the various shapes that they have?• Do the shapes “minimize” overlapping individual shadows that are cast, so as to maximize exposure? Does the distribution of leaves within the “volume” of the tree and its branches effect the shape?• Speaking of profiles, is leaf shape (general characteristics) related to tree profile/branching structure?• How would you estimate the leaf mass of a tree? Is there a correlation between the leaf mass and the size characteristics of the tree (height, mass, volume defined by the profile)?In addition to your one page summary sheet prepare a one page letter to an editor of a scientific journal outlining your key findings.“多少钱树的叶子有多重?”怎么可能估计的叶子(或树为此事的任何其他部分)的实际重量?会如何分类的叶子吗?建立了一个数学模型来描述和分类的叶子。
2012年美国数学建模题目中文版第一篇:2012年美国数学建模题目解析2012年美国数学建模竞赛题目分为3个部分:A、B、C 部分,其中A、B两部分每个题目都设计成了开放式问题,而C部分则是两道严谨的数学证明题目。
A部分共有四个问题,分别为:1、搜索引擎的自动补充功能对于使用者的输入进行了什么样的预测和补全?如果这种功能可以被改变,在搜索引擎中进行必要的优化,会对搜索引擎的使用产生什么影响?2、在一个公共交通的网络中,如何合理地分配车辆保证所有的车辆在一定时间内都能够按时到达各自的终点站?3、如何在餐馆排队时,给不同的桌子和不同的人分配最佳位置,以便让顾客在餐厅等待的时间最短?4、针对特定的树木,如何编写算法来找到该树生长的变化,在叶片的数量和大小、气孔的数量和大小等方面的特征?对于这四个问题,考生需要通过分析问题,理清思路,构思模型,进行数据分析,最后得出自己的结论。
需要注意的是,每个问题都是非常开放式的,没有标准答案,最终得分并不会仅仅取决于观点是否正确,具体的解题过程、数据展示和准确度也是非常关键的。
B部分共有三个问题,分别为:1、如何通过旅游者在社交网络上的信息,帮助旅游者更好地定制旅游计划?2、如何在残缺不全的传媒报道中,找到事实并从中解读该事件?3、针对滑雪者在滑雪过程中的各种情况,如何预测他们的滑雪技巧以及未来的滑雪表现?对于B部分的三个问题,其实也都是很自由的问题,可以根据自己所擅长领域进行分析,构思自己的模型和算法,注重细节和数据展示。
C部分共有两个题目:1、已知一个最小二乘问题,其正则化后的解为稀疏的,试设计一个迭代算法在有效的处理机制下对其进行数值求解。
2、已知一个对象向一条线段上匀速运动,在线段的中途,运动的对象突然重力下落,如果目标是在最短的时间内捕捉该运动的对象,该怎样运动才是最优策略?对于C部分两个题目,需要在数学基础扎实的基础上进行思考,深入分析,构建出严谨的证明过程,注重逻辑和方法。

太阳能小屋的设计摘要本文提出了一种光伏电池“反馈式铺设”的方案,把每个问题下的铺设任务分离为几个有序的步骤来进行,步骤之间联系紧密,后一步骤的进行甚至可以反过来改变前一步骤的结果,经过多次反馈后,可以得到较优的解。
在此方案的基础上,对太阳能小屋铺设问题进入了深入的研究。
针对问题一,我们首先处理了大同市典型气象年气象数据,得到了各个表面的年辐射总量,由于各个表面的年辐射总量不一样,所以针对于各个表面的各个光伏电池的发电量、盈利额度、单位面积效益等都要分别进行计算,尤其是屋顶的情况,公示推导繁琐,数据处理起来颇为复杂,数据处理完毕后,选取候选光伏电池,建立矩形排样的模型,将各表面的非矩形约束条件转化为矩形约束来求解,铺设完成后,根据铺设的结果选取适当的光伏电池进行二次再铺设,而后将光伏电池组件进行分组,选取逆变器,调整二次再铺设后的铺设结果,使得逆变器的选取以及光伏电池组件的分组达到较佳的状态。
在问题二中,我们首先利用matlab算取了架空方式安装下的最佳倾斜角度和旋转角度,然后将架空方式安装的光伏电池进行相应的变换投影到太阳能小屋表面,根据变换后的图形利用类似问题一中提出的算法进行铺设。
在问题三中,根据题目给出的小屋建筑要求,将约束条件转化为lingo中的语言,目标函数是使得问题一中的盈利表面的面积尽可能大,房屋屋顶的倾斜角尽可能接近问题二中的最佳倾斜角。
lingo求解出的房屋尺寸在solidworks中进行三维建模,建模后的房屋进行光伏电池的铺设,根据光伏电池的铺设情况对房屋的尺寸进行小范围的调整,使得房屋的设计达到较优,即使小屋的全年发电总量尽可能大,单位发电量的费用尽可能小。
关键词:太阳能小屋光伏电池逆变器反馈式铺设最小劣度矩形排样一、问题重述在设计太阳能小屋时,需在建筑物外表面(屋顶及外墙)铺设光伏电池,光伏电池组件所产生的直流电需要经过逆变器转换成220V交流电才能供家庭使用,并将剩余电量输入电网。

A 题热水澡一个人进入浴缸洗澡放松。
浴缸的热水由一个水龙头放出。
然而浴缸不是一个可以水疗泡澡的缸,没有辅助加热系统和循环喷头,仅仅就是一个简单的盛水容器。
过一会,水温就会显著下降。
因此必须从热水龙头里面反复放水以加热水温。
浴缸的设计就是当水达到浴缸的最大容量,多余的水就会通过一个溢流口流出。
做一个有关浴缸水温的模型,从时间和地点两个方面来确定在浴缸中泡澡的人能采用的最佳策略,从而泡澡过程中能保持水温并在不浪费太多水的情况下使水温尽量接近最初的水温。
用你的模型来确定你的策略多大程度上依赖于浴缸的形状和容量,浴缸中的人的体型/体重/体温,以及这个人在浴缸中做出的动作。
如果这个人在最开始放水的时候加入了泡泡浴添加剂,这将会对你的模型结果有什么影响?要求提交一页MCM的总结,此外你的报告必须包括一页给浴缸用户看的非技术性的解释,其中描述了你的策略并解释了在泡澡过程中为什么保持平均的水温会非常困难。
B题太空垃圾地球轨道周围的小碎片的数量受到越来越多的关注。
据估计,目前大约有超过50万片太空碎片被视为是宇宙飞行器的潜在威胁并受到跟踪,这些碎片也叫轨道碎片。
2009年2月10号俄罗斯卫星科斯莫斯-2251与美国卫星iridium-33相撞的时候,这个问题在新闻媒体上就愈发受到广泛讨论。
已经提出了一些方法来清除这些碎片。
这些方法包括小型太空水流喷射器和高能量激光来瞄准具体的碎片,还有大型卫星来清扫碎片等等。
这些碎片数量和大小不一,有油漆脱离的碎片,也有废弃的卫星。
碎片高速转动使得定位清除变得困难。
建一个随时间变化的模型来确定一个最佳选择或组合的选择提供给一家私人公司让它以此为商业机遇来解决太空碎片问题。
你的模型应该包括对成本、风险、收益的定量和/或定性分析以及其他重要因素的分析。
你的模型应该既能够评估单个的选择也能够评估组合的选择,且能够探讨一些重要的”what if ”情景。
用你的模型来确定是否存在这样的机会,在经济上很有吸引力;或是根本不可能有这样的机会。
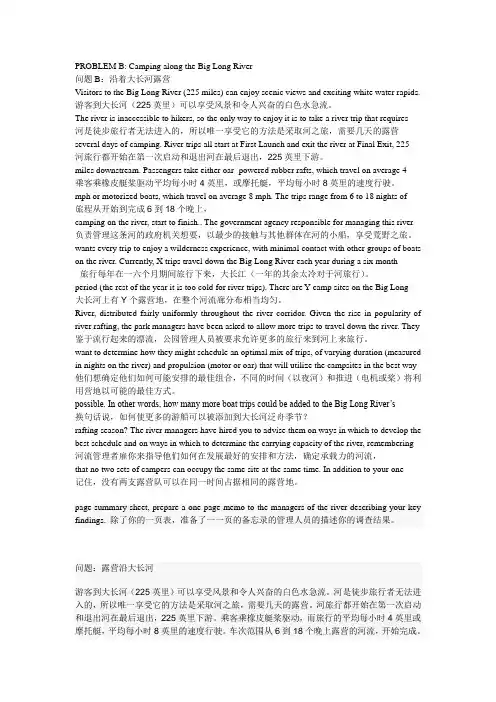
PROBLEM B: Camping along the Big Long River问题B:沿着大长河露营Visitors to the Big Long River (225 miles) can enjoy scenic views and exciting white water rapids. 游客到大长河(225英里)可以享受风景和令人兴奋的白色水急流。
The river is inaccessible to hikers, so the only way to enjoy it is to take a river trip that requires河是徒步旅行者无法进入的,所以唯一享受它的方法是采取河之旅,需要几天的露营several days of camping. River trips all start at First Launch and exit the river at Final Exit, 225河旅行都开始在第一次启动和退出河在最后退出,225英里下游。
miles downstream. Passengers take either oar- powered rubber rafts, which travel on average 4乘客乘橡皮艇桨驱动平均每小时4英里,或摩托艇,平均每小时8英里的速度行驶。
mph or motorized boats, which travel on average 8 mph. The trips range from 6 to 18 nights of旅程从开始到完成6到18个晚上,camping on the river, start to finish.. The government agency responsible for managing this river负责管理这条河的政府机关想要,以最少的接触与其他群体在河的小船,享受荒野之旅。
2012年M B A英语真题及答案解析Section I Use of EnglishDirections:Read the following text. Choose the best word(s) for each numbered black and mark A, B, C orD on ANSWER SHEET 1. (10 points)Millions of Americans and foreigners see G.I. Joe as a mindless war toy, the symbol of American military adventurism, but that’s not how it used to be. To the men and women who 1 in WorldWar II and the people they liberated, the G.I. was the 2 man grown into hero, the pool farm kid torn away from his home, the guy who 3 all the burdens of battle, who slept in cold foxholes, who went without the 4 of food and shelter, who stuck it out and drove back the Nazi reignof murder. This was not a volunteer soldier, not someone well paid, 5 an average guy, up6 the best trained, best equipped, fiercest, most brutal enemies seen in centuries.His name is not much.GI.is just a military abbreviation 7 Government Issue, and it was on all of the article 8 to soldiers. And Joe? A common name for a guy who never 9 itto the top. Joe Blow, Joe Magrac… a working class name. The United States has 10 had apresident or vicepresident or secretary of state Joe.G.I. joe had a 11 career fighting German ,Japanese, and Korean troops. He appers as acharacter, or a 12 of american personalities, in the 1945 movie The Story of G.I. Joe, based on the last days of war correspondent Ernie Pyle. Some of the soldiers Pyle 13 portraydethemselves in the film. Pyle was famous for covering the 14 side of the warl, writing aboutthe dirt-snow -and-mud soldiers, not how many miles were 15 or what towns were captured orliberated, His reports 16 the “willie”cartoons of famed Stars and Stripes artist Bill Maulden. Both men 17 the dirt and exhaustion of war, the 18 of civilization that the soldiersshared with each other and the civilians: coffee, tobacco, whiskey, shelter, sleep. 19 Egypt, France, and a dozen more countries, G.I. Joe was any American soldier, 20 the most important person intheir lives.1.[A] performed [B]served [C]rebelled [D]betrayed2.[A] actual [B]common [C]special [D]normal3.[A]bore [B]cased [C]removed [D]loaded4.[A]necessities [B]facilitice [C]commodities [D]propertoes5.[A]and [B]nor [C]but [D]hence6.[A]for [B]into [C] form [D]against7.[A]meaning [B]implying [C]symbolizing [D]claiming8.[A]handed out [B]turn over [C]brought back [D]passed down9.[A]pushed [B]got [C]made [D]managed10.[A]ever [B]never [C]either [D]neither11.[A]disguised [B]disturbed [C]disputed [D]distinguished12.[A]company [B]collection [C]community [D]colony13.[A]employed [B]appointed [C]interviewed [D]questioned14.[A]ethical [B]military [C]political [D]human15.[A]ruined [B]commuted [C]patrolled [D]gained16.[A]paralleled [B]counteracted [C]duplicated [D]contradicte17.[A]neglected [B]avoided [C]emphasized [D]admired18.[A]stages [B]illusions [C]fragments [D]advancea19.[A]With [B]To [C]Among [D]Beyond20.[A]on the contrary [B] by this means [C]from the outset [D]at that point完形填空参考答案1~5 BBAAC 6~10 DCACB 11~15 DBCDD 16~20 ACCBDSection II Reading ComprehensionPart ADirections:Read the following four texts. Answer the questions after each text by choosing A, B, C or D. Mark your answers on ANSWER SHEET 1. (40points)Text 1’s academic grade.This rule is meant to address the difficulty that students from impoverished or chaotic homes might have in completing their homework. But the policy is unclear and contradictory. Certainly,no homework should be assigned that students cannot do without expensive equipment. But if thedistrict is essentially giving a pass to students who do not do their homework because of complicated family lives, it is going riskily close to the implication that standards need tobe lowered for poor children.District administrators say that homework will still be a pat of schooling: teachers areallowed to assign as much of it as they want. But with homework counting for no more than 10%oftheir grades, students can easily skip half their homework and see vey little difference on theirreport cards. Some students might do well on state tests without completing their homework, but what about the students who performed well on the tests and did their homework? It is quite possible that the homework helped. Yet rather than empowering teachers to find what works best for theirstudents, the policy imposes a flat, across-the-board rule.At the same time, the policy addresses none of the truly thorny questions about homework.If the district finds homework to be unimportant to its students’academic achievement, it should move t o reduce or eliminate the assignments, not make t hem count for almost nothing. Conversely,if homework matters,it should account for asignificant portion of the grade.Meanwhile,this policydoes nothing to ensure that the homework students receive is meaningful oraooropriate to theirage and the subject.or that teachers are not assigning more than they are willing to review andcorrect.The homework rules should be put on hold while the school board, which is responsible forsetting educational policy, looks into the matter and conducts public hearings. It is not toolate for L.A. Unified to do homework right.21.It is implied in paragraph 1 that nowadays homework_____.[A] is receiving more criticism[B]is no longer an educational ritual[C]is not required for advanced courses[D]is gaining more preferences[A]tend to have moderate expectations for their education[B]have asked for a different educational standard[C]may have problems finishing their homework[D]have voiced their complaints about homework23. According to Paragraph 3,one problem with the policy is that it may____.[A]discourage students from doing homework[B]result in students' indifference to their report cards[C]undermine the authority of state tests[D]restrict teachers' power in education24. As mentioned in Paragraph 4, a key question unanswered about homework is whether______.[A] it should be eliminated[B]it counts much in schooling[C]it places extra burdens on teachers[D]it is important for grades25.A suitable title for this text could be______.[A]Wrong Interpretation of an Educational Policy[B]A Welcomed Policy for Poor Students[C]Thorny Questions about Homework[D]A Faulty Approach to Homework参考答案21~25 ACABDText 2Pretty in pink: adult women d o not remember being so obsessed with the colour, yet it is pervasive in our young girls’ lives. It is not that pink is intrinsically bad, but it is such a tiny sliceof the rainbow and, though it may celebrate girlhood in one way, it also repeatedly and firmlyfuses girls’identity to appearance. Then it presents that connection, even among t wo-year-olds, between girls as not only innocent but as evidence of innocence. Looking around, I despairedat the singular lack of imagination about girls’ lives and interests.Girls’ attraction to pink may seem unavoidable, somehow encoded in their DNA, but accordingto Jo Paoletti, an associate professor of American Studies, it is not. Childrenwere not colour-coded at all until the early 20th century: in the era before domestic washingmachines all babies wore white as a practical matter, since the only way of getting clothes clean was to boil them. What’s more, both boys and girls wore what were thought of as gender-neutraldresses. When nursery colours were introduced, pink was actually considered the more masculinecolour, a pastel version of red, which was associated with strength. Blue, with its intimationsof the Virgin Mary, constancy and faithfulness, symbolised femininity. It was not until themid-1980s, when amplifying age and sex differences became a dominant children’s marketing strategy, that pink fully came into its own, when it began to seem i nherently attractiveto girls, part of what defined them as female, at least for the first few critical years.I had not realised how profoundly marketing trends dictated our perception of what is natural to kids, including our core beliefs about their psychological development. Take the toddler.I assumed that phase was something experts developed after years of research into children’s behaviour: wrong. Turns out, according to Daniel Cook, a historian of childhood consumerism,it was popularised as a marketing trick by clothing manufacturers in the 1930s.Trade publications counselled department stores that, in order to increase sales, they should create a “third stepping, stone” between infant wear and older kids’ clothes. It was only after“toddler” became a common shoppers’ term that it evolved into a broadly accepted developmentalstage. Splitting kids, or adults, into ever-tinier categories has proved a sure-fire way to boost profits. And one of the easiest ways to segment a market is to magnify gender differences - orinvent them where they did not previously exist.26.By saying "it is...the rainbow"(Line 3, Para.1),the author means pink______.[A]should not be the sole representation of girlhood[B]should not be associated with girls' innocence[C]cannot explain girls' lack of imagination[D]cannot influence girls' lives and interests27.According to Paragraph 2, which of the following is true of colours?[A]Colours are encoded in girls' DNA.[B]Blue used to be regarded as the colour for girls.[C]Pink used to be a neutral colour in symbolising genders.[D]White is prefered by babies.28.The author suggests that our perception of children's psychological development was muchinfluenced by_____.[A]the marketing of products for children[B]the observation of children's nature[C]researches into children's behavior[D]studies of childhood consumption29.We may learn from Paragraph 4 that department stores were advised to_____.[A]focus on infant wear and older kids' clothes[B]attach equal importance to different genders[C]classify consumers into smaller groups[D]create some common shoppers' terms30.It can be concluded that girls' attraction to pink seems to be____.[A] clearly explained by their inborn tendency[B]fully understood by clothing manufacturers[C] mainly imposed by profit-driven businessmen[D]well interpreted by psychological experts参考答案26~30 ABACCText 3In 2010, a federal judge shook America's biotech industry to its core. Companies had wonpatents for isolated DNA f or decades-by 2005 some 20% o f human genes were parented. But in March 2010 a judge ruled that genes were unpatentable. Executives were violently agitated. TheBiotechnology Industry Organisation (BIO), a trade group, assured members that this was justa “preliminary step” in a longer battle.On July 29th they were relieved, at least temporarily. A federal appeals court overturnedthe prior decision, ruling that Myriad Genetics could indeed hold patents to two genes that help forecast a woman's risk of breast cancer. The chief executive of Myriad, a company in Utah, said the ruling was a blessing to firms and patients alike.But as companies continue their attempts at personalised medicine, the courts will remainrather busy. The Myriad case itself is probably not over Critics make three main arguments against gene patents: a gene is a product of nature, so it may not be patented; gene patents suppressinnovation rather than reward it; and patents' monopolies restrict access to genetic tests such as Myriad's. A growing number seem to agree. Last year a federal task-force urged reform forpatents related to genetic tests. In October the Department of Justice filed a brief in the Myriad case, arguing that an isolated DNA molecule “is no less a product of nature... than are cottonfibres that have been separated from cotton seeds. ”Despite the appeals court's decision, big questions remain unanswered. For example, it isunclear whether the sequencing of a whole genome violates the patents of individual genes within it. The case may yet reach the Supreme Court.As the industry advances, however, other suits may have an even greater impact. Companiesare unlikely to file many more patents for human DNA molecules-most are already patented or inthe public domain .firms are now studying how genes interact, looking for correlations that might be used to determine the causes of disease or predict a drug’s efficacy, companies are eager towin patents for “connecting the dots,” explains Hans Sauer, a lawyer for the BIO.Their success may be determined by a suit related to this issue, brought by the Mayo Clinic, which the Supreme Court will hear in its next term. The BIO recently held a convention whichincluded sessions to coach lawyers on the shifting landscape for patents. Each meeting was packed.31. It can be learned from Paragraph 1 that the biotech companies would like .[A] their executives to be active[B] judges to rule out gene patenting[C] genes to be patentable[D] the BIO to issue a warning32.Those who are against gene patents believe that .[A] genetic tests are not reliable[B] only man-made products are patentable[C] patents on genes depend much on innovation[D] courts should restrict access to gene tic tests33. According to Hans Sauer, companies are eager to win patents for .[A] establishing disease correlations[B] discovering gene interactions[C] drawing pictures of genes[D] identifying human DNA34. By saying “each meeting was packed”(Line4,Para.6) the author means that .[A] the supreme court was authoritative[B] the BIO was a powerful organization[C] gene patenting was a great concern[D] lawyers were keen to attend conventions35. Generally speaking, the author’s attitude toward gene patenting is .[A] critical[B] supportive[C] scornful[D] objective参考答案31~35 CBBCDThe great recession may be over, but this era of high joblessness is probably beginning.Before it ends, it will likely change the life course and character of a generation of youngadults. And ultimately, it is likely to reshape our politics, our culture, and the characterof our society for years.No one tries harder than the jobless to find silver linings in this national economic disaster. Many said that unemployment, while extremely painful, had improved them in some ways; they hadbecome less materialistic and more financially prudent; they were more aware of the strugglesof others. In limited respects, perhaps the recession will leave society better off. At the very last, it has awoken us from our national fever dream of easy riches and bigger houses, and puta necessary end to an ear of reckless personal spending.But for the most part, these benefits seem thin, uncertain, and far off. In The Moral Consequences o f Economic Growth, the economic historian Benjamin Friedman argues that both inside and outside the U.S., lengthy periods of economic stagnation or decline have almost always left society more mean-spirited and less inclusive, and have usually stopped or reversed the advance of rights and freedoms. Anti-immigrant sentiment typically increases, as does conflict betweenraces and classes.In come inequality usually falls during a recession, but it has not shrunk in this one. Indeed,this period of economic weakness may reinforce class divides, and decrease opportunities to cross them-especially for young people. The research of Till Von Wachter, the economist at ColumbiaUniversity suggests that not all people graduating into a recession see their life chances dimmed; those with degrees from elite universities catch up fairly quickly to where they otherwise would have been if they had graduated in better times; it is the masses beneath them that are leftbehind.In the Internet age, it is particularly easy to see the resentment that has always been hidden within American society. More difficult, in the moment, is discerning precisely how these leantimes are affecting society’s character. In many respects, the U.S. was more socially tolerantentering this recession than at any time in its history, and a variety of national polls on social conflict since then have shown mixed results. We will have to wait and see exactly how thesehard times will reshape our social fabric. But they certainly it, and all the more so the longer they extend.36. By saying “to find silver linings” (Line 1, Para. 2) the author suggests that the joblesstry to.[A] seek subsidies from the government[B] explore reasons for the unemployment[C] make profits from the troubled economy[D] look on the bright side of the recession37. according to Paragraph 2, the recession has made people .[A] realize the national dream[B] struggle against each other[C] challenge their prudence[D] reconsider their lifestyle38. Benjamin Friedman believes that economic recession may .[A] impose a heavier burden on immigrants[B] bring out more evils of human nature[C] promote the advance of rights and freedoms[D] ease conflicts between races and classes39.The research of Till Von Wachter suggests that in the recession graduates from eliteuniversities tend to .[A] lag behind the others due to decreased opportunities[B] catch up quickly with experienced employees[C] see their life chances as dimmed as the others[D] recover more quickly than the others40. The author thinks that the influence of hard times on society is .[A] certain[B] positive[C] trivial[D] destructive参考答案36~40 DDBDAPart BDirections:(7选5)Read the following text and answer the questions by finding information from the right column that corresponds to each of the marked details given in the left column. There are two extra choices in the right column. Mark your answer on ANSWER SHEET 1. (10 points)“Universal history, the history of what man has accomplished in this world, is at bottom theHistory of the Great Men who have worked here,” wrote the Victorian sage Thomas Carlyle. Well,not any more it is not.Suddenly, Britain looks to have fallen out with its favourite historical form. This could beno more than a passing literary craze, but it also points to a broader truth about how we nowapproach the past: less concerned with learning from forefathers and more interested in feeling their pain. Today, we want empathy, not inspiration.From the earliest days of the Renaissance, the writing of history meant recounting the exemplary lives of great men. In 1337, Petrarch began work on his rambling writing De Viris Illustribus- On Famous Men, highlighting the virtus (or virtue) of classical heroes. Petrarch celebratedtheir greatness in conquering fortune and rising to the top. This was the biographical tradition which Niccolo Machiavelli turned on its head. In The Prince, the championed cunning,ruthlessness, and boldness, rather than virtue, mercy and justice, as the skills of successfulleaders.Over time, the attributes of greatness shifted. The Romantics commemorated the leading painters and authors of their day, stressing the uniqueness of the artist's personal experience ratherthan public glory. By contrast, the Victorian author Samual Smiles wrote Self-Help as a catalogue of the worthy lives of engineers , industrialists and explores . "The valuable examples whichthey furnish of the power of self-help, if patient purpose, resolute working and steadfastintegrity, issuing in the formulation of truly noble and many character, exhibit,"wroteSmiles."what it is in the power of each to accomplish for himself"His biographies of James Walt, Richard Arkwright and Josiah Wedgwood were held up as beacons to guide the working man through his difficult life.This was all a bit bourgeois for Thomas Carlyle, who focused his biographies on the truly heroic lives of Martin Luther, Oliver Cromwell and Napoleon Bonaparte. These epochal figures represented lives hard to imitate, but to be acknowledged as possessing higher authority than mere mortals.Communist Manifesto. For them, history did nothing, it possessed no immense wealth nor wagedbattles:“It is man, real, living man who does all that.” And history should be the story of the masses and their record of struggle. As such, it needed to appreciate the economic realities,the social contexts and power relations in which each epoch stood. For:“Men m ake t heir own history, but they do not make it just as they please; they do not make it under circumstances chosen bythemselves, but under circumstances directly found, given and transmitted from the past.”This was the tradition which revolutionized our appreciation of the past. In place of ThomasCarlyle, Britain nurtured Christopher Hill, EP Thompson and Eric Hobsbawm. History from belowstood alongside biographies of great men. Whole new realms of understanding - from gender torace to cultural studies - were opened up as scholars unpicked the multiplicity of lost societies.And it transformed public history too: downstairs became just as fascinating as upstairs.[A] emphasized the virtue of classical heroes.41. Petrarch[B] highlighted the public glory of the leading artists.42. Niccolo Machiavellli [C] focused on epochal figures whose lives were hard to imitate.43. Samuel Smiles[D] opened up new realms of understanding the great menin history.44. Thomas Carlyle[E] held that history should be the story of the massesand their record of struggle.45. Marx and Engels[F] dismissed virtue as unnecessary for successfulleaders.[G] depicted the worthy lives of engineer industrialistsand explorers.参考答案41~45 AFGCE46.Direction:When people in developing countries worry about migration, they are usually concerned atthe prospect of their best and brightest departure to Silicon Valley or to hospitals anduniversities in the developed world. These are the kind of workers that countries like Britian, Canada and Australia try to attract by using immigration rules that privilege college graduates .Lots of studies have found that well-educated people from developing countries areparticularly likely to emigrate. A big survey of Indian households in 2004 found that nearly40% of emigrants had more than a high-school education, compared with around 3.3%of all Indians over the age of 25 . This "brain drain "has long bothered policymakers in poor countries. Theyfear that it hurts their economies, depriving them of much-needed skilled workers who could have taught at their universities, worked in their hospitals and come up with clever new productsfor their factories to make.46.翻译答案:当来自发展中国家的人们担心移民的问题时,他们通常关心的是自己是否有希望离开家乡,而成功地进入硅谷,或进入发达国家的医院和大学工作。
1985 年美国大学生数学建模竞赛MCM 试题1985年MCM:动物种群选择合适的鱼类和哺乳动物数据准确模型。
模型动物的自然表达人口水平与环境相互作用的不同群体的环境的重要参数,然后调整账户获取表单模型符合实际的动物提取的方法。
包括任何食物或限制以外的空间限制,得到数据的支持。
考虑所涉及的各种数量的价值,收获数量和人口规模本身,为了设计一个数字量代表的整体价值收获。
找到一个收集政策的人口规模和时间优化的价值收获在很长一段时间。
检查政策优化价值在现实的环境条件。
1985年MCM B:战略储备管理钴、不产生在美国,许多行业至关重要。
(国防占17%的钴生产。
1979年)钴大部分来自非洲中部,一个政治上不稳定的地区。
1946年的战略和关键材料储备法案需要钴储备,将美国政府通过一项为期三年的战争。
建立了库存在1950年代,出售大部分在1970年代初,然后决定在1970年代末建立起来,与8540万磅。
大约一半的库存目标的储备已经在1982年收购了。
建立一个数学模型来管理储备的战略金属钴。
你需要考虑这样的问题:库存应该有多大?以什么速度应该被收购?一个合理的代价是什么金属?你也要考虑这样的问题:什么时候库存应该画下来吗?以什么速度应该是画下来吗?在金属价格是合理出售什么?它应该如何分配?有用的信息在钴政府计划在2500万年需要2500万磅的钴。
美国大约有1亿磅的钴矿床。
生产变得经济可行当价格达到22美元/磅(如发生在1981年)。
要花四年滚动操作,和thsn六百万英镑每年可以生产。
1980年,120万磅的钴回收,总消费的7%。
1986 年美国大学生数学建模竞赛MCM 试题1986年MCM A:水文数据下表给出了Z的水深度尺表面点的直角坐标X,Y在码(14数据点表省略)。
深度测量在退潮。
你的船有一个五英尺的草案。
你应该避免什么地区内的矩形(75200)X(-50、150)?1986年MCM B:Emergency-Facilities位置迄今为止,力拓的乡牧场没有自己的应急设施。
问题B:大量物种灭绝已经发生
亚马逊雨林是这个世界上最大的雨林,它拥有世界上最多的野生动物。
它座落在南美洲北面被巴西,玻利维亚等9个国家所分享。
因为乱砍乱伐的在雨林造成了致命的影响,所以这条信息需要普及。
虽然短期内砍伐能产生经济效益,但是长期下去会损害亚马逊雨林。
砍伐已经到达了历史的最低点,而在巴西仅仅只有50%的雨林处于被保护的状态。
但是栖息地遗失所产生的影响将在一段时间后会显示出来。
“砍伐在很短的时间内并不能杀死鸟类,长时间就会死亡,它们被挤在狭小的剩下的栖息地里,这样死亡率从就会逐渐提高”,生物学家这样说。
要求:
一.建立砍伐效应的模型,物种大灭绝是否会在未来近期发生。
二.用你的模型区预估多少物种会在未来20年会灭绝,考虑四种情景:
1.商业自由放任砍伐
2.出台一些规定
3.按照政府的规定目标,到2020年为止坚决减少80%的砍伐
4. 2020年终止采伐
三.写一份20页的报告(不包括摘要)表现出你对关于砍伐效应猜想的分析,保证包括政府在确保生态安全方面所扮演的角色。
2012 Contest ProblemsMCM PROBLEMSPROBLEM A: The Leaves of a Tree"How much do the leaves on a tree weigh?" How might one estimate the actual weight of the leaves (or for that matter any other parts of the tree)? How might one classify leaves? Build a mathematical model to describe and classify leaves. Consider and answer the following:• Why do leaves have the various shapes that they have?• Do the shapes “minimize” overlapping individual shadows that are cast, so as to maximize exposure? Does the distribution of leaves within the “volume” of the tree and its branches effect the shape?• Speaking of profiles, is leaf shape (general characteristics) related to tree profile/branching structure?• How would you estimate the leaf mass of a tree? Is there a correlation between the leaf mass and the size characteristics of the tree (height, mass, volume defined by the profile)?In addition to your one page summary sheet prepare a one page letter to an editor of a scientific journal outlining your key findings.“一棵树的叶子有多重?”怎么能估计树的叶子(或者树的任何其它部分)的实际重量?怎样对叶子进行分类?建立一个数学模型来对叶子进行描述和分类。
承诺书我们仔细阅读了中国大学生数学建模竞赛的竞赛规则.我们完全明白,在竞赛开始后参赛队员不能以任何方式(包括电话、电子邮件、网上咨询等)与队外的任何人(包括指导教师)研究、讨论与赛题有关的问题。
我们知道,抄袭别人的成果是违反竞赛规则的, 如果引用别人的成果或其他公开的资料(包括网上查到的资料),必须按照规定的参考文献的表述方式在正文引用处和参考文献中明确列出。
我们郑重承诺,严格遵守竞赛规则,以保证竞赛的公正、公平性。
如有违反竞赛规则的行为,我们将受到严肃处理。
我们授权全国大学生数学建模竞赛组委会,可将我们的论文以任何形式进行公开展示(包括进行网上公示,在书籍、期刊和其他媒体进行正式或非正式发表等)。
我们参赛选择的题号是(从A/B/C/D中选择一项填写):我们的参赛报名号为(如果赛区设置报名号的话):所属学校(请填写完整的全名):参赛队员(打印并签名) :1.2.3.指导教师或指导教师组负责人(打印并签名):日期: 2012 年 9 月 10 日赛区评阅编号(由赛区组委会评阅前进行编号):编号专用页赛区评阅编号(由赛区组委会评阅前进行编号):全国统一编号(由赛区组委会送交全国前编号):全国评阅编号(由全国组委会评阅前进行编号):太阳能小屋光伏电池铺设的优化设计摘要本文首先通过Matlab软件编程计算,得到小屋各个外表面上最优光伏电池的型号、数量,通过串、并联的形式进行排布并选择合适的逆变器,对小屋进行最优贴附铺设,从而计算出小屋光伏电池35年内的发电总量、经济效益和回收年限。
其次,根据太阳辐射量模型和最佳倾角模型,计算出该地的最佳倾角,再借助于Matlab软件进行数据处理,在架空方式下对小屋外表面铺设光伏电池板,优化了前面的结果。
最后,根据小屋的建筑要求及相应的计算过程,重新为该地设计了一个太阳能小屋,并给出了相应的计算结果,证明所设计小屋的优化性。
关键词:光伏电池,贴附,架空,太阳辐射量模型,最佳倾角模型一、问题的重述随着社会的发展和科技的进步和生态环境也因化石燃料的使用而日趋恶化。
PROBLEM B: Camping along the Big Long RiverVisitors to the Big Long River (225 miles) can enjoy scenic views and exciting white water rapids. The river is inaccessible to hikers, so the only way to enjoy it is to take a river trip that requires several days of camping. River trips all start at First Launch and exit the river at Final Exit, 225 miles downstream. Passengers take either oar- powered rubber rafts, which travel on average 4 mph or motorized boats, which travel on average 8 mph. The trips range from 6 to 18 nights of camping on the river, start to finish.. The government agency responsible for managing this river wants every trip to enjoy a wilderness experience, with minimal contact with other groups of boats on the river. Currently, X trips travel down the Big Long River each year during a six month period (the rest of the year it is too cold for river trips). There are Y camp sites on the Big Long River, distributed fairly uniformly throughout the river corridor. Given the rise in popularity of river rafting, the park managers have been asked to allow more trips to travel down the river. They want to determine how they might schedule an optimal mix of trips, of varying duration (measured in nights on the river) and propulsion (motor or oar) that will utilize the campsites in the best way possible. In other words, how many more boat trips could be added to the Big Long River’s rafting season? The river managers have hired you to advise them on ways in which to develop the best schedule and on ways in which to determine the carrying capacity of the river, remembering that no two sets of campers can occupy the same site at the same time. In addition to your one page summary sheet, prepare a one page memo to the managers of the river describing your key findings.Nowadays the heavy metal pollution is so common that people pay more and more attention to it. The aim of this paper is to calculate the maximum of methylmercury in human body during their lifetime and the maximum number of fish the average adult can safely eat per month. From City Officials research[1], we get information that the mean value of methylmercury in bass samples of the Neversink Reservoir is 1300 ug/kg and the average weight of bass people consume per month is 0.7 kg. According to the different consuming time in every month, we construct a discrete dynamical system model for the amount of methylmercury that will be bioaccumulated in the average adult body. In ideal conditions, we assume people consume bass at fixed term per month. Based on it, we construct fixed-ingestion model and we reach the conclusion that the maximum amount of methylmercury the average adult human will bioaccumulate in their lifetime is 3505 ug. As methylmercury ingested is not only coming from bass but also from other food, hence, we make further revise to our model so that the model is closer to the actual situation.As a result, we figure out the maximum amount of methylmercury the average adult human will bioaccumulate in their lifetime is 3679 ug. As a matter of fact, although we assume people consume one fish per month, the consuming time has great randomness. Taking the randomness into consideration, we construct a random-ingestion model at the basis of the first model. Through computer simulations, we obtain the maximum of methylmercury in human body is 4261 ug. We also calculate the maximum amount is 4420 ug after random-ingestion model is revised. As it is known to us, different countries and districts have different criterions for mercury toxicity. In our case, we adopt LD50 as the toxic criterions(LD50 is the dosage at which 50% of the humans exposed to a particular chemical will die. The LD50 for methylmercury is 50 mg/kg.). We speculate mercury toxicity has effect on the ability of eliminating mercury, therefore, we set up variable-elimination model at the basis of the first model. According to the first model, the amount of methylmercury in human body is 50 ug/kg, far less than 50 mg/kg, so we reach the conclusion that the fish consumption restrictions put forward by the reservoir advisories can protect the average adult. If the amount of methylmercury ingested increases, the amount of bioaccumulation will go up correspondingly. If 50 mg/kg is the maximum amount of methylmercury in human body, we can obtain the maximum number of fish that people consume safely per month is 997.Keywords: methylmercury discrete dynamical system model variable-elimination modeldiscrete uniform random distribution model random-ingestion modelIntroductionWith the development of industry, the degree of environmental pollution is also increasing. Human activities are responsible for most of the mercury emitted into the environment. Mercury, a byproduct of coal, comes from acid rain from the smokestack emissions of old, coal-fired power plants in the Midwest and South. Its particles rise on the smokestack plumes and hitch a ride on prevailing winds, whichoften blow northeast. After colliding with the Catskill mountain range, the particles drop to the earth. Once in the ecosystem, micro-organisms in the soil and reservoir sediment break down the mercury and produce a very toxic chemical form known as methylmercury . It has great effect on human health.Public officials are worried about the elevated levels of toxic mercury pollution in reservoirs providing drinking water to the New Y ork City . They have asked for our assistance in analyzing the severity of the problem. As a result of the bioaccumulation of methylmercury , if the reservoir is polluted, we can make sure that the amount of methylmercury in fish is also increasing. If each person adheres to the fish consumption restrictions as published in the Neversink Reservoir advisory and consumes no more than one fish per month, through analyzing, we construct a discrete dynamical system model of time for the amount of methylmercury that will bioaccumulate in the average adult person. Then we can obtain the maximum amount of methylmercury the average adult human will bioaccumulate in their lifetime. At the same time, we can also get the time that people have taken to achieve the maximum amount of methylmercury . As we know, different countries and districts have different criterions for the mercury toxicity . In our case, we adopt the criterion of Keller Army Community Hospital. If the maximum amount of methylmercury in human body is far less than the safe criterion, we can reach the conclusion that the reservoir is not polluted by mercury or the polluted degree is very low, otherwise we can say the reservoir is great polluted by mercury . Finally, the degree of pollution is determined by the amount of methylmercury in human body .Problem Onediscrete dynamical system modelThe mean value of methylmercury in bass samples of the Neversink Reservoir is 1300 ug/kg and the average weight of bass is 0.7 kg. According to the subject, people consume no more than one fish per month. For the safety of people, we must consider the bioaccumulation of methylmercury under the worst condition that people absorb the maximum amount of methylmercury . Therefore, we assume that people consume one fish per month.Assumptions● The amount of methylmercury in fish is absorbed completely and instantly bypeople.● The elimination of mercury is proportional to the amount remaining.● People absorb fixed amount of methylmercury at fixed term per month. ● We assume the half-life of methylmercury in human body is 69.3 days. SolutionsLet 1α denote the proportion of eliminating methylmercury per month, 1β denote the accumulation proportion. As we know, methylmercury decays about 50 percent every 65 to 75 days, if no further methylmercury is ingested during that time. Consequently ,111,βα=-69.3/3010.5.β=Through calculating, we get10.7408.β=L et’s define the following variables :ω denotes the amount of methylmercury at initial time, n denotes the number of month,n ω denotes the amount of methylmercury in human body at the moment people have just ingested the methylmercury in the month n ,1x denotes the amount of methylmercury that people ingest per month and113000.7910x ug ug=⨯=. Moreover, we assume0=0.ωThough,111,n n x ωωβ-=⋅+we get1011x ωωβ=⋅+2201111x x ωωββ=⋅+⋅+ ⋅⋅⋅10111111n n n x x x ωωβββ-=⋅+⋅+⋅⋅⋅+⋅+121111(1)n n n x ωβββ--=++⋅⋅⋅++⋅11111.1n n x βωβ--=-With the remaining amount of methylmercury increasing, the elimination of methylmercury is also going up. We know the amount of ingested methylmercury per mouth is a constant. Therefore, with time going by, there will be a balance between absorption and elimination. We can obtain the steady-state value of remaining methylmercury as n approaches infinity.1*1111111lim 3505.11n n n x x ug βωββ-→∞-===--The value of n ω is shown by figure 1.Figure 1. merthylmercury completely coming from fish and ingested at fixed term per monthIf the difference of the remaining methylmercury between the month n and 1n - is less than five percent of the amount of methylmercury that people ingest per month, that is,115%.n n x ωω--<⋅Then we can get11=3380ug.ωAt the same time, we can work out the time that people have taken to achieve 3380 ug is 11 months.From our model, we reach the conclusion that the maximum amount of methylmercury the average adult human will bioaccumulate in their lifetime is 3505 ug.If people ingest methylmercury every half of a month, however, the sum of methylmercury ingested per month is constant, consequently,11910405,0.86.2x ug β===As a result, we obtain the maximun amount of methylmercury in human body is 3270ug. When the difference is within 5 %, we get the time people have taken to achieve it is 11 months.Similarly, if people ingest methylmercury per day , we get the maximum amount is 3050ug, and the time is 10 months.Revising ModelAs a matter of fact, the amount of methylmercury in human body is not completely coming from fish. According to the research of Hong Kong SAR Food andEnvironmental Hygiene Department [1], under normal condition, about 76 percent of methylmercury comes from fish and 24 percent comes from other seafood. In order to make our model more and more in line with the actual situation, it is necessary for us to revise it. The U.S. environmental Protection Agency (USEPA) set the safe monthly dose for methylmercury at 3 microgram per kilogram (ug/kg) of body weight. If we adopt USEPA criterion, we can calculate the amount of methylmercury that the average adult ingest from seafood is 50.4 ug per month.Assumptions● The amount of methylmercury in the seafood is absorbed completely andinstantly by people.● The elimination of methylmercury is proportional to the amount remaining. ● People ingest fixed amount of methylmercury from other seafood every day . ● We assume the half-life of methylmercury in human body is 69.3 days. SolutionsLet 0ωdenote the amount of methylmercury at initial time, t denote the number of days, t ω denote the remaining amount on the day t , and 2x denote theamount of methylmercury that people ingest per day . Moreover, we assume0=0.ωIn addition, we work out2x =50.4/30=1.68 ug.The proportion of remaining methylmercury each day is 2β, then69.320.5.β=Through calculating, we get20.99.β=Because of12221,1t t x βωβ--=- we obtain steady-state value of methylmercury1*2222211lim 168.11t t t x x ug βωββ-→∞-===--If the difference of remaining methylmercury between the day t and 1t - is less than five percent of the amount of methylmercury that people ingest every day, that is,125%.t t x ωω--<⋅We have301= 160 ug.ωSo we can reach the conclusion that the maximum amount of methylmercury the average adult human will bioaccumulate from seafood is 160 ug and the time that people take to achieve the maximum is 301 days.Let 1x denote the amount of methylmercury people ingest through bass at fixedterm per month, so the amount of methylmercury an average adult accumulate on the day t is1221221if t is a positive integer and not divisible by 30if t is a positive integer and divisible by 30.t t t t x x x ωωβωωβ--=⋅+⎧⎨=⋅++⎩ The value of t ωis shown by figure 2.Figure 2. merthylmercury coming from fish and other seafood and ingested at fixed term per dayThe change of t ω reflects the change of the amount of methylmercury inhuman body . Through revising model, we can figure out the maximum amount of methylmercury the average adult human will bioaccumulate in their lifetime is 3679 ug.Problem TwoRandom-ingestion modelAlthough people consume one fish per month, the consuming time has great randomness. We speculate the randomness has effect on the bioaccumulation of methylmercury , therefore, we construct a new model.AssumptionsThe amount of methylmercury in fish is absorbed completely and instantly bypeople.● The elimination of methylmercury is proportional to the amount remaining. ● People consume one fish per month, but the consuming time has randomness. ● We assume the half-life of methylmercury in human body is 69.3 days.Let 0L denote the amount of methylmercury at initial time, n L denote theamount of methylmercury at the moment people have just ingested methylmercury in the month n , and x denote the amount of methylmercury that people absorb each time.We assume0=0.LWe have910.x ug =We define 1β the proportion of remaining methylmercury every day .Through69.310.5,β=we can get10.99.β=Let i obey discrete uniform random distribution with maximum 30 and minimum 1 and n t denote the number of days between the day1n i - of the month 1n - and the day n i of the month n , then we have-130-,n n n t i i =+(1)1.n tn n L L x β-=⋅+ The value of n L is shown by figure 3.Figure 3. merthylmercury completely coming from fish and ingested at random per monthFigure 3 shows the amount of methylmercury in human body has a great change due to the randomness of consuming time. Through the computer simulation, if we have numberless samples, n L will achieve the maximum value.That is,4261.n L ug =Revising modelIn order to make our model more accurate, we need to make further revise. We take methylmercury coming from other seafood into consideration. We know the amount of methylmercury that people ingest from other seafood every day is 1.68 ug.In that situation, we have1212.30(-1)30(-1)n n n n n n L L x if n n i L L x x if n n i ββ=⋅+≠⨯+⎧⎨=⋅++=⨯+⎩ Through the computer simulation, we can get a set of data about n L shown by figure4.Figure 4. remaining merthylmercury coming from fish consumed at random per month and otherfood consumed at fixed term per dayThough the revised model, we reach the conclusion that if we have numberless samples, n L will achieve the maximum value.That is,4420.n L ug =Variable-eliminateion modelAs a matter of fact, the state of human health can affect metabolice rate so that the ability of eliminating methylmercury is not constant. We have koown the amount of methylmercury in human body will affect human health. So we can draw the conclusion that the amount of methylmercury in human body will affect the abilitity of eliminating methylmercury .Assumptions● The amount of methylmercury in fish is absorbed completely and instantly bypeople.● the elimination of methylmercury is not only proportional to the amountremaining, but also affected by the change of human health which are caused by the amount of methylmercury .● People absorb fixed amount of methylmercury at fixed term per month throughconsuming bass.● We assume the half-life of methylmercury in human body is 69.3 days.● In condition that no further methylmercury is ingested during a period of time, welet χ denote the eliminating proportion per month. We have known methylmercury decays about 50 percent every other day 5 to a turn 5 days, so we determine the half-life of methylmercury in human body is 69.3 days. Then we have69.3/301(1)0.5χ⋅-=. By calculating, we getχ=0.2592.We adopt LD50 as the toxic criterions, then we get the maximum amount ofmethylmercury in human body is 63.510⨯ ug. L et’s define the following variables :ω denotes the amount of methylmercury at initial time,ndenotes the number of month,nω denotes the amount of methylmercury in human body at the moment people have just ingested the methylmercury in the monthn,n χ denotes the ability of eliminating methylmercury in the month n . γ denotes the effect on human health caused by methylmercury toxicity .1161 3.510r n n ωχχ-⎛⎫⎡⎤=⋅- ⎪⎢⎥ ⎪⨯⎣⎦⎝⎭1(1)n n n ωωχϕ-=⋅-+Hence, we have101(1)ωωχϕ=⋅-+20212(1)(1)(1)ωωχχϕχϕ=⋅-⋅-+⋅-+[]01233(1)...(1)(1)(1)...(1)(1)...(1)...(1)1n n n n n ωωχχϕχχχχχχ=⋅--+⋅-⋅--+--++-+We define the value of γ is 0.5, then we get the maximum amount of maximum in human body is 3567 ug, that is,*=3567 ug n ωNot taking the effect on the ability of eliminating maximum caused by methylmercury toxicity into account in model one,we obtain the maximum amount is 3510 ug. The difffference proves methylmercury toxicity has effect on eliminating methylmercury . We find out through calculating when r increases, the amount of methylmercury go up correspondingly. The reason for it is that methylmercurytoxicity rises as a result of r increasing. Correspondingly, the effect on human health will increase, which is in accordance with fact.Problem ThreeAccording to the first model revised, we can get the maximum amount of bioaccumulation methylmercury is 3679 ug. We assume the average weight of an adult is 70 kg and the amount of methylmercury in human body is 53 ug/kg, far less than 50 mg/kg. Therefore, according to our model, the fish consumption restrictions put forward by the reservoir advisories can protect the average adult from reaching the LD50(LD50 is the dosage at which 50% of the humans exposed to a particular chemical will die. The LD50 for methylmercury is 50 mg/kg).We assume the lethal dosage of methylmercury is not gradually increasing. If the amount of methylmercury people ingests goes up rapidly , the bioaccumulation amount will reach to a higher value. Moreover, the value probably endangers human safety . Let LD50 be the maximum amount of methylmercury in human body , that is,*n =50 m g/kg 70 kg=3500 m g.ω⨯Let 1x denote the amount of methylmercury people ingest per month. According to the first model,1*1111111lim.11n n n x x βωββ-→∞-==--We can figure out1 x =907.2 m g.We know the mean value of methylmercury in bass samples is 1.3 mg/kg, hence, we can obtain the maximum amount of fish that people consume safely per month is1m ax 698.1.3x M kg =≈The maximum number of fish is 698/0.7=997.ConclusionIn problem one, the paper calculates the final steady-state value at the same time interval per month, per half a month and per day . Through comparing the results, we get the final bioaccumulation amount of methylmercury is less, when discrete time unit is smaller. It shows when the interval of consuming fish is smaller and the sum of methylmercury ingested is constant for a period of time, the possibility of poisoning is lower.In problem two, we analyze the change of the amount of methylmercury under the condition that consuming time is random. We find out the amount o f methylmercury in human body is changing constantly in fixed range, when people have just consumed fish. Moreover, the maximum is 4261 ug, which is far bigger than3505 ug. So we can reach the conclusion that people are more endangered when the consuming time is irregular.In order to closer to the actual situation, we construct a model in which the half-life of methylmercury in human body is not constant. Through analyzing the data of computer simulation, the maximum amount of methylmercury will increase, that is, the risk of poisoning will be higher.References[1] Dr.D.N.Rahni, PHD. Airborne Mercury Contamination and the NeversinkReservoir./dnabirahni/rahnidocs/Envsc/Airborne%20Mercury%20C ontamination%20and%20the%20Neversink%20Reservoir.doc[2] Hu Dong Bai Ke. Bass. /wiki%E9%B2%88%E9%B1%BC.[3] Centre for Food Safety Food and Environmental Hygiene Department TheGovernment of the Hong Kong Special Administrative Region. Mercury in Fish and Food Safety..hk/english/Programmme/programme_rafs/Programme_rafs_fc _01_19_mercury_in_fish.html.。
2012 National English Contest for College Students(Level C - Preliminary)参考答案及作文评分标准Part I Listening Comprehension (30 marks)Section A (5 marks)1—5 CBBAC Section B (10 marks)6—10 BAACB 11—15 CABCBSection C (5 marks)16—20 ACABA Section D (10 marks)21. disruption 22. air pressure 23. slow down 24.immune system 25.stimulates 26. bear in mind 27. circulation 28. decreases 29. Consult 30. side effects Part II Vocabulary and Structure (15 marks)31—35 BDABC 36—40 BDDAB 41—45 CADBCPart III Cloze (10 marks)46. likelihood 47. fortune 48. take 49. with 50. knowing51. dozens 52. least 53. burning 54.easy/simple 55. realizePart IV Reading Comprehension (40 marks) Section A (10 marks)56. describe 57. opportunity 58. honeymoon 59. transition 60. characterized Section B (10 marks)61. F 62. T 63. T64. The special depth that true friendship is about.65. They need to get over fear of confrontation and rejection. Section C (10 marks)66. High fatality 67. thrill seeking; risk taking 68. pushing out personal boundaries 69. C 70. A Section D (10 marks)71.“Linguistic”intelligence and“Logical mathematical”intelligence.72. The ability to gauge one's own mood, feelings and mental states, and the ability to gauge it in others and use the information.73.“Logical mathematical”intelligence and the“bodily-kinesthetic”intelligence.74. 他的观点引发了激烈的讨论,应如何定义智力。
PROBLEM B: Camping along the Big Long River
问题B:沿着大长河露营
Visitors to the Big Long River (225 miles) can enjoy scenic views and exciting white water rapids. 游客到大长河(225英里)可以享受风景和令人兴奋的白色水急流。
The river is inaccessible to hikers, so the only way to enjoy it is to take a river trip that requires
河是徒步旅行者无法进入的,所以唯一享受它的方法是采取河之旅,需要几天的露营several days of camping. River trips all start at First Launch and exit the river at Final Exit, 225
河旅行都开始在第一次启动和退出河在最后退出,225英里下游。
miles downstream. Passengers take either oar- powered rubber rafts, which travel on average 4
乘客乘橡皮艇桨驱动平均每小时4英里,或摩托艇,平均每小时8英里的速度行驶。
mph or motorized boats, which travel on average 8 mph. The trips range from 6 to 18 nights of
旅程从开始到完成6到18个晚上,
camping on the river, start to finish.. The government agency responsible for managing this river
负责管理这条河的政府机关想要,以最少的接触与其他群体在河的小船,享受荒野之旅。
wants every trip to enjoy a wilderness experience, with minimal contact with other groups of boats on the river. Currently, X trips travel down the Big Long River each year during a six month
×旅行每年在一六个月期间旅行下来,大长江(一年的其余太冷对于河旅行)。
period (the rest of the year it is too cold for river trips). There are Y camp sites on the Big Long
大长河上有Y个露营地,在整个河流廊分布相当均匀。
River, distributed fairly uniformly throughout the river corridor. Given the rise in popularity of river rafting, the park managers have been asked to allow more trips to travel down the river. They 鉴于流行起来的漂流,公园管理人员被要求允许更多的旅行来到河上来旅行。
want to determine how they might schedule an optimal mix of trips, of varying duration (measured in nights on the river) and propulsion (motor or oar) that will utilize the campsites in the best way 他们想确定他们如何可能安排的最佳组合,不同的时间(以夜河)和推进(电机或桨)将利用营地以可能的最佳方式。
possible. In other words, how many more boat trips could be added to the Big Long River’s
换句话说,如何使更多的游船可以被添加到大长河泛舟季节?
rafting season? The river managers have hired you to advise them on ways in which to develop the best schedule and on ways in which to determine the carrying capacity of the river, remembering 河流管理者雇你来指导他们如何在发展最好的安排和方法,确定承载力的河流,
that no two sets of campers can occupy the same site at the same time. In addition to your one
记住,没有两支露营队可以在同一时间占据相同的露营地。
page summary sheet, prepare a one page memo to the managers of the river describing your key findings.除了你的一页表,准备了一一页的备忘录的管理人员的描述你的调查结果。
问题:露营沿大长河
游客到大长河(225英里)可以享受风景和令人兴奋的白色水急流。
河是徒步旅行者无法进入的,所以唯一享受它的方法是采取河之旅,需要几天的露营。
河旅行都开始在第一次启动和退出河在最后退出,225英里下游。
乘客乘橡皮艇桨驱动,而旅行的平均每小时4英里或摩托艇,平均每小时8英里的速度行驶。
车次范围从6到18个晚上露营的河流,开始完成。
政府机构负责管理这条河都要享受之旅荒野经验,以最少的接触与其他群体的小船在河。
目前,×旅行旅行下来,大长江每年在一六个月期间(一年的其余太冷河旅行)。
有你的营地在大长河,分布相当均匀在整个河流廊。
鉴于流行起来的漂流,公园管理人员被要求允许更多的去旅行下来河。
他们想确定他们如何可能安排的最佳组合,不同的时间(以夜河)和推进(电机或桨)将利用营地以可能的最佳方式。
换句话说,如何更多的游船可以被添加到大长河泛舟季节?河流管理者雇你来指导他们如何在发展最好的安排和方法,确定承载力的河流,记住,没有设置营可以占据相同的网站在同一时间。
除了你的一页表,准备了一一页的备忘录的管理人员的描述你的调查结果。