雅思线形图
- 格式:ppt
- 大小:2.18 MB
- 文档页数:123

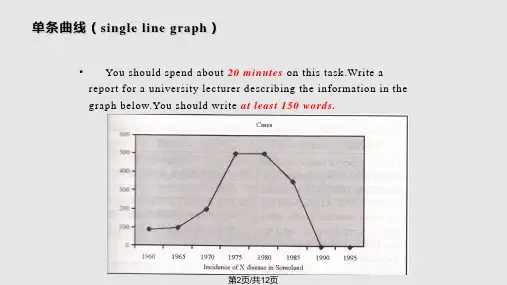
雅思线状图作文范文什么是雅思小作文综合图"说不准的,而且这样去划分对于考试来讲并没有多大的帮助。
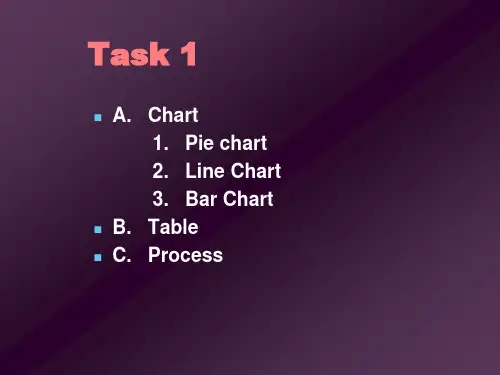
尽管我们习惯地A类小作文分成五大类型,包括线状图(line chart),柱状图(bar chart),饼状图(pie chart),表格图(table of figures),流程/示意图(flow chart/diagram)。
但是在实际操作的时候,我们按照不同的写作方法,更科学地把这五大类图形分成三大种,趋势图(一般指的是展示描述对象随着时间或者年龄的变化而变化的图形),非趋势图(通常是着重数据的列举和比较),非常规图(指的就是流程/示意图,按照以往的经验,这种类型考得比较少。
但是值得指出的是,在今年xx年5月-7月,这种类型居然考了已经5次了)。
也就是说,有些图形,例如,柱状图,既可能是趋势图,也可能是非趋势图,所以说,把小作文分成五大类其实在写作方法的角度来说是不合理的。
所以我建议楼主不要纠结哪种图形考得比较多哪种考得比较少了,哈哈,按照以上给的方法来准备会发现更有效哦。
奖励都没有~大家怎么忍心花费那么多时间帮你啊~我还没来得及选奖励呢,谁要是答好了就给谁大奖好吧~希望楼主采纳哈~如果可取给我分哈~O(∩_∩)O~与Task2不同,Task1末尾其实不需要加一段单独的结论,因为Task1 是让我们来描述一个图表的,并不需要用一句话做出结论或评论,简单的说就是不能加上自己主观的评论,像什么根据这可以看出……,或由此可见未来的发展趋势……,如果写了这样的总结,你的得分一定会降低。
如果线状图有多条曲线(这是大多数情况),你可以在结尾最他们进行比较,重点突出比较他们的比较明显的不同之处(差异最大的地方)。
如果你在上文中已经对比过了,那就建议不用写结尾了,,否则会显得多此一举,考官会认为你在凑字数,反而会降低你的分数。
如果要写结尾,切记不要写关于自己的主观评论和想像!!最后祝楼主考得好成绩!!O(∩_∩)O~第一段您可以改写题目,例如:The bar chart describes ......while the line graph illustrates... .第二段:写柱状图。

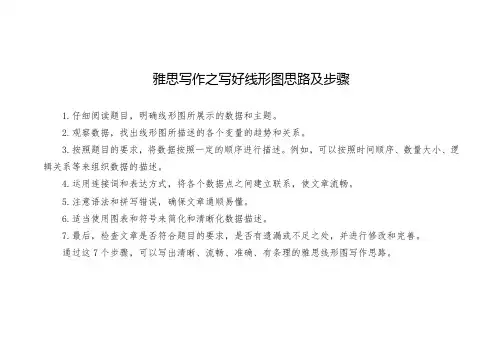
雅思写作之写好线形图思路及步骤
1.仔细阅读题目,明确线形图所展示的数据和主题。
2.观察数据,找出线形图所描述的各个变量的趋势和关系。
3.按照题目的要求,将数据按照一定的顺序进行描述。
例如,可以按照时间顺序、数量大小、逻辑关系等来组织数据的描述。
4.运用连接词和表达方式,将各个数据点之间建立联系,使文章流畅。
5.注意语法和拼写错误,确保文章通顺易懂。
6.适当使用图表和符号来简化和清晰化数据描述。
7.最后,检查文章是否符合题目的要求,是否有遗漏或不足之处,并进行修改和完善。
通过这7个步骤,可以写出清晰、流畅、准确、有条理的雅思线形图写作思路。
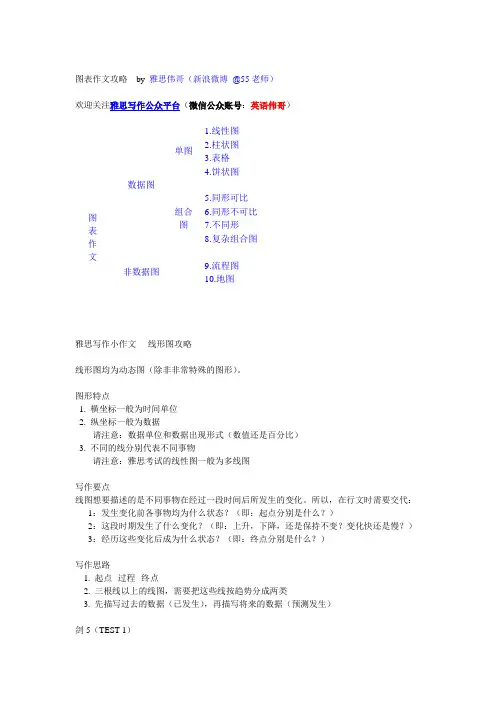
图表作文攻略by 雅思伟哥(新浪微博@55老师)欢迎关注雅思写作公众平台(微信公众账号:英语伟哥)图表作文数据图单图1.线性图2.柱状图3.表格4.饼状图组合图5.同形可比6.同形不可比7.不同形8.复杂组合图非数据图9.流程图10.地图雅思写作小作文----线形图攻略线形图均为动态图(除非非常特殊的图形)。
图形特点1. 横坐标一般为时间单位2. 纵坐标一般为数据请注意:数据单位和数据出现形式(数值还是百分比)3. 不同的线分别代表不同事物请注意:雅思考试的线性图一般为多线图写作要点线图想要描述的是不同事物在经过一段时间后所发生的变化。
所以,在行文时需要交代:1:发生变化前各事物均为什么状态?(即:起点分别是什么?)2:这段时期发生了什么变化?(即:上升,下降,还是保持不变?变化快还是慢?)3:经历这些变化后成为什么状态?(即:终点分别是什么?)写作思路1. 起点--过程--终点2. 三根线以上的线图,需要把这些线按趋势分成两类3. 先描写过去的数据(已发生),再描写将来的数据(预测发生)剑5(TEST 1)The graph below shows the proportion of the population aged 65 and over between 1940 and 2040 in the tree different countries.The graph shows the increase in the ageing population in Japan, Sweden and the USA.(开头介绍句)It indicates that the percentage of elderly people in all three countriesis expected to increase to almost 25% of the respective populations by the year 2040.(OVERVIEW)In 1940 the proportion of people aged 65 or more stood at only 5% in Japan,approximately 7% in Sweden and 9% in the US. (起点描述)However, while thefigures for western countries grew to about 15% in around 1990, the figure for Japandipped to only 2.5% for much of this period, before rising to almost 5% again at thepresent time.(过程描述-过去数据)In spite of some fluctuation in the expected percentages, the proportion of olderpeople will probably continue to increase in the next two decades in the threecountries. A more dramatic rise is predicted between 2030 and 2040 in Japan,(过程描述-将来数据)by which time it is thought that the proportion of elderly people willbe similar in the three countries.(终点描述)剑7(TEST 2)The graph below shows the consumption of fish and some different kinds of meat in a European country between 1979 and 2004.The graph illustrates changes in the amounts of beef, lamb, chicken and fish consumed in a particular European country between 1979 and 2004.(开头句)In 1979, beef was by far the most popular of these foods, with about 225 grams consumed per person per week. Lamb and chicken were eaten in similar quantities (around 150 grams), while much less fish was consumed (just over 50 grams). (起点描述)However, during this 25-year period the consumption of beef and lamb fell dramatically to approximately 100 grams and 55 grams respectively. The consumption of fish also declined, but much less significantly to just below 50 grams, so although it remained the least popular food, consumption levels were the most stable.(过程描述--下降类)The consumption of chicken, on the other hand, showed an upward trend, overtaking that of lamb in 1980 and that of beef in 1989. By2004 it had soared to almost 250grams per person per week.(过程描述--上升类)Overall, the graph shows how the consumption of chicken increased dramatically while the popularity of these other foods decreased over the period. (OVERVIEW)。
雅思小作文线形图技巧雅思小作文线形图技巧相信很多参加过雅思考试的学员都会认为小作文要比大作文要难写,认为小作文很难写得出彩。
根据多年的教学经验,主要原因是他们的句型都过于单一。
其实要想让小作文写得好,也并非就是一件很难的事情。
今天店铺就来教大家一个帮助大家提高折线图表达的技巧。
在介绍技巧之前,请大家对比一下关于描述电视机观众人数变化的一个折线图5.5分的考生例文和6.5分高分范文的节选片段。
5.5分考生例文:at 6 a.m., the proportion of TV viewers was much lower than that of radio listeners, with only 2%. After that, it increased with fluctuation and overtook that of radio listeners at 12.40, with 15%. Then it continued to ascend until it reached a peak at 45% at 8 p.m., when it started to drop, before it levelled off between 2 a.m. and 5 a.m.6.5分高分范文:At 6 a.m., the percentage of TV viewers was only 2%. during the next 8 hours, it showed a gradual upward trend and outnumbered the figure of radio listeners. Then, it rose continuously and peaked at 45% at 8p.m.. After there was a considerable decline until 2 a.m. in the next morning, it levelled off at 2% in the last few hours.对比了两篇文章之后,我们很容易发现考生例文中,整个文章句型基本上都是主谓宾句型,尽管这位学员注意到了词汇的多样性。

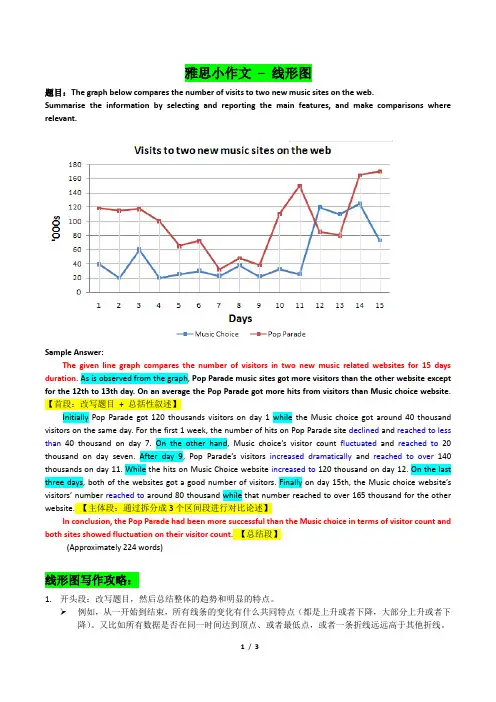
雅思小作文– 线形图题目:The graph below compares the number of visits to two new music sites on the web.Summarise the information by selecting and reporting the main features, and make comparisons where relevant.Sample Answer:The given line graph compares the number of visitors in two new music related websites for 15 days duration. As is observed from the graph, Pop Parade music sites got more visitors than the other website except for the 12th to 13th day. On an average the Pop Parade got more hits from visitors than Music choice website.【首段:改写题目+ 总括性叙述】Initially Pop Parade got 120 thousands visitors on day 1 while the Music choice got around 40 thousand visitors on the same day. For the first 1 week, the number of hits on Pop Parade site declined and reached to less than 40 thousand on day 7. On the other hand, Music choice’s visitor count fluctuated and reached to20 thousand on day seven. After day 9, Pop Parade’s visitors increased dramatically and reached to over140 thousands on day 11. While the hits on Music Choice website increased to 120 thousand on day 12. On the last three days, both of the websites got a good number of visitors. Finally on day 15th, the Music choice website’s visitors’ number reached to around 80 thousand while that number reached to over 165 thousand for the other website. 【主体段:通过拆分成3个区间段进行对比论述】In conclusion, the Pop Parade had been more successful than the Music choice in terms of visitor count and both sites showed fluctuation on their visitor count.【总结段】(Approximately 224 words)线形图写作攻略:1.开头段:改写题目,然后总结整体的趋势和明显的特点。