曼昆哈佛大学经济学原理第二章
- 格式:ppt
- 大小:249.51 KB
- 文档页数:36
曼昆经济学原理(双语)带你读《经济学原理》,每日更新,欢迎来主页查看。
翻译部分经本人校对修改,本文仅供学习交流使用,版权归相关权利人所有!第二章像经济学家一样思考2.102-2c Why Economists’ Advice Is Not Always Followed2-2c 为何经济学家的意见并非总能被采纳Any economist who advises presidents or other elected leaders knows that his recommendations are not always heeded. Frustrating as this can be, it is easy to understand. The process by which economic policy is actually made differs in many ways from the idealized policy process assumed in economics textbooks.任何为总统或其他民选领导人提供建议的经济学家都知道,他的建议并不总是得到重视。
虽然这可能令人沮丧,但很容易理解。
实际制定经济政策的过程与经济学教科书中所设想的理想化政策过程在许多方面有所不同。
Throughout this text, whenever we discuss economic policy, we often focus on one question: What is the best policy for the government to pursue? We act as if policy were set by a benevolent king. Once theking figures out the right policy, he has no trouble putting his ideas into action.纵观全文,每当我们讨论经济政策时,我们往往会集中在一个问题上:政府寻求的最佳政策是什么?我们的做法就好像政策是由仁慈的国王制定的。
曼昆经济学原理(双语)带你读《经济学原理》,每日更新,欢迎来主页查看。
翻译部分经本人校对修改,本文仅供学习交流使用,版权归相关权利人所有!第二章像经济学家一样思考2.82-2 The Economist as Policy Adviser作为决策者的经济学家Often, economists are asked to explain the causes of economic events. Why, for example, is unemployment higher for teenagers than for older workers? Sometimes, economists are asked to recommend policies to improve economic outcomes. What, for instance, should the government do to improve the economic well-being of teenagers? When economists are trying to explain the world, they are scientists. When they are trying to help improve it, they are policy advisers.人们经常要求经济学家解释一些经济事件的原因。
例如,为什么年轻人的失业高于年龄大一些的人?有时也要求经济学家提出改善经济结果的政策建议。
例如,政府应该为改善年轻人的经济福利做些什么?当经济学家努力去解释世界时,他们是科学家。
当经济学家想要改善世界时,他们是决策者。
2-2a Positive versus Normative Analysis实证分析与规范分析To help clarify the two roles that economists play, let’s examine the use of language. Because scientists and policy advisers have different goals, they use language in different ways. For example, suppose that two people are discussing minimum-wage laws. Here are two statements you might hear:Polly: Minimum-wage laws cause unemployment.Norma: The government should raise the minimum wage.为了有助于弄清楚经济学家所起的这两种作用,我们从考察语言的使用开始。
曼昆经济学原理(双语)带你读《经济学原理》,每日更新,欢迎来主页查看。
翻译部分经本人校对修改,本文仅供学习交流使用,版权归相关权利人所有!第二章像经济学家一样思考2.6Our Second Model: The Production Possibilities Frontier我们的第二个模型:生产可能性边界Most economic models, unlike the circular-flow diagram, are built using the tools of mathematics. Here we use one of the simplest such models, called the production possibilities frontier, to illustrate some basic economic ideas.与循环流向图不同,大多数经济模型都是用数学工具来建立的。
这里我们考虑一个最简单的这类模型,这个模型称为生产可能性边界,并运用这个模型去阐明一些基本经济思想。
Although real economies produce thousands of goods and services, let’s consider an economy that produces only two goods—cars and computers. Together, the car industry and the computer industry use all of the economy’s factors of production. The production possibilities frontieris a graph that shows the various combinations of output—in this case, cars and computers— that the economy can possibly produce given the available factors of production and the available production technology that firms use to turn these factors into output.虽然现实世界生产成千上万种物品与劳务,但我们设想一个只生产两种物品——汽车与电脑——的经济。
曼昆《经济学原理(微观经济学分册)》第6版课后习题详解第一篇导言第1章经济学十大原理一、概念题1.稀缺性稀缺性是指在给定的时间内,相对于人的需求而言,经济资源的供给总是不足的,也就是资源的有限性与人类的欲望无限性之间的矛盾。
2.经济学经济学是研究如何将稀缺的资源有效地配置给相互竞争的用途,以使人类的欲望得到最大限度满足的科学。
其中微观经济学是以单个经济主体为研究对象,研究单个经济主体面对既定资源约束时如何进行选择的科学;宏观经济学则以整个国民经济为研究对象,主要着眼于经济总量的研究。
3.效率效率是指人们在实践活动中的产出与投入比值或者是效益与成本比值,比值大效率高,比值小效率低。
它与产出或收益大小成正比,与投入或成本成反比。
4.平等平等是指人与人的利益关系及利益关系的原则、制度、做法、行为等都合乎社会发展的需要,即经济成果在社会成员中公平分配的特性。
它是一个历史范畴,按其所产生的社会历史条件和社会性质的不同而不同,不存在永恒的公平;它也是一个客观范畴,尽管在不同的社会形态中内涵不同对其的理解不同,但都是社会存在的反映,具有客观性。
5.机会成本机会成本是指将一种资源用于某种用途,而未用于其他用途所放弃的最大预期收益。
其存在的前提条件是:①资源是稀缺的;②资源具有多种用途;③资源的投向不受限制。
6.理性人理性人是指系统而有目的地尽最大努力去实现其目标的人,是经济研究中所假设的、在一定条件下具有典型理性行为的经济活动主体。
7.边际变动边际变动是指对行动计划的微小增量调整。
8.激励激励是指引起一个人做出某种行为的某种东西。
9.市场经济市场经济是指由家庭和企业在市场上的相互交易决定资源配置的经济,而资源配置实际上就是决定社会生产什么、生产多少、如何生产以及为谁生产的过程。
10.产权产权是指个人拥有并控制稀缺资源的能力,也可以理解为人们对其所交易东西的所有权,即人们在交易活动中使自己或他人在经济利益上受益或受损的权力。
曼昆《经济学原理(微观经济学分册)》(第6版)第2章像经济学家一样思考课后习题详解跨考网独家整理最全经济学考研真题,经济学考研课后习题解析资料库,您可以在这里查阅历年经济学考研真题,经济学考研课后习题,经济学考研参考书等内容,更有跨考考研历年辅导的经济学学哥学姐的经济学考研经验,从前辈中获得的经验对初学者来说是宝贵的财富,这或许能帮你少走弯路,躲开一些陷阱。
以下内容为跨考网独家整理,如您还需更多考研资料,可选择经济学一对一在线咨询进行咨询。
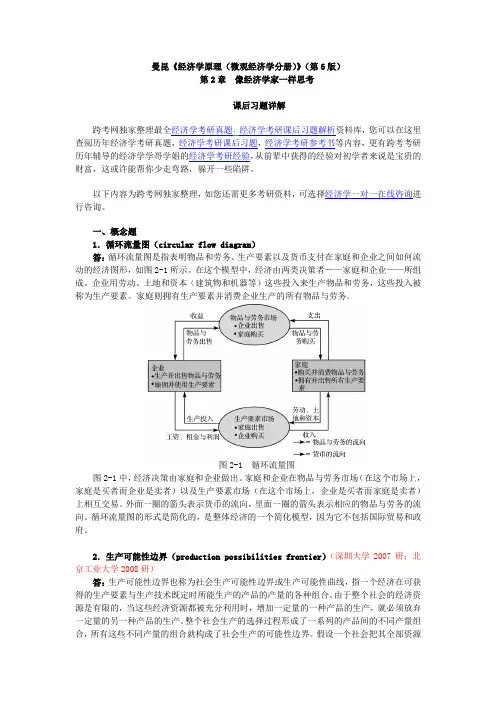
一、概念题1.循环流量图(circular flow diagram)答:循环流量图是指表明物品和劳务、生产要素以及货币支付在家庭和企业之间如何流动的经济图形,如图2-1所示。
在这个模型中,经济由两类决策者——家庭和企业——所组成。
企业用劳动、土地和资本(建筑物和机器等)这些投入来生产物品和劳务,这些投入被称为生产要素。
家庭则拥有生产要素并消费企业生产的所有物品与劳务。
图2-1 循环流量图图2-1中,经济决策由家庭和企业做出。
家庭和企业在物品与劳务市场(在这个市场上,家庭是买者而企业是卖者)以及生产要素市场(在这个市场上,企业是买者而家庭是卖者)上相互交易。
外面一圈的箭头表示货币的流向,里面一圈的箭头表示相应的物品与劳务的流向。
循环流量图的形式是简化的,是整体经济的一个简化模型,因为它不包括国际贸易和政府。
2.生产可能性边界(production possibilities frontier)(深圳大学2007研;北京工业大学2008研)答:生产可能性边界也称为社会生产可能性边界或生产可能性曲线,指一个经济在可获得的生产要素与生产技术既定时所能生产的产品的产量的各种组合。
由于整个社会的经济资源是有限的,当这些经济资源都被充分利用时,增加一定量的一种产品的生产,就必须放弃一定量的另一种产品的生产。
整个社会生产的选择过程形成了一系列的产品间的不同产量组合,所有这些不同产量的组合就构成了社会生产的可能性边界。

E conomics Principles ofN. Gregory MankiwThinking Likean EconomistSeventh EditionCHAPTER 2 W o j c i e c h (G e r s o n ((183111901)(W o j c i e c h (G e r s o n ((183111901)(In this chapter,look for the answers to these questions • What are economists’ two roles? How do they differ? • What are models? How do economists use them? • What are the elements of the Circular-Flow Diagram? What concepts does the diagram illustrate?• How is the Production Possibilities Frontier relatedto opportunity cost? What other concepts does it illustrate?• What is the difference between microeconomics andmacroeconomics? Between positive and normative?The Economist as Scientist! Economists play two roles:1. Scientists: try to explain the world2. Policy advisors: try to improve it! In the first, economists employ thescientific method,the dispassionate development and testing of theories about how the world works.3Assumptions & Models! Assumptions simplify the complex world,make it easier to understand.! Example: To study international trade,assume two countries and two goods.Unrealistic, but simple to learn andgives useful insights about the real world.! Model: a highly simplified representation ofa more complicated reality.Economists use models to study economic issues.4Our First Model:The Circular-Flow Diagram! The Circular-Flow Diagram: a visual model of the economy, shows how dollars flow through markets among households and firms! Two types of “actors”:! households! firms! Two markets:! the market for goods and services! the market for “factors of production”9Factors of Production! Factors of production: the resources the economy uses to produce goods & services, including! labor! land! capital (buildings and machines used inproduction)10Households:! Own the factors of production,sell/rent them to firms for income! Buy and consume goods & services FirmsHouseholds Firms:! Buy/hire factors of production,use them to produce goodsand services! Sell goods & services11Markets for Factors of Production HouseholdsFirms Markets for Goods & ServicesOur Second Model:The Production Possibilities Frontier ! The Production Possibilities Frontier (PPF): a graph that shows the combinations oftwo goods the economy can possibly produce given the available resources and the available technology! Example:! Two goods: computers and wheat! One resource: labor (measured in hours)! Economy has 50,000 labor hours per monthavailable for production.13A C T I V E L E A R N I N G1Points off the PPFA.On the graph, find the point that represents(100 computers, 3000 tons of wheat), label it F.Would it be possible for the economy to produce this combination of the two goods?Why or why not?B.Next, find the point that represents(300 computers, 3500 tons of wheat), label it G.Would it be possible for the economy to producethis combination of the two goods?The PPF: What We Know So Far Points on the PPF (like A – E)! possible! efficient: all resources are fully utilizedPoints under the PPF (like F)! possible! not efficient: some resources underutilized(e.g., workers unemployed, factories idle) Points above the PPF (like G)! not possible19The PPF and Opportunity Cost! Recall: The opportunity cost of an itemis what must be given up to obtain that item.! Moving along a PPF involves shifting resources (e.g., labor) from the production of one good to the other.! Society faces a tradeoff: Getting more of one good requires sacrificing some of the other.! The slope of the PPF tells you the opportunity cost of one good in terms of the other.20Economic growth shifts the PPF outward.The Shape of the PPF! The PPF could be a straight line or bow-shaped. ! Depends on what happens to opportunity costas economy shifts resources from one industryto the other.! If opp. cost remains constant,PPF is a straight line.(In the previous example, opp. cost of acomputer was always 10 tons of wheat.)! If opp. cost of a good rises as more of the goodis produced, PPF is bow-shaped….25At A, opp. cost of mtn bikes is low.B At B , opp. cost of mtn bikes is high.Why the PPF Might Be Bow-Shaped! So, PPF is bow-shaped when different workers have different skills, different opportunity costs of producing one good in terms of the other.! The PPF would also be bow-shaped when there is some other resource, or mix of resources with varying opportunity costs(E.g., different types of land suited fordifferent uses).29The PPF: A Summary! The PPF shows all combinations of two goods that an economy can possibly produce,given its resources and technology.! The PPF illustrates the concepts oftradeoff and opportunity cost,efficiency and inefficiency,unemployment, and economic growth.! A bow-shaped PPF illustrates the concept of increasing opportunity cost.31Microeconomics and Macroeconomics! Microeconomics is the study of how households and firms make decisions and how they interact in markets.! Macroeconomics is the study of economy-wide phenomena, including inflation, unemployment, and economic growth.! These two branches of economics are closely intertwined, yet distinct—they address different questions.32Summary• As scientists, economists try to explain the world using models with appropriate assumptions. • Two simple models are the Circular-Flow Diagram and the Production Possibilities Frontier.• Microeconomics studies the behavior of consumers and firms, and their interactions in markets. Macroeconomics studies the economy as a whole.• As policy advisers, economists offer advice onhow to improve the world.Graphing: a brief review! Graphs purposes:! Visually express ideas that might be less clear ifdescribed with equations or words! Powerful way of finding and interpreting patterns ! Graphs of a single variable! Pie chart! Bar graph! Time-series graph42Types of Graphs (a)Figure A-1The pie chart in panel (a) shows how the U.S. national income in 2011 was derivedfrom various sources.Figure A-1 Types of Graphs (b)The bar graph in panel (b) compares the 2011 average income in four countries.Types of Graphs (c)Figure A-1The time-series graph in panel (c) shows the productivity of labor in U.S.businesses from 1950 to 2010.Graphing: a brief review! Graphs of two variables: the coordinate system ! Display two variables on a single graph! Scatterplot! Ordered pairs of points! x-coordinate– Horizontal location! y-coordinate– Vertical location46Using the Coordinate SystemGrade point average is measured on the vertical axis and study time on thehorizontal axis. Albert E., Alfred E., and their classmates are represented by variouspoints. We can see from the graph that students who study more tend to get higher grades.Graphing: a brief review! Curves in the coordinate system! Data! Number of novels purchased! Price of novels! Income! Demand curve! Effect of a good s price! On the quantity of the good consumers want tobuy! For a given income48Table A-1Novels Purchased by EmmaThis table shows the number of novels Emma buys at various incomes and prices. For any given level of income, the data on price and quantity demanded can be graphed to produce Emmas demand curve for novels, as shown in Figures A-3 and A-4.Graphing: a brief review! Negatively related variables! The two variables move in opposite direction! Downward sloping curve! Positively related variables! The two variables move in the same direction! Upward sloping curve! Movement along a curve! Shifts in a curve50! Slope! Fairly flat upward-sloping line! Slope is a small positive number! Steep upward-sloping line! Slope is a large positive number! Downward sloping line! Slope is a negative number! Horizontal line! Slope is zero! Vertical line: infinite slope54。
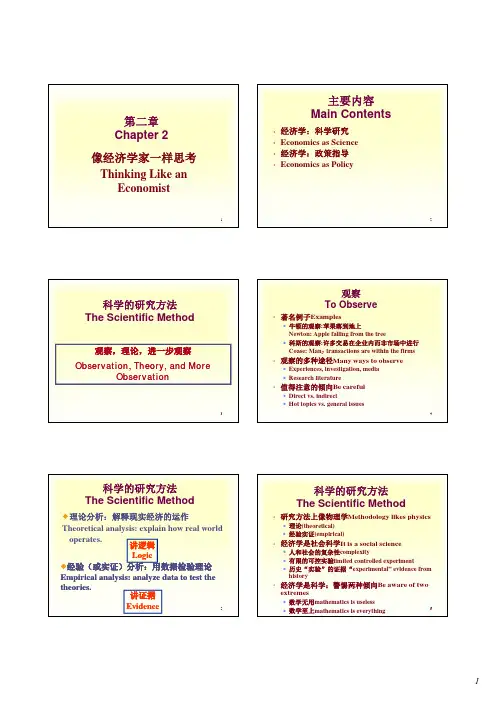
2像经济学家一样思考作为科学家的经济学家试图解释世界科学方法:观察、理论和进一步观察假设与模型假设可以简化复杂的世界,使之更容易理解模型:一个复杂现象的高度简化研究步骤假设、建模、推导、结论经济学中最重要的假设理性人假设模型一:循环流向图一个说明货币如何通过市场在家庭和企业之间流动的直观经济模型生产要素经济体用来生产物品和劳务的各种资源家庭购买并消费物品和劳务拥有并出售生产要素企业生产并出售物品和劳务雇佣并使用生产要素模型二:生产可能性边界表示在可得到的生产要素与生产技术既定时,一个经济所能生产的两种产品数量的各种组合的图形生产可能性边界上的点能够达到有效率生产可能性边界内的点能够达到没有效率生产可能性边界外的点不可能达到可提高技术或加大资源投入生产可能性边界与机会成本机会成本是为了的得到某种东西所必须放弃的东西沿着生产可能性边界移动意味着将资源从一种物品的生产转移到另一种物品的生产中社会面临权衡取舍:得到更多的一种物品需要以更少的另一种物品为代价生产可能性边界的斜率表示我们以一种物品来衡量另一种物品的机会成本生产可能性边界可以是直线或曲线取决于经济将资源从一个行业转向另一个行业时机会成本的变化情况微观经济学研究家庭和企业如何做出决策,以及它们如何在市场上相互交易的学科宏观经济学研究整体经济现象,包括通货膨胀、失业和经济增长的学科作为政策顾问的经济学家尝试改善世界实证表述和规范表述作为科学家,经济学家试图做出关于世界是什么样子的实证表述作为政策顾问,经济学家试图做出关于世界应该是怎么样子的规范表述实证表述能被证实或证伪,但规范表述不能经济学家意见分歧的原因科学判断的不同价值观的不同也有大多数经济学家一致同意的主张。
曼昆经济学原理(双语)带你读《经济学原理》,每日更新,欢迎来主页查看。
翻译部分经本人校对修改,本文仅供学习交流使用,版权归相关权利人所有!第二章像经济学家一样思考2.112-3 Why Economists Disagree为什么经济学家意见分歧“If all economists were laid end to end, they would not reach a conclusion.” This quip from George Bernard Shaw is revealing. Economists as a group are often criticized for giving conflicting advice to policymakers. President Ronald Reagan once joked that if the game Trivial Pursuit were designed for economists, it would have 100 questions and 3,000 answers. Why do economists so often appear to give conflicting advice to policymakers? There are two basic reasons:“如果把所有经济学家聚在一起,他们也得不出一个结论。
”肖伯纳(George Bernard Shaw)的嘲讽溢于言表。
人们经常批评经济学家作为一个群体向决策者提出了相互矛盾的建议。
罗纳德•里根(Ronald Reagan)总统曾经开玩笑地说,如果小追击(Trivial Pursuit)游戏是由经济学家设计的,那么,100个问题会有3000个答案。
为什么经济学家往往给决策者提出了看来相互矛盾的建议呢?这里有两个基本原因:①Economists may disagree about the validity of alternative positive theories of how the world works.经济学家可能不同意关于世界如何运转的其他实证理论的有效性。
2 像经济学家一样思考每个研究领域都有自己的语言和思考方式:数学家谈论公理、积分和向量空间;心理学家谈论自我、本我和认知的不一致性;律师谈论案发现场、侵权行为和约定的禁止翻供。
经济学家也没有什么不同。
供给、需求、弹性、比较优势、消费者剩余和无谓损失等此类术语都是经济学家语言的一部分。
在以后各章节中,你将遇到许多新术语,还会碰上经济家以特定方式使用的一些熟悉的词汇。
乍一年,这种新语言似乎有一种不必要的神秘。
但是,正如你将了解到的,它的价值在于能够为你提供一种关于你所生活的世界的新的、有用的思维方式。
本书惟一一个最重要的目的就是帮助你学会经济学家的思维方式。
当然,正如你不可能在一夜之间成为一个数学家、心理学家或律师一样,学会像经济学家一样思考也需要一些时间。
但本书通过把理论、案例研究和新闻中的经济学事例结合起来,将给你提供充分发展和实践这种技能的机会。
在深入了解经济学的本质和细节之前,综述一下经济学家如何研究这个世界是有帮助的。
因此,本章将讨论这个领域的方法论。
经济学家处理所遇到的问题有何独特之处?像经济学家一样思考是什么意思?2.1作为科学家的经济学家经济学家努力以科学的客观性来探讨他们的主题。
他们研究经济的方法与物理学家研究物质和生物学家研究生命的方法一样:先提出理论、收集数据、分析数据,以努力证明或否定他们的理论。
对初学者来说,声称经济学是门科学似乎有点不可思议。
经济学家毕竟不用试管或望远镜进行研究工作。
但是,科学的本质是科学方法——冷静地建立并检验有关世界如何运行的各种理论。
这种研究方法适用于研究一国经济,就像适用于研究地心引力或生物进化一样。
正如阿尔伯特●爱因斯坦(Albert Einstein)曾经提出的:“所有科学不过是日常思考的提炼而已”。
虽然爱因斯坦的评论对诸如经济学的社会科学和诸如物理学的自然科学同样适用,但许多人并不习惯用科学家的眼光去观察社会。
接下来我们将讨论经济学家运用科学的逻辑来考察经济如何运行的一些方法。
Chapter 2 Thinking Like an EconomistMULTIPLE CHOICEFigure 2-1AB 211. Refer to Figure 2-1.Which shape refers to the markets for goods and services? aa. oval Ab. oval Bc. rectangle 1d. rectangle 22. Refer to Figure 2-1.What is flowing from rectangle 1 to oval A? ba. revenueb. goods and services soldc. factors of productiond. labor, land, and capital3. Refer to Figure 2-1.Which of the following is an activity undertaken by the actors in rectangle 2? ca. produce and sell goods and servicesb. hire and use factors of productionc. own and sell factors of productiond. exchange goods and services between firms and householdsFigure 2-212345678910Consider the production possibilities curve for a country that can produce cars, corn (in bushels), or a combination of the two. 4. Refer to Figure 2-2. If this economy devotes all of its available resources to producing corn, then itwill produce da. 0 bushels of corn and 10 cars.b. 135 bushels of corn and 3 carsc. 160 bushels of corn and 10 cars.d. 160 bushels of corn and 0 cars.5. Refer to Figure 2-2. Which combination of points show production possibilities only achievablewith improvements in technology or increases in resources? da. A, D, and Eb. B and Gc. C and Fd. None of the above is correct.6. Refer to Figure 2-2. If this society moves from point D to point E, da. it gives up 25 bushels of corn to get 3 cars.b. it gives up 135 bushels of corn to get 3 cars.c. it gives up 3 cars to get 135 bushels of corn.d. it gives up 3 cars to get 25 bushels of corn.7. Refer to Figure 2-2. If this society is producing at point C, da. there is unemployment.b. production is efficient.c. growth can only be achieved through an advancement in technology.d. the opportunity cost of producing one more car is approximately 10 bushels of corn.8. Which of the following is a positive, as opposed to a normative, statement? ba. The US Department of Justice should allow a merger between AT&T and T-Mobilebecause it would have little effect on consumers.b. Antitrust laws should be used to prevent further concentration in the wireless telephoneservice market.c. The US Department of Justice sued AT&T to block its merger with T-Mobile.d. The wireless telephone service market is too highly concentrated.9. Which of the following famous people did not major in economics in college? ba. Donald Trumpb. Natalie Portmanc. John Elwayd. Mick Jagger10. Which of the following statements is correct about environmental economists? da. They view economics as a framework for natural resource allocation.b. They work at government agencies as well as universities and advocacy groups.c. They use economic arguments and systems to persuade companies to clean up pollutionand conserve natural resources.d. All of the above are correct.11. In the ordered pair (20, 100), 20 is the aa. x-coordinate.b. y-coordinate.c. scatterplot.d. slope.12. Between the two ordered pairs (20, 100) and (30, 80), the slope is ba. 1/2.b. -1/2.c. 2.d. -2.Figure 2-4snowblowers solds n o w s t o r ms 1020304050607080901234567891013. Refer to Figure 2-4. According to the graph, snowstorms aa. and snowblowers sold are positively correlated.b. and snowblowers sold are negatively correlatedc. and snowblowers sold are uncorrelated.d. are caused by more snowblowers being sold.14. Refer to Figure 2-4.Your friend John created the graph above to illustrate that snowstorms arecaused by more snowblowers being sold. You inform him that his interpretation is incorrect due to aa. omitted variable bias.b. reverse causality.c. slope mismatch.d. shifting versus moving along a curve.15. Refer to Figure 2-4.Which of the following could be an omitted variable in the graph? da. the price of snowblowersb. a change in consumers’ incomesc. a change in the seasonsd. All of the above are correct.PROBLEMFigure 2-1AB 211. Refer to Figure 2-1. What is the name of the model depicted in the figure?The Circular Flow2. Refer to Figure 2-1. What do the ovals represent in the figure?A: Markets for goods and service B: Markets for factors of production 3. Refer to Figure 2-1. What do the rectangles represent in the figure?1:Firms 2:Households4. Refer to Figure 2-1. What do the outer arrows represent in the figure?A to 1:revenue 1 toB :wages,rent, and profit B to 2 income 2 to A :spending 5.Refer to Figure 2-1. What do the inner arrows represent in the figure? A to 2:goods and services bought 2 to B:Labor,land,and capital B to1:Factors of production 1 to A: goods and services sold6. Refer to Figure 2-1. What does the arrow going from oval A to rectangle 2 represent in the figure? A to 2:goods and services bough7. Refer to Figure 2-1. What does the arrow going from oval B to rectangle 2 represent in the figure? B to 2 income 8.Refer to Figure 2-1. What are two elements not included in this figure that could be included in a more complex model? 9. The three main factors of production, or categories of inputs, used by firms to produce goods andservices areFigure 2-212345678910Consider the production possibilities curve for a country that can produce cars, corn (in bushels), or a combination of the two. 10.Refer to Figure 2-2. The bowed outward shape of the production possibilities curve indicates that opportunity cost of corn in terms of cars is 11.Refer to Figure 2-2. Which point(s) on the graph is(are) efficient production possibilities? 12.Refer to Figure 2-2. Which point(s) on the graph show unemployment of resources? 13. Refer to Figure 2-2. Which point(s) on the graph is(are) unattainable given current resources andtechnology?14.Who would be more likely to study the effects of government spending on the unemployment rate, a macroeconomist or a microeconomist? 15.Who would be more likely to study the effects of foreign competition on the accounting industry, a macroeconomist or a microeconomist? 16.Who would be more likely to study the effects of rent control on housing in New York City, a macroeconomist or a microeconomist? 17.Who would be more likely to study the inflation rate in the United States, a macroeconomist or a microeconomist? 18.Is the following a positive or normative statement? The federal minimum wage is lower than many state minimum wages. 19.Is the following a positive or normative statement? The Federal Reserve should set an inflation target and employ policies to meet the target. 20.Is the following a positive or normative statement? The United States government should mandate that every citizen purchases health insurance. 21. Is the following a positive or normative statement? The unemployment rate in Nevada is higher thanthe unemployment rate in New York.10203040506070801234567891022. Refer to Figure 2-3. What are the coordinates of point C?23. Refer to Figure 2-3. How are price and quantity related in this graph?24. Refer to Figure 2-3.What is the slope of the line?25. Refer to Figure 2-3.Is a move from point A to point B considered a shift of the curve or amovement along the curve?。