Minitab帮助基础知识(doc 14页)
- 格式:doc
- 大小:308.50 KB
- 文档页数:13
Minitab培训概述Minitab是一种统计分析软件,被广泛用于数据分析、质量管理和统计过程控制。
通过使用Minitab软件,用户能够快速分析数据、制定决策,并实施质量改良方法。
本文档旨在向用户提供有关Minitab 软件的详细培训,以帮助他们充分利用该软件的功能和特点。
目标通过本次培训,用户将能够掌握以下技能和知识:•Minitab软件的根本操作技巧•数据导入和整理•根本统计分析方法的应用•数据可视化和图表生成•质量管理方法的实践•假设检验和分析结果的解释环境搭建在开始学习和使用Minitab之前,用户需要确保他们的计算机符合以下最低要求:•操作系统:Windows 7或更高版本•内存:至少4GB RAM•硬盘空间:至少2GB可用空间•分辨率:1280x800或更高用户可以从Minitab官方网站上下载安装程序,并按照指示完成安装。
根本操作技巧在本节中,我们将介绍一些常用的Minitab操作技巧,以帮助用户快速上手。
界面导览当用户第一次翻开Minitab时,他们将看到以下几个主要组件:1.菜单栏:包含各种菜单项选择项,提供了许多功能和操作选项。
2.工具栏:包含常用工具按钮,方便用户快速访问某些功能。
3.Session窗口:显示用户的操作历史记录,包括输入的命令和输出结果。
4.Worksheet窗口:用于显示和编辑数据。
5.Graph窗口:用于显示绘图结果。
数据导入和整理在Minitab中导入数据是一个根本的操作。
用户可以从Excel、CSV或其他常见格式的文件中导入数据。
以下是一个简单的步骤例如:1.单击菜单栏中的。


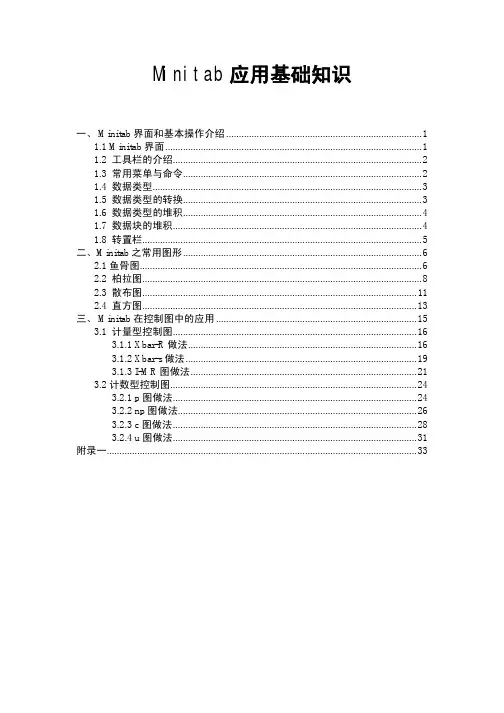
Minitab应用基础知识一、 Minitab界面和基本操作介绍 (1)1.1 Minitab界面 (1)1.2 工具栏的介绍 (2)1.3 常用菜单与命令 (2)1.4 数据类型 (3)1.5 数据类型的转换 (3)1.6 数据类型的堆积 (4)1.7 数据块的堆积 (4)1.8 转置栏 (5)二、Minitab之常用图形 (6)2.1鱼骨图 (6)2.2 柏拉图 (8)2.3 散布图 (11)2.4 直方图 (13)三、 Minitab在控制图中的应用 (15)3.1 计量型控制图 (16)3.1.1 Xbar-R做法 (16)3.1.2 Xbar-s做法 (19)3.1.3 I-MR图做法 (21)3.2计数型控制图 (24)3.2.1 p图做法 (24)3.2.2 np图做法 (26)3.2.3 c图做法 (28)3.2.4 u图做法 (31)附录一 (33)一、Minitab界面和基本操作介绍1.1 Minitab界面打开文件Session Window:分析结果输出窗口同一时间只能激活一个窗口,每一个窗口可以单独储存。
1.2 工具栏的介绍1.3 常用菜单与命令1.4 数据类型1.5 数据类型的转换Select: Data > Change Data Type > Text to Numeric1.6 数据类型的堆积Select: Data > Stack > Stack Columns1.7 数据块的堆积Select: Data > Stack > Stack Blocks of Columns1.8 转置栏Select: Data > Transpose Columns二、Minitab之常用图形QC七大工具中常用图形如下鱼骨图、柏拉图、散布图、直方图、控制图(见第三章)2.1鱼骨图又称因果图,石川图,鱼刺图。
上世纪50年代的日本质量管理专家石川馨发明。

Minitab帮助目录1、File文件New - opens a new worksheet or project新建-翻开一个新的工作表或工程Open Project - opens a project file翻开工程-翻开一个工程文件Save Project - saves the current project保存工程-保存当前的工程Save Project As - saves the current project with a different name另存工程为-用一个不同的名字另存当前的工程文件Project Description - edits a description of the current project方案描述-编辑当前的工程描述Open Worksheet - copies data from a file (Minitab, Excel, Lotus, text, and others), replacing the current worksheet翻开工作表 -从一个文件中(Minitab, Excel, Lotus, text, and others )复制数据,替代当前的工作表Query Database (ODBC) - imports data from a database file, such as one saved by Microsoft Access, Oracle, Sybase, or SAS into the Minitab worksheet咨询数据库(ODBC)-从一个数据库文件输入数据,例如由Microsoft Access, Oracle, Sybase, or SAS存入Minitab的工作表.Save Current Worksheet - saves the current worksheet in an existing MTW or MTP file保存当前的工作表-保存当前的工作表到一个现有的MTW或者MTP文件中.Save Current Worksheet As - saves worksheet data in a file, with a choice of many different file formats另存当前的工作表为-保存工作表中的数据到一个文件,可选择许多不同文件格式Close Worksheet - closes the current worksheet关闭工作表-关闭当前的工作表Open Graph - opens a Minitab graph (MGF) file翻开图表一翻开一个Minitab图表文件夹〔MGF〕Save Session Window As - saves the Session window content to a file另保存Session Window 为-保存Session Window 里的内容到一个文件中Save History As - saves the History folder content to a file另存History为-保存一个历史文件夹里的内容到一个文件中Save Graph As - saves the current Graph window to a file另存图表为-保存当前的Graph window到一个文件中Other Files - displays commands for importing and exporting special text files, and for running an Exec其它文件-显示指定的文本文件输入和输出的命令,和运行一个Exec的命令.Prints Session Window - prints the Session window打印Session Window 一打印Session windowPrint History - prints the History打印History -打印HistoryPrint Graph Window - prints the current Graph window打印图表窗口 -打印当前的图表窗口Print Worksheet - prints the contents of the current Data window打印工作表-打印当前Data window里的内容Print Setup - defines printer specifications设置打印-定义打印机的标准Exit - exits Minitab退出-退出Minitab2、Edit编辑Undo - undoes your most recent editing operation撤消-撤消最近的编辑操作Clear/Clear Cells - erases the contents of the highlighted cells, without moving rows up or columns left消除/消除单元格-删除突出的单元格的内容,不用向上移动行或者向左移动列Delete/Delete Cells - deletes the highlighted text or data删除/删除单元格-删除突出的文本或数据Copy/Copy Cells - copies the highlighted text or data to the Clipboard复制/复制单元格-复制突出的文本或数据到剪贴板Cut/Cut Cells - removes the highlighted text or data and copies it to the Clipboard剪切/剪切单元格-移动突出的文本或数据,复制到剪贴板Paste/Paste Cells - copies the contents of the Clipboard to the current position in the active window粘贴/粘贴单元格-复制剪贴板的内容到活动窗口的当前位置.Paste Link - creates a new Dynamic Data Exchange (DDE) link by pasting an existing link into a Data window 粘贴链接-通过粘贴现有的链接到数据窗,创立一个动态数据交换链接.Links - creates new Dynamic Data Exchange (DDE) links; changes or removes existing links;gets external data, or executes an external command链接-创立新的动态数据交换链接;改变或者移动现有的链接;获得外部的资料,或者执行一个外部命令Select All/Select All Cells ■- highlights everything in the active window选定所有/选定所有单元格-在活动的window里突出所有内容Edit Last Dialog - opens the most recently used dialog box, with the same selections from the last time you used it编辑最后的对话-翻开最近用到的对话框,选择与最后一次相同的选择Command Line Editor - allows you to execute session commands and/or edit and re-submit previously executed commands命令行编辑-允许执行Session命令和/或编辑和重新递交先前执行的命令Preferences - allows you to specify numerous options to customize your Minitab environment参数选择-允许指定许多的选项去定制Minitab的运行环境3、ManipSubset Worksheet - copies specified rows from the active worksheet to the new worksheet子集工作表-从一个活动的工作表复制指定的行到一个新的工作表Split Worksheet - splits or unstacks the active worksheet into two or more new worksheets based on one or moreBy" variables 别离工作表-在一个或更多的“副〞变量根底上分割或解开活动的工作表成两个或者更多新的工作表Merge : combines two worksheets into one new worksheet合并-合并两个工作表成一个新的工作表Sort - sorts one or more columns of data分类-分类一个或者多列数据Rank一- assigns rank scores to values in a column排序-按列里的值赋序数值Delete Rows - deletes specified rows from columns in the worksheet删除行-在工作表里从列里删除指定的行Erase Variables - erases any combination of columns, stored constants and matrices删除变量-删除任何结合的列,保存常量和矩阵Copy Columns - copies columns from one position in the worksheet to another; can copy entire columns or a subset复制列-从工作表的一个位置复制列到另一个位置,可复制完整的列或者一个子集Stack - stacks columns on top of each other to make longer columns叠加-叠加列在相互顶端制作更长列Unstack - unstacks (or splits) columns into shorter columns叠减-叠减(或者分开)列成较短列Transpose Columns - switches columns to rows转换列-把列转换成行Concatenate - combines two or more text columns side by side into one new column连接-两个或更多文本列并排合成一个新的列Code - recode values in columns编码-再编值成一列Change Data Type - changes columns from one data type (such as numeric, text, or date/time) to another改变数据类型-从一种数据类型列(例如数字、文本、或者日期 /时间)改变到另一种类型Display Data - displays data from the current worksheet in the Session window显示数据-把当前的工作中的数据显示到Session window.4、Calc计算器Calculator - does arithmetic using an algebraic expression, which may contain arithmetic operations, comparison operations, logical operations, and functions计算器-用代数的表达式进行计算,可以包括算术的运算,比拟的运算,逻辑的运算和其它功能Column Statistics - calculates various statistics based on a column you select列统计-在选择的列上进行不同的计算Row Statistics - calculates various statistics for each row of the columns you select行统计-在选择的行上进行不同的计算Standardize - centers and scales columns of data标准化-居中和平分数据列Extract from Date/Time to Numeric/Text - extracts one or more parts of a date/time column, such as the year, the quarter, or the hour, and saves that data in a numeric or a text column从日期/时间到数字/文本摘选-挑出一个日期/时间的一局部或多局部,例如年,分,或者小时, 把那些数据保存进一个数字或者文本的列Make Patterned Data - provides an easy way to fill a column with numbers or date/time values that follow a pattern. See also Generating Patterned Data Overview for related information .生成模式数据-提供一个简单的用数字或者是遵从一种模式的日期/时间值填充一列的途径.参见产生模式数据概览的相关信息Make Mesh Data - creates a regular (x,y) mesh to use for drawing contour, 3D surface and wireframe plots, with the option to create the z-variable as well.生成啮合〔网格〕数据-创立一个有规律的〔X, Y〕啮合〔网格〕用来画轮廓,3D外表和画线框,也用这个选项创立Z-变量.Make Indicator Variables - creates indicator (dummy) variables that you can use in regression analysis. See also Generating Patterned Data Overview for related information.生成指示器变量-创立指示器(虚拟定)变量,可以用于衰退分析,参见产生模式数据概览的相关信息Set Base - fixes a starting point for Minitab's random number generator设置基数冬Minitab随机数字发生器设定一个起始点Random Data - displays commands for generating a random sample of numbers, sampled either from columns of the worksheet or from a variety of distributions随机数据-显示产生一个随机样本大小的数字,取样不是从工作表的列里就是一个多样的分布的命令.Probability Distributions - displays commands that allow you to compute probabilities, probability densities, cumulative probabilities, and inverse cumulative probabilities for continuous and discrete distributions概率分布状态 -显示允许计算概率,或概率密度,累积概率,和连续和不连续分布的反转累积概率的命令Matrices - displays commands for doing matrix operations矩阵-显示进行矩阵运算的命令5、Stat统计Choose an item below:选以下一个工程Basic Statistics根本统计学Regression回归ANOVA (Analysis of Variance)变异分析DOE (Design of Experiments)实验设计Control Charts限制图Quality Tools质量工具Reliability/Survival可靠性/成活率Multivariate多元分析Time Series时间数列Tables平台Nonparametrics非参数的EDA (Exploratory Data Analysis)初步数据分析Power and Sample Size水平和样本大小6、Graph 图表Core graphs:中央图表Layout - lets you specify where a single graph or several graphs appear on one page.布局图-指定在一页上显示一个图或者几个图Plot - produces scatter plots, line plots, area plots, and spike plots绘图-产品分散绘制,线性绘制,面积绘制和信号绘制Time Series Plot - produces time series plots时间数列图-产生时间系列图Chart - generates bar charts, line charts, area charts and other types of charts图表-产生条形图,线性图,面积图和其它类型的图Histogram - generates histograms直方图-产生直方图Boxplot - produces box-and-whisker plots盒状图-产生box-and-whisker图Matrix Plot - produces a two-dimensional matrix of separate scatter plots where the input columns are used for either row or column variables, depending on the order in which you list them矩阵图-产生一个二维的单个散布图的矩阵,依靠列于其中的命令,输入列用于行或是列的变量.Draftsman Plot - produces a two-dimensional matrix of separate scatter plots where you specify which columns should be used for row variables and which should be used for column variables起草图-产生一个二维的单个散布图的矩阵,指定哪一列应当用于行的变量,哪一个应当用于列的变量.Contour Plot - produces contour plots轮廓图-产生轮廓图3D Graphs:3D图表:3D Plot - displays a three-dimensional plot3D图表-显示一个三维空间图3D Wireframe Plot - displays a three-dimensional plot of a surface drawn with a wireframe grid3D线框图表-显示一个外表画有线框格子的三维空间的图3D Surface Plot - displays a three-dimensional plot of a smooth surface3D外表图表-显示一个平滑外表的三维图表Specialty Graphs:专业图表Pie Chart - generates pie charts饼形图-产生饼形图Dotplot - displays individual points along a number line.点图-显示沿着一条数据线单个的点Marginal Plot - produces scatter plots with histograms, boxplots, or dotplots in the margins边缘图-在页边里用直方图,盒状图,或者点图产生的散布图Probability Plot概率图Character Graphs:特征图表Stem-and-Leaf 树状图Character Graphs - displays commands that produce a variety of character (as opposed to high-resolution ) graphs 特征图表-显示命令生成一个多样特征的图表7、Editor编缉器Editor Menu (When Data Window is Active)编辑器菜单(当Data window是活动的)The following commands become available when you are working in the Data Window. Choose a command for more information:当你在Data window (数据窗)中工作时,以下命令可获得.选一命令以获更多信息.Find - allows you to search for data in the Data window查找-允许在Data window里查找数据Replace - allows you to search for and update data in the Data window替换-允许在Data window里查找和更新数据Go To - moves the cursor to the cell you specify定位-移动指针到指定的单元格Next Column - (visible when the data entry arrow is down) moves the cursor to the top of the next column下一列-(当数据登录箭头是向下的)移动指针到下一列的首端Next Row - (visible when the data entry arrow is pointing right) moves the cursor to the beginning of the next row下一行-(当数据登录箭头是指向右的)移动指针到下一行的开始之处Go To Active Cell - adjusts the Data window display so you can see the part of the worksheet that contains the active cell定位活动的单元格-调整Data window显示,以便你能看到包括活动单元格的局部工作表Next Brushed Row下一个格式化的行Previous Brushed Row以前刷过的行Format Column - allows you to specify how a column is displayed in the Data window格式化列-允许指定在Data window里一列是怎样显示的Column - allows you to add column descriptions, hide/unhide columns, set column widths, and apply a value order for text data列-允许增加列描述,隐藏/取消隐藏,设定列的宽度和适应为文本数据的评估命令Worksheet - allows you to add worksheet descriptions, change data entry arrow direction, and select data and label fonts工作表-允许增加工作表描述,改变数据输入箭头的方向,选择数据和标签字体Insert Cells - inserts one or more cells above the active cell插入单元格-在活动的单元格之上插入一个或多个单元格Insert Rows - inserts one or more rows above the active cell插入行-在活动的单元格上插入一行或多行Insert Columns - inserts one or more columns to the left of the active cell插入列-在活动的单元格左边插入一列或多列Move Columns - moves the active column or selected columns移动列-移动活动的列或者选定的列Define Custom Lists - define custom lists of text data to use with the Autofill command定义定制列表-用自动填充命令定义文本数据的定制列表Clipboard Settings - allows you to specify a value other than an asterisk (*) to represent missing values in the Clipboard剪贴板设置-允许指定一个值不同于星号(“ *〞)在剪贴板上不见的值的表现Editor Menu (When Graph Window is Active) 编辑器菜单(当Graph window是活动的)The following commands become available when you are working in the Graph Window. Choose a command for more information:View - just view the active Graph window视图-仅看到活动的Graph windowEdit - edit the active Graph window编辑-编辑活动的Graph windowBrush - put the active graph in brushing mode格式刷-把活动的图表放进格式刷的模式Duplicate - make a duplicate copy of the selected objects复制-制作一个选定的目标的复制Bring to Front - bring selected object to the foreground到最前-把选定的目标放到最前Send to Back - send selected object to the background到最后-把选定的目标放到最后Rotate Left - rotate the selected object counter-clockwise左旋转-把选定的目标顺时针方向旋转Rotate Right - rotate the selected object clockwise右旋转-把选定的目标顺时针旋转Align - align the selected objects排列-排列选定的目标Flip Horizontal - flip the selected object sideways水平翻转-侧面翻转选定的目标Flip Vertical - flip the selected object vertically垂直翻转-垂直翻转选定的目标Show/Hide Tool Palette - display or do not display the tool palette显示/隐藏调色板工具栏-显示或者不显示调色板工具栏Show/Hide Attribute Palette - display or do not display the attribute palette显示/隐藏调色板的属性-显示或者不显示调色板的属性Retain Tool/Select Object After Drawing - after drawing an object, either keep the drawing tool active, or select the object just drawn保存工具/在画图后选择目标-在画完一个目标之后,不是保存活动的绘图工具,就是选择刚画完的目标Lock/Unlock Data Display - prevent or allow changes to the plotted data in the graph锁住/解锁数据显示-预防或者允许改变图中图示的数据Show/Hide Brushing Palette - display or do not display the brushing palette显示/隐藏调色板格式刷-显示或者不显示调色板格式刷Set ID Variables - when brushing, specify which columns to identify in the brushing palette设置ID变量-当格式刷时,在调色板格式刷中指定哪一列要确定格式刷Set Brushing Color - specify which color to use to highlight the data points being brushed设定刷子的颜色-指定哪一种颜色突出要刷的数据点Create Indicator Variable - create a column whose values (0 s and 1 s) indicate which rows have been brushed on a graph创立Indicator变量-创立一列,包括谁的值,哪一行已在图上被格式刷过.Editor Menu (When Session Window Is Active)编辑器菜单 (当Session window 是活动的)The following commands become available when you are working in the Session window. Choose a command for more information:当在Section Window中工作时,可获得以下命令.选择一个命令以获得更多信息.Next Command - scroll to the next command in the Session window下一个命令 -在Session window 里翻到下一个命令Previous Command - scroll to the previous command in the Session window以前的命令-在Session window里翻到以前的命令Enable Commands - Uncheck Enable Commands to suppress display of command language and disable the ability to type commands in the Session window. Check Enable Commands to have command language displayed and allow you to type session commands in the Session window.有效命令-不选择有效命令去制止显示命令语言,丧失在Session window显示命令的水平.选择有效命令显示的命令语言,允许在Session window里显示Session命令.Output Editable - Check Output Editable when you want to delete, paste, and type in the Session window. Uncheck Output Editable and you can copy from the Session window, but you cannot delete from or add to it.输出编辑-当想删除、本贴,和在Session window显示类型时,检查可编辑的输出.不选择可编辑的选择,可以从Session window里复制,但是不能从中删除或者添加.Find - find specified text查找-查找指定的文本Replace - find specified text and replace with substitute text替换-查找指定的文本,用替代的文本替换Select Fonts - selects fonts to use in the Session window选择字体-选择字体并用于Session windowApply I/O Font - apply input and output font to current line or selected text应用I/O字体-应用输入和输出字体到当前的行或者选择的文本Apply Title Font - apply title font to current line or selected text应用标题字体-应用标题字体到当前的排列或选择的文本Apply Comment Font - apply comment font to current line or selected text应用注释字体-应用注释字体到当前的行或选择的文本Interrupting Commands or Macros - halt execution of commands or macros中止命令或者宏-中止命令或者宏的执行8、WindowCascade - arranges all open Minitab windows so that they overlap with each title bar visible (if possible)层叠-安排所有翻开的Minitab windows,以便于它们可看到与每一个标题条交迭(如果可能)Tile - arranges all open Minitab windows so that they fit next to each other on the desktop and do not overlap (if possible)分排-安排所有翻开的Minitab windows ,以便于在桌面上相邻放置,不需交迭(如果可能)Minimize All - reduces all open windows to icons and places them at the bottom of the screen最小化-缩小所有翻开的Windows的图标和位置并放在屏幕的下端.Restore Icons - opens all icons into windows, sized as they were when last reduced to icons within the session恢复图标-翻开所有图标到Windows ,在Session里恢复最后减小的图标的大小Arrange Icons - arranges icons along the bottom of the Minitab window排列图标-沿Minitab window的底部排列图标Refresh - redraws the graph in the active window刷新-在活动的Window里重画图表Standard Toolbar - display or hide the Standard Toolbar标准工具栏-显示或隐藏标准工具栏Project Manager Toolbar - display or hide the Project Manager Toolbar工程治理器工具栏-显示或隐藏工程治理器工具栏Status Bar - display or hide the Status BarBar状态-显示或隐藏Bar状态Close All Graphs - closes all Graph windows关闭所有图表-关闭所有图表窗Set Graph Size/Location - determines how Minitab will display Graph windows设置图表尺寸/位置-确定Minitab怎样显示图表Session <Ctrl>+<M> - switches you to the Session window, where you can enter session commands and/or view analysis results Session <Ctrl>+<M> - 转换到Session window ,在这里可以进入到Session命令,和/或者显示分析的结果Project Manager - switches you to the Project Manager window, where you can manage windows, graphs, worksheets, related documents, and project information.工程治理器-转换到Project治理器,可以治理Windows ,图表,工作表,相关的文件和工程信息Worksheets and Graphs - all open Graph and Data windows are listed at the bottom of the Window menu. Click on any window name to activate the window and bring it to the front of Minitab. See Multiple Graph Windows Limit for important information on graphs.工作表和图表-所有翻开的图表和数据Window都显示在window菜单的下端.点击任何window名称激活Window窗并带到Minitab的前端位置.在图表上看多重图表Windows对重要信息的限制9、HelpHelp - displays a table of contents of information in the Help system.帮助-在帮助系统里显示一平台的信息内容Search Help - opens the Windows Index dialog box. Type keywords to find topics, just like you would skim an index in a printed manual.查找帮助-翻开Windows索引对话框.建入关键字以查找主题,就像在打印手册里撤消一个索引How to Use Help - explains how to use the Windows Help system, including how to print, copy and paste Help text.怎样使用帮助-解释怎样使用Windows使用系统,包括怎样打印、复制和粘贴帮助文本.StatGuide - displays the welcome page统计指引-显示首页Search the StatGuide - opens the table of contents查找统计指引-翻开平台内容How to Use the StatGuide - opens the How to Use the StatGuide Help file怎样使用查找统计-找开怎样使用查找统计帮助文件Tutorials - opens the Tutorials, which walk you through five sample sessions of MINITAB 13,showing you step-by-step how to perform a broad range of analyses.指南-翻开指南,在MINITAB中预排五个样本的Sessions , 一步一步地显示执行一个宽范围的分析Search Tutorials - opens the Windows Search or Windows 95 dialog box. Type keywords to find topics, just like you wouldskim an index in a printed manual.查找指南-翻开Windows查找或者Windows 95对话框.键入关键字到查找主题,就像在打印手册里撤消一个索引Session Command Help - opens Session Command Help containing documentation on each session command, including syntax and examples.Session命令帮助-翻开Session命令帮助,包括在每一个Session命令上的文件,包括语法和例子Search Session Command Help - opens the Windows Search or Windows 95 dialog box. Type keywords to find topics, just like you would skim an index in a printed manual.查找Session命令帮助-翻开Windows查找或者Windows 95对话框.键入关键字到查找主题,就像在打印手册里撤消一个索引.About Minitab - displays the serial number, product name, release number, and other information关于Minitab -显示序列号,产品名称,版本号,和其它信息.。

第一章基础知识第一节数据类型及设置在MINITAB系统中,有3种基本数据类型供用户选择,分别是:数值型数据、文本型数据和日期/时间型数据。
一般来说,不同类型的数据应采用不同的统计分析方法进行数据分析。
所以,在应用MINITAB统计分析软件之前,应能够有效地识别不同类型的数据。
1.1.1 数值型(Numeric)数据⑴计量数据(Measurement Data)计量数据,为观测每个观察单位某项指标的大小而获得的资料。
其变量值是定量的,表现为数值大小,一般有度量衡单位。
假如一个数据的所有可能取值充满数轴上一个区间(a,b),则称这样的数据为计量数据,其中a可以是-∞,b可以是+∞,通常称这类数据是连续数据(Continuous Data)。
这种类型的数据往往既可以取整数、小数、分数,有时候(虽然不是全部)还可以取负数。
例如:长度、重量、温度、湿度、体积、误差、速度、时间、寿命等等。
它的统计分析与连续随机变量(Continuous random variable)的分布有关。
在MINITAB 统计分析功能中,这种数据是主要的分析对象,统计分析时,常用的参数和方法有:均值、标准差、t检验、方差分析、回归分析等。
⑵计数数据(Enumeration Data)计数数据又称为定性数据或分类数据(Categorical Data),是将观察单位按某种属性或类别分组计数,分别汇总各组观察单位后而得到的数据,其变量值是定性的,表现为互不相容的属性或类别。
这类数据仅取数轴上有限个点或可列个点,一般只取非负整数,不取小数、分数,更不取负数。
例如:某一单位面积内某一种缺陷的个数、一批产品中不合格品的个数、一个超市每天进入的人数、一个麦穗上的麦粒数等等。
它的统计分析是与具有离散随机变量(Discrete random variable)的分布有关。
在MINITAB的统计分析功能中,常采用非参数分析、2χ检验、二项分布、超几何分布、泊松分布等统计方法。

•Minitab基础介绍•数据处理与可视化•统计分析与检验方法•回归分析与应用目•实验设计与优化方法•质量管理与可靠性分析录011 2 3统计分析与数据可视化工具易于使用且功能丰富广泛的应用领域Minitab软件概述Minitab界面与功能主界面介绍Minitab的主界面包括菜单栏、工具栏、项目管理器、数据窗口和图形窗口等部分,方便用户进行各种操作。
基本功能概述Minitab提供数据导入、数据整理、统计分析、图形绘制等基本功能,满足用户不同的需求。
高级功能介绍除了基本功能外,Minitab还提供多变量分析、时间序列分析、非参数检验等高级功能,帮助用户进行更深入的数据分析。
数据类型与导入方法数据类型01数据导入方法02数据整理与清洗0302数据导入与导出数据清洗数据整理030201数据清洗与整理数据可视化技巧图表类型选择图表美化动态交互图表类型及应用场景高级图表类型常用图表类型介绍热力图、树状图、桑基图等高级图表类型及其适用场景。
图表组合与布局03描述性统计分析01020304数据整理和可视化集中趋势度量离散程度度量分布形态判断结论解释根据决策规则,解释假设检验结果,并给出相应结论。
根据检验统计量的分布和显著性水平,制定拒绝或接受原假设的决策规则。
显著性水平设定根据研究背景和实际需求,设定合适的显著性水平。
假设建立根据研究问题,提出原假设和检验统计量选择根据数据类型和假设检验类型,假设检验原理及步骤方差分析原理单因素方差分析多因素方差分析方差分析注意事项方差分析(ANOVA)应用04确定自变量和因变量建立线性回归模型查看回归结果绘制散点图线性回归模型建立回归诊断与优化方法残差分析多重共线性诊断模型优化结果解释与应用根据回归结果,解释各个自变量对因变量的影响程度和方向。
同时,可以将模型应用于实际预测或决策支持中,例如制定广告策略、调整价格策略等。
案例介绍选择一个具有多个自变量的实际案例,例如研究销售额与广告投入、价格、产品质量等因素之间的关系。
Minitab培训教程一、引言Minitab是一款广泛应用于质量管理和统计分析的软件,其简单易用、功能强大的特点使其在众多行业和领域得到了广泛应用。
为了帮助用户更好地掌握Minitab的使用方法,提高数据分析能力,本文将详细介绍Minitab的基本操作、常用功能和实际应用案例。
二、Minitab基本操作1.安装与启动用户需要从Minitab官方网站软件安装包,按照提示完成安装。
安装完成后,双击桌面图标启动Minitab。
2.界面介绍Minitab的主界面包括菜单栏、工具栏、项目树、工作表、输出窗口和状态栏。
菜单栏包含文件、编辑、视图、帮助等选项;工具栏提供了常用功能的快捷方式;项目树用于显示当前工作簿中的所有数据表和输出结果;工作表用于输入和编辑数据;输出窗口显示分析结果;状态栏显示当前工作状态。
3.数据输入与编辑在Minitab中,数据输入与编辑主要通过工作表进行。
用户可以手动输入数据,也可以从外部文件导入数据。
数据编辑包括插入行、删除行、插入列、删除列、复制粘贴、查找替换等操作。
4.数据保存与导出Minitab支持多种数据格式,如MinitabProject(.mtw)、Excel(.xlsx)、CSV(.csv)等。
用户可以随时保存当前工作簿,以便下次继续使用。
Minitab还可以将工作表、输出结果等导出为其他格式,以便与其他软件进行数据交换。
三、Minitab常用功能1.描述性统计分析描述性统计分析是Minitab的基础功能之一,主要包括均值、标准差、方差、偏度、峰度等统计量。
通过描述性统计分析,用户可以快速了解数据的整体情况。
2.假设检验Minitab提供了丰富的假设检验方法,如t检验、方差分析、卡方检验等。
用户可以根据实际需求选择合适的假设检验方法,检验样本数据的显著性。
3.相关分析与回归分析相关分析用于研究两个变量之间的线性关系,回归分析用于研究一个变量对另一个变量的影响程度。
Minitab提供了皮尔逊相关系数、斯皮尔曼等级相关系数、线性回归、非线性回归等分析方法。
第一章基础知识第一节数据类型及设置在MINITAB系统中,有3种基本数据类型供用户选择,分别是:数值型数据、文本型数据和日期/时间型数据。
一般来说,不同类型的数据应采用不同的统计分析方法进行数据分析。
所以,在应用MINITAB统计分析软件之前,应能够有效地识别不同类型的数据。
1.1.1 数值型(Numeric)数据⑴计量数据(Measurement Data)计量数据,为观测每个观察单位某项指标的大小而获得的资料。
其变量值是定量的,表现为数值大小,一般有度量衡单位。
假如一个数据的所有可能取值充满数轴上一个区间(a,b),则称这样的数据为计量数据,其中a可以是-∞,b可以是+∞,通常称这类数据是连续数据(Continuous Data)。
这种类型的数据往往既可以取整数、小数、分数,有时候(虽然不是全部)还可以取负数。
例如:长度、重量、温度、湿度、体积、误差、速度、时间、寿命等等。
它的统计分析与连续随机变量(Continuous random variable)的分布有关。
在MINITAB 统计分析功能中,这种数据是主要的分析对象,统计分析时,常用的参数和方法有:均值、标准差、t检验、方差分析、回归分析等。
⑵计数数据(Enumeration Data)计数数据又称为定性数据或分类数据(Categorical Data),是将观察单位按某种属性或类别分组计数,分别汇总各组观察单位后而得到的数据,其变量值是定性的,表现为互不相容的属性或类别。
这类数据仅取数轴上有限个点或可列个点,一般只取非负整数,不取小数、分数,更不取负数。
例如:某一单位面积内某一种缺陷的个数、一批产品中不合格品的个数、一个超市每天进入的人数、一个麦穗上的麦粒数等等。
它的统计分析是与具有离散随机变量(Discrete random variable)的分布有关。
在MINITAB的统计分析功能中,常采用非参数分析、2χ检验、二项分布、超几何分布、泊松分布等统计方法。
Minitab 关心目录1、File 文件New - opens a new worksheet or project新建- 打开一个新的工作表或项目Open Project - opens a project file打开项目–打开一个项目文件Save Project - saves the current project保存项目–保存当前的项目Save Project As - saves the current project with a different name另存项目为–用一个不同的名字另存当前的项目文件Project Description - edits a description of the current project方案描述–编辑当前的项目描述Open Worksheet- copies data from a file (Minitab, Excel, Lotus, text, and others), replacing the current worksheet打开工作表–从一个文件中(Minitab, Excel, Lotus, text, and others)复制数据,替代当前的工作表Query Database (ODBC) - imports data from a database file, such as one saved by Microsoft Access, Oracle, Sybase, or SAS into the Minitab worksheet咨询数据库(ODBC)- 从一个数据库文件输入数据,例如由Microsoft Access, Oracle, Sybase, or SAS存入Minitab的工作表。
Save Current Worksheet - saves the current worksheet in an existing MTW or MTP file保存当前的工作表–保存当前的工作表到一个现有的MTW或者MTP文件中。
Minitab统计软件基础教程及界面详解Minitab是一款功能强大的统计分析软件,在数据分析、质量控制、实验设计等领域得到广泛应用。
本文将详细介绍Minitab软件的基础知识,并对其界面进行详细解释。
一、Minitab软件基础知识Minitab是一款专业的统计软件,具有数据分析、数据可视化、实验设计、质量管理等多项功能。
它的操作简便,对于初学者和专业用户都非常友好。
1. 安装与启动首先,我们需要从Minitab官方网站上下载并安装Minitab软件。
安装成功后,双击桌面上的Minitab图标即可启动软件。
2. 数据输入与导入在Minitab中,我们可以通过多种方式输入数据。
例如,我们可以直接在工作表中手动输入数据,也可以将数据从Excel、文本文件等外部文件导入到Minitab中。
3. 数据处理与分析Minitab提供了丰富的数据处理和分析功能。
通过Minitab,我们可以进行基本的描述统计分析,如均值、标准差、中位数等;还可以进行数据可视化,通过绘制直方图、散点图等图表来展示数据特征;此外,Minitab还支持多种假设检验、回归分析、方差分析等高级数据分析方法。
4. 报告输出与解释在Minitab中,我们可以将分析结果输出为报告或图表。
通过报告输出,我们可以清晰地呈现数据的分析结果,并对结果进行解释和讨论。
二、Minitab软件界面详解Minitab软件的界面操作简单明了,主要包括菜单栏、工具栏、工作区和输出区域。
1. 菜单栏菜单栏位于软件界面的顶部,包含各种功能菜单,如文件、编辑、数据、统计、图表、工具、窗口和帮助等。
通过点击相应菜单,我们可以访问各种功能和选项。
2. 工具栏工具栏位于菜单栏下方,包含了一些常用的快捷工具按钮。
例如,我们可以通过工具栏上的按钮快速访问数据输入、绘图、数据分析等功能。
3. 工作区工作区是Minitab软件最主要的操作区域,类似于Excel的工作表。
我们可以在工作区中输入数据、进行数据处理和分析操作。
Minitab培训教程大全1.引言Minitab是一款广泛应用于数据分析、质量管理和统计分析的软件。
它以其强大的功能和简便的操作受到众多用户的一致好评。
为了帮助用户更好地掌握Minitab的使用方法,本文将为您详细介绍Minitab的各项功能,并提供详细的操作步骤和实际案例。
2.Minitab基础知识2.1Minitab界面介绍Minitab界面主要包括菜单栏、工具栏、工作表视图、项目管理器、输出窗口和状态栏等部分。
用户可以通过菜单栏选择不同的功能,使用工具栏中的图标进行快速操作,工作表视图用于显示数据,项目管理器用于管理项目文件,输出窗口用于显示分析结果,状态栏用于显示当前状态信息。
2.2Minitab数据类型Minitab支持多种数据类型,包括数值型、字符型和日期型等。
数值型数据可以进行计算和统计分析,字符型数据用于表示文字信息,日期型数据用于表示日期和时间。
用户可以根据实际需求选择合适的数据类型。
3.Minitab统计分析功能3.1描述性统计分析描述性统计分析用于描述数据的集中趋势和离散程度。
Minitab 提供了均值、中位数、众数、方差、标准差、偏度、峰度等统计量。
用户可以通过选择“统计”→“基本统计量”→“描述性统计”进行操作。
3.2假设检验假设检验用于判断样本数据是否具有显著性差异。
Minitab提供了t检验、方差分析、卡方检验等假设检验方法。
用户可以通过选择“统计”→“假设检验”进行操作。
3.3相关分析与回归分析相关分析用于研究两个变量之间的关系,回归分析用于预测一个变量与一个或多个自变量的关系。
Minitab提供了皮尔逊相关系数、斯皮尔曼等级相关系数、线性回归、多元回归等分析方法。
用户可以通过选择“统计”→“相关与回归”进行操作。
3.4方差分析方差分析(ANOVA)用于研究多个样本均值是否存在显著性差异。
Minitab提供了单因素方差分析、多因素方差分析、重复测量方差分析等方法。
Minitab应⽤基础知识Minitab应⽤基础知识⼀、 Minitab界⾯和基本操作介绍 (1)1.1 Minitab界⾯ (1)1.2 ⼯具栏的介绍 (2)1.3 常⽤菜单与命令 (2)1.4 数据类型 (3)1.5 数据类型的转换 (3)1.6 数据类型的堆积 (4)1.7 数据块的堆积 (4)1.8 转置栏 (5)⼆、Minitab之常⽤图形 (6)2.1鱼⾻图 (6)2.2 柏拉图 (8)2.3 散布图 (11)2.4 直⽅图 (13)三、 Minitab在控制图中的应⽤ (15)3.1 计量型控制图 (16)3.1.1 Xbar-R做法 (16)3.1.2 Xbar-s做法 (19)3.1.3 I-MR图做法 (21)3.2计数型控制图 (24)3.2.1 p图做法 (24)3.2.2 np图做法 (26)3.2.3 c图做法 (28)3.2.4 u图做法 (31)附录⼀ (33)⼀、Minitab界⾯和基本操作介绍1.1 Minitab界⾯打开⽂件Session Window:分析结果输出窗⼝同⼀时间只能激活⼀个窗⼝,每⼀个窗⼝可以单独储存。
1.2 ⼯具栏的介绍1.3 常⽤菜单与命令1.4 数据类型1.5 数据类型的转换Select: Data > Change Data Type > Text to Numeric1.6 数据类型的堆积Select: Data > Stack > Stack Columns1.7 数据块的堆积Select: Data > Stack > Stack Blocks of Columns1.8 转置栏Select: Data > Transpose Columns⼆、Minitab之常⽤图形QC七⼤⼯具中常⽤图形如下鱼⾻图、柏拉图、散布图、直⽅图、控制图(见第三章)2.1鱼⾻图⼜称因果图,⽯川图,鱼刺图。
上世纪50年代的⽇本质量管理专家⽯川馨发明。
Minitab培训教程详解一、引言Minitab是一款广泛应用于质量管理、数据分析、过程改进等领域的统计软件。
它凭借其强大的数据处理能力、简便的操作界面和丰富的图表功能,受到了众多专业人士的青睐。
为了让用户更好地掌握Minitab的使用技巧,本文将详细介绍Minitab的基本操作、常用功能及实际应用案例,帮助读者快速提升数据分析能力。
二、Minitab基本操作1.安装与启动(1)从官网Minitab安装包。
(2)按照提示完成安装过程。
(3)启动Minitab,输入序列号激活软件。
2.界面介绍(1)菜单栏:包含文件、编辑、视图、帮助等菜单。
(2)工具栏:提供常用功能的快捷按钮。
(3)项目管理器:用于创建、管理和保存项目。
(4)工作表:用于输入、编辑和查看数据。
(5)图表:用于展示数据分析结果。
3.数据输入与编辑(1)手动输入数据:在工作表中直接输入数据。
(2)导入外部数据:支持Excel、CSV、TXT等格式。
(3)数据编辑:包括复制、粘贴、删除、插入等操作。
(4)数据筛选:根据条件筛选数据。
三、Minitab常用功能1.描述性统计(1)基本统计量:包括均值、中位数、标准差等。
(2)频数分析:统计各数据出现的次数。
(3)图表展示:包括直方图、箱线图等。
2.假设检验(1)单样本t检验:检验样本均值是否等于总体均值。
(2)两独立样本t检验:检验两个样本均值是否存在显著差异。
(3)配对样本t检验:检验两个相关样本均值是否存在显著差异。
3.方差分析(1)单因素方差分析:检验多个样本均值是否存在显著差异。
(2)双因素方差分析:检验两个因素对样本均值的影响。
4.相关分析与回归分析(1)相关分析:研究两个变量之间的关系。
(2)线性回归:建立一个或多个自变量与因变量之间的线性关系模型。
(3)多元回归:建立一个或多个自变量与多个因变量之间的线性关系模型。
5.质量管理工具(1)控制图:监控过程稳定性,发现异常因素。
(2)实验设计(DOE):优化产品设计,提高产品质量。
Minitab帮助基础知识(doc 14页)部门: xxx时间: xxx整理范文,仅供参考,可下载自行编辑Minitab 帮助目录1、File 文件New - opens a new worksheet or project新建- 打开一个新的工作表或项目Open Project - opens a project file打开项目–打开一个项目文件Save Project - saves the current project保存项目–保存当前的项目Save Project As - saves the current project with a different name另存项目为–用一个不同的名字另存当前的项目文件Project Description - edits a description of the current project方案描述–编辑当前的项目描述Open Worksheet - copies data from a file (Minitab, Excel, Lotus, text, and others), replacing the current worksheet打开工作表–从一个文件中(Minitab, Excel, Lotus, text, and others)复制数据,替代当前的工作表Query Database (ODBC) - imports data from a database file, such as one saved by Microsoft Access, Oracle, Sybase, or SAS into the Minitab worksheet咨询数据库(ODBC)- 从一个数据库文件输入数据,例如由Microsoft Access, Oracle, Sybase, or SAS存入Minitab的工作表。
Save Current Worksheet - saves the current worksheet in an existing MTW or MTP file保存当前的工作表–保存当前的工作表到一个现有的MTW或者MTP文件中。
Save Current Worksheet As - saves worksheet data in a file, with a choice of many different file formats另存当前的工作表为–保存工作表中的数据到一个文件,可选择许多不同文件格式Close Worksheet - closes the current worksheet关闭工作表–关闭当前的工作表Open Graph - opens a Minitab graph (MGF) file打开图表–打开一个Minitab 图表文件夹(MGF)Save Session Window As - saves the Session window content to a file另保存 Session Window 为–保存Session Window 里的内容到一个文件中Save History As - saves the History folder content to a file另存History 为–保存一个历史文件夹里的内容到一个文件中Save Graph As - saves the current Graph window to a file另存图表为–保存当前的Graph window 到一个文件中Other Files - displays commands for importing and exporting special text files, and for running an Exec其它文件–显示指定的文本文件输入和输出的命令,和运行一个Exec的命令.Prints Session Window - prints the Session window打印Session Window –打印Session windowPrint History - prints the History打印History –打印HistoryPrint Graph Window - prints the current Graph window打印图表窗口–打印当前的图表窗口Print Worksheet - prints the contents of the current Data window打印工作表–打印当前Data window 里的内容Print Setup - defines printer specifications设置打印–定义打印机的标准Exit - exits Minitab退出- 退出Minitab2、Edit 编辑Undo - undoes your most recent editing operation撤消–撤消最近的编辑操作Clear/Clear Cells- erases the contents of the highlighted cells, without moving rows up or columns left清除/清除单元格–删除突出的单元格的内容,不用向上移动行或者向左移动列Delete/Delete Cells - deletes the highlighted text or data删除/删除单元格–删除突出的文本或数据Copy/Copy Cells - copies the highlighted text or data to the Clipboard复制/复制单元格–复制突出的文本或数据到剪贴板Cut/Cut Cells - removes the highlighted text or data and copies it to the Clipboard剪切/剪切单元格–移动突出的文本或数据,复制到剪贴板Paste/Paste Cells- copies the contents of the Clipboard to the current position in the active window粘贴/粘贴单元格–复制剪贴板的内容到活动窗口的当前位置。
Paste Link - creates a new Dynamic Data Exchange(DDE)link by pasting an existing link into a Data window粘贴链接–通过粘贴现有的链接到数据窗,创建一个动态数据交换链接。
Links - creates new Dynamic Data Exchange (DDE) links; changes or removes existing links; gets external data, or executes an external command链接–创建新的动态数据交换链接;改变或者移动现有的链接;获得外部的资料,或者执行一个外部命令Select All/Select All Cells - highlights everything in the active window选定所有/选定所有单元格–在活动的window里突出所有内容Edit Last Dialog - opens the most recently used dialog box, with the same selections from the last time you used it编辑最后的对话–打开最近用到的对话框,选择与最后一次相同的选择Command Line Editor - allows you to execute session commands and/or edit and re-submit previously executed commands命令行编辑–允许执行Session 命令和/或编辑和重新递交先前执行的命令Preferences - allows you to specify numerous options to customize your Minitab environment 参数选择–允许指定许多的选项去定制Minitab的运行环境3、ManipSubset Worksheet - copies specified rows from the active worksheet to the new worksheet子集工作表–从一个活动的工作表复制指定的行到一个新的工作表Split Worksheet- splits or unstacks the active worksheet into two or more new worksheets based on one or more “By” variables分离工作表–在一个或更多的“副”变量基础上分割或解开活动的工作表成两个或者更多新的工作表Merge - combines two worksheets into one new worksheet合并–合并两个工作表成一个新的工作表Sort - sorts one or more columns of data分类–分类一个或者多列数据Rank - assigns rank scores to values in a column排序–按列里的值赋序数值Delete Rows - deletes specified rows from columns in the worksheet删除行–在工作表里从列里删除指定的行Erase Variables - erases any combination of columns, stored constants and matrices删除变量–删除任何结合的列,保存常量和矩阵Copy Columns - copies columns from one position in the worksheet to another; can copy entire columns or a subset复制列–从工作表的一个位置复制列到另一个位置,可复制完整的列或者一个子集Stack - stacks columns on top of each other to make longer columns叠加–叠加列在相互顶端制作更长列Unstack - unstacks (or splits) columns into shorter columns叠减–叠减(或者分开)列成较短列Transpose Columns - switches columns to rows转换列–把列转换成行Concatenate - combines two or more text columns side by side into one new column连接–两个或更多文本列并排合成一个新的列Code - recode values in columns编码–再编值成一列Change Data Type - changes columns from one data type (such as numeric, text, or date/time) to another改变数据类型–从一种数据类型列(例如数字、文本、或者日期/时间)改变到另一种类型Display Data - displays data from the current worksheet in the Session window显示数据–把当前的工作中的数据显示到Session window.4、Calc计算器Calculator- does arithmetic using an algebraic expression, which may contain arithmetic operations, comparison operations, logical operations, and functions计算器–用代数的表达式进行计算,可以包括算术的运算,比较的运算,逻辑的运算和其它功能Column Statistics - calculates various statistics based on a column you select列统计–在选择的列上进行不同的计算Row Statistics - calculates various statistics for each row of the columns you select行统计–在选择的行上进行不同的计算Standardize - centers and scales columns of data标准化–居中和平分数据列Extract from Date/Time to Numeric/Text - extracts one or more parts of a date/time column, such as the year, the quarter, or the hour, and saves that data in a numeric or a text column从日期/时间到数字/文本摘选–挑出一个日期/时间的一部分或多部分,例如年,分,或者小时,把那些数据保存进一个数字或者文本的列Make Patterned Data - provides an easy way to fill a column with numbers or date/time values that follow a pattern. See also Generating Patterned Data Overview for related information.生成模式数据–提供一个简单的用数字或者是遵从一种模式的日期/时间值填充一列的途径。