中考英语作文模板:图表作文的框架
- 格式:docx
- 大小:12.21 KB
- 文档页数:1

图表类英语作文模板英文回答:The bar chart illustrates the percentage of people who use different modes of transport to travel to work or school in two cities, City A and City B.In City A, the most popular mode of transport is the private car, with 45% of people using it to commute. This is followed by public transportation, which is used by 35% of people, and walking, which is used by 20%. Cycling is the least popular mode of transport, with only 10% of people using it.In City B, the situation is quite different. Public transportation is the most popular mode of transport, with 60% of people using it to commute. This is followed by walking, which is used by 25%, and the private car, which is used by 20%. Cycling is once again the least popular mode of transport, with only 15% of people using it.It is clear that there are some significant differences between the two cities in terms of the modes of transport that people use to commute. In City A, the private car is king, while in City B, public transportation is the preferred choice. This may be due to a number of factors, such as the availability of public transportation, the cost of fuel, and the traffic congestion in each city.中文回答:图表显示了在城市 A 和城市 B 中,人们使用不同交通方式通勤的百分比。
图表类型 -图表(graph/diagram)包括柱状图(bar/column chart)、表格(table)、饼状图(pie chart)、折线图(line chart)、曲线图(curve chart)、流程图(flow chart)、组图(a set of charts)等。
如果考试的时候不会写某个具体图表的英译,可以用graph/diagram泛指所有图表。
graph n.图表;代表声音单位(或其他言语特征)的书写符号;坐标图v.用图标示;绘图diagramn.图解;简图;示意图;几何图形;火车运行时间图v.以图表示;根据火车运行时间图来安排(火车的)运行时间- 写作思路 -第一段:描述图表第二段:说明图表数据增长or下降的原因。
第三段:表达自己对此现象的看法以及面对此现象我们该怎么去做。
(具体写不写第二段和第三段要看作文要求,如果作文direction里写明了你要“interpret the chart and give your comments”,那就一定别忘了写第二段和第三段,如果只是让“interpret the chart”,那在作文结尾写一两句第二段和第三段的内容或者不写即可)嵌套饼状图的写作思路第一部分思路:从饼状图中我们可以了解到xx是怎样的,其中百分之几是A,百分之几是B,B中a占多少,b占多少,c占多少。
第二部分思路:图表数据说明了什么,我的看法是什么。
(一般图表给的数据多比较复杂,作文就描述图表数据的篇幅多一些。
如果图表给的数据很简单,比如21年12月的六级作文真题,就给了个单条折线图,那描述图表数据的篇幅可以小一些,重点放在分析图表数据变化的原因上,当然最重要的还是依照作文的direction来,即看作文题目到底让写什么,到底让怎么写,审题是最重要的)- 第一段常用表达 -1. 描述图表变化趋势的表达上升(v):increase; go up; rise; improve; grow; jump; rocket; soar; surge; shoot up(猛增); climb; ascend; leap; skyroket; proliferate上升(n):increase; rise; growth; jump; surge; upturn; leap下降(v):fall; drop; decrease; decline; go down; sink; dip;plummet; descend; diminish; dwindle; shrink; slupm; plunge; dive; nosedive下降(n):decrease, decline, fall, reduction, drop, slowdown, slump, plunge, dive, nosedive波动(v):fluctuate, vary, wave波动(n):fluctuation, variation波动(词组):range / vary from xx to xx,go up and down, ups and downs稳定在一个水平上(v):remain, keep, stay, maintain, stabilize, stagnate稳定在一个水平上(adj):stable, steady, constant, unchanged稳定在一个水平上(n):stagnation; stability; steadiness; plateau稳定在一个水平上 (词组):hove at; remain the same trend; remain stable; remain constant; reach a plateau at; stabilize at多条曲线趋势一致:A and B share the same trend; the trend of A happens to coincide with B2. 描述图表变化程度的表达变化程度很大:副词:significantly;considerably;rapidly;sharply;dramatically;drastically;enormously;substantially;markedly;steeply; greatly; massively; hugely; precipitously形容词:striking/ skyrocketing/ twofold(两倍的)/ threefold(三倍的)/ considerable/ steep词组:at an alarming rate, by/in leaps and bounds, by a wide/significant margin变化程度较轻:副词:slightly;gradually;slowly;steadily;moderately; marginally; modestly 形容词:steady/moderate/slow/slight/gradual词组:in a moderate way, by a narrow margin3. 极值类和组成构成的表达(hit/register/arrive at/stand at/increase to都可以替换掉reach)(top/summit/zenith/highest point都可以替换掉peak)eg:reach the peak of xx最低点:reach the bottom(drop/hit/register/arrive at/stand at/decrease to都可以替换掉reach)(trough/lowest point都可以替换掉bottom)eg:reach the bottom of xx占比最多:occupy the largest proportion of xxoccupy=make up=take up=account forproportion=number=percentage占比最少:occupy the smallest proportion of xxoccupy=make up=take up=account forproportion=number=percentage由…组成:comprise, consist of, be made up of,be composed of组成,构成:constitute, make up,form, occupy, account for, represent4. "大约"/"超过"/"不足"和预测类的表达方式大约:about/around/approximately/roughly/nearly/almost/just + 数字over/just under/close to/in the region of + 数字数字+ or so/or thereabouts数字+or thereabouts超过:more than + 数字over + 数字不足:no more than + 数字less than + 数字within + 数字under + 数字预测(v):expect, predict, project, forecast预测(句式):xx is expected/predicted/projected/forecasted to reach …5. "表达/阐述/说明/展示/体现"的表达方式display/represent/demonstrate/show/convey/illustrate/indicate/describe/embody/ reflect/reveal/outline/delineate/depict/expound/elaborate6. 常用句型①描述上升到多少:The mobile-phone subscriptions soared to 4 billion in 2008.②描述从多少上升到多少:Conversely, the urban population saw a risingtrend, growing from only 300 million to 680 million by 2010.③描述A的上升和B的下降:Domestic cars had a dramatic increase in the market share, as high as 9.8%, while/whereas(然而)Japanese cars declined by nearly 10%.(by+数据,就是上升/下降了多少,例如declined by nearly 10%就是下降了将近10%,to+数据,是指上升/下降到多少)④描述xx数据排第几:The amount of underground water ranks the second ,the percentage being 30.2%.⑤描述最大占比:We cannot fail to see that the biggest share is acquiring knowledge, with a proportion as high as 59.5%.We cannot fail to see that the biggest share is acquiring knowledge, accounting for 59.5%.⑥分别描述比例:Meanwhile, it is also not difficult to find that service, environment, price and other factors occupy 26.8%, 23.8%, 8.4% and 4.7% respectively(分别地).⑦描述两者之间的比较:The data show a comparison between the amountof Red wine that is consumed and the rates of US birth.In comparison with A, Bis …⑧描述倍数:A is three times as much as B …The graph shows a threefold increase in number of…The total number in 2012, which is 8,318, is about two times as much as the total number in 2008.A is twice as much as B.- 第二段常用表达 -1. 表述原因总起句There are many reasons explaining this phenomenon.Three major reasons give rise to the phenomenon mentioned above.2. 分条描述原因(主要原因)The main reason is that due to (the progress in economy / the improvement of living standards), a growing number of people ……(第二个原因)What is more, there is no doubt in saying that , with (the pace of modern society speeding up / the advance of technology) , a majority of people (try their best to catch up with the times and improve themselves)by (pursuing further education).(第三个原因)Thirdly , (under the background of modernization / with the rapid development of economy and society) , xx may have gradually become an unstoppable trend(趋势)in recent years.3. 形容大环境常用的表达方式with the progress in economywith the improvement of living standardswith the pace of modern society speeding upwith the advance of technology with the rapid development of economy and societyunder the background of modernization / urbanization / industrialization- 第三段常用表达 -积极的:Considering all these, I believe that we should take a reasonable attitude toward xx. In conclusion, from my point of view, such a phenomenon is (positive)and (acceptable).积极的:Taking into account what has been argued so far, it is not surprising to see the results in the above diagram. Thus, such phenomenon proves to be quite normal and acceptable. And I believe the trend will not change in the near future.积极的:Definitely, the boom of (the mobile industry) tends to exert a beneficial influence on people’s lives, and hence, it should be, from every aspect,encouraged and further advocated.消极的:In view of the description and analysis above, I’m convinced that actions have to be taken to cope with the problems arising from ……趋势预测:From what has been discussed above, a trend can be predicted from the chart that ……趋势预测:XX will be a growing trend in today's (busy)society.真题巩固2024年浦东新区初三一模英语作文84. Write at least 60 words according to the given situation(根据以下情境写一篇不少于60 个词的短文,标点符号不占格)学校报社做了一次有关学生如何使用零花钱的调查。
图表类英语作文范文图表类型的英语写作如果不擅于观察漫画的话,作文写出来可能会偏题。
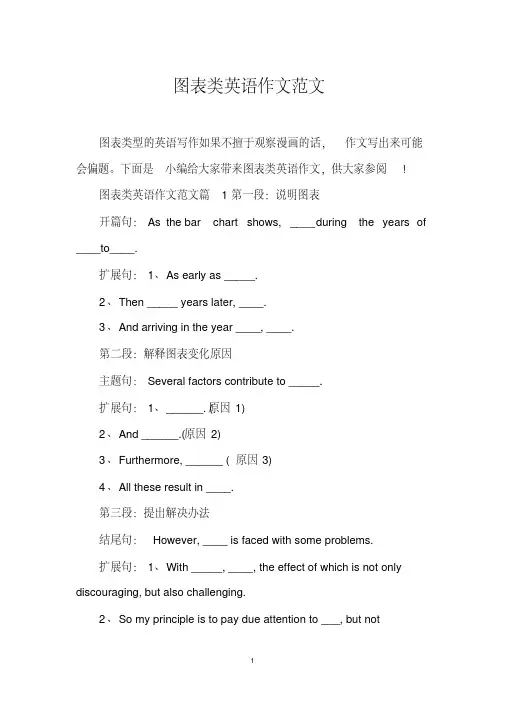
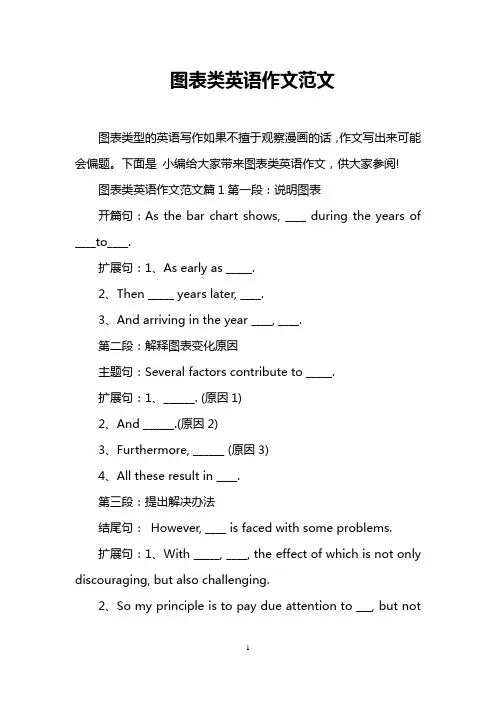
下面是小编给大家带来图表类英语作文,供大家参阅!图表类英语作文范文篇1第一段:说明图表开篇句:As the bar chart shows, ____ during the years of ____to____.扩展句:1、As early as _____.2、Then _____ years later, ____.3、And arriving in the year ____, ____.第二段:解释图表变化原因主题句:Several factors contribute to _____.扩展句:1、______. (原因1)2、And ______.(原因2)3、Furthermore, ______ (原因3)4、All these result in ____.第三段:提出解决办法结尾句:However, ____ is faced with some problems.扩展句:1、With _____, ____, the effect of which is not only discouraging, but also challenging.2、So my principle is to pay due attention to ___, but notjustto____.示范第一段:说明图表开篇句:As the bar chart shows, the number of people below the poverty line decreased dramatically during the years of 1978 to1997.扩展句:1、As early as 1978, about 250 million people were under the poverty line.2、Then seven years later, the number became three fifthsthatof1978.3、And arriving in the year 1997, the number was reducedto50millions.第二段:解释图表变化原因主题句:Several factors contribute to the sharp decrease ofthe below-poverty population.扩展句:1、The reform and opening following 1978 enabledthe peasants to become much better off. (原因1)2、And with the development of Chinese economy, that policy also improved city dwellers lives greatly. (原因2)3、Furthermore, the high-tech introduced made it possiblefor the countrys economy as a whole to take off. (原因3)4、All these result in the great fall of theChinesepopulationbelow the poverty line.第三段:提出解决办法结尾句:However, a further decrease in the number of poverty-stricken people is faced with some problems.扩展句:1、With quite few employees being laid off, the effect of which is not only discouraging, but also challenging.2、So my principle is to pay due attention to the newcomers, but not just to care for the poor, say, in remote mountain areas.范文As the bar chart shows, the number of people below thepoverty line decreased dramatically during the years of 1978to 1997. Asearly as 1978, about 250 million people were underthe poverty line.Then seven years later, the number became three fifths that of 1978.And arriving in the year 1997, the number was reduced to 50 millions.Several factors contribute to the sharp decrease of the below-poverty population. The reform and opening following1978 enabled the peasants to become much better off. And with the development of Chinese economy, that policy also improved city dwellers lives greatly. Furthermore, the high-tech introduced made it possible for the countryseconomy as a whole to take off. All these result in the great fallof the Chinese population below the poverty line.However, a further decrease in the number of poverty-stricken people is faced with some problems. With quite few employees being laid off, the effect of which is notonly discouraging, but also challenging. So my principle is topay due attention to the newcomers, but not just to care forthe poor, say, in remote mountain areas.图表类英语作文范文篇2The past years have witnessed a mounting number of Chinese scholars returning from overseas. As is lively illustrated by the column chart, the number of returnees climbed from a mere 69.3 thousand in 2008 to over 272.9 thousand in 2012, at an annual increase rate of around 50%.A multitude of factors may have led to the tendency revealed by the chart, but the following are the critical ones from my perspective. First and foremost, along with the development of Chinese economy and society, the number ofChinese studying abroad has been soaring in the past years,which has provided an expanding base for the number of returnees. In the second place, the government has enacted aseries of preferential policies to attract overseas Chinesescholars back home. Last but not least, the booming economy, science and technology in this country have generated moreattative job opportunites for scholars returning from overseas.The waves of returnees will definitely contribute to this nation’s development, since they have brought back not only advanced science and technology but also pioneering concepts of education and management. With more scholarscoming back from overseas, and with the concerted efforts ofthe whole nation, we have reasons to expect a faster rejuvenation of this country.图表类英语作文范文篇3一、图表类型基本单词图表类型:table(表格)、chart(图表)、diagram(图标)、graph(多指曲线图)、column chart(柱状图)、pie graph(饼图)、tree diagram(树形图)、饼图:pie chart、直方图或柱形图:bar chart/histogram、趋势曲线图:line chart/curve diagram、表格图:table、流程图或过程图:flow chart/sequence diagram、程序图:processing/procedures diagram二、图表描述基本词语1、描述:show、describe、illustrate、can be seen from、clear、apparent、reveal、represent2、内容:figure、statistic、number、percentage、proportion三、常用的描述句型The table/chart diagram/graph shows (that)According to the table/chart diagram/graphAs (is) shown in the table/chart diagram/graphAs can be seen from the table/chart/diagram/graph/figures,figures/statistics shows (that)……It can be seen from the figures/statisticsWe can see from the figures/statisticsIt is clear from the figures/statisticsIt is apparent from the figures/statisticstable/chart/diagram/graph figures (that) ……table/chart/diagram/graph shows/describes/illustrates看过图表类英语范文的人还。
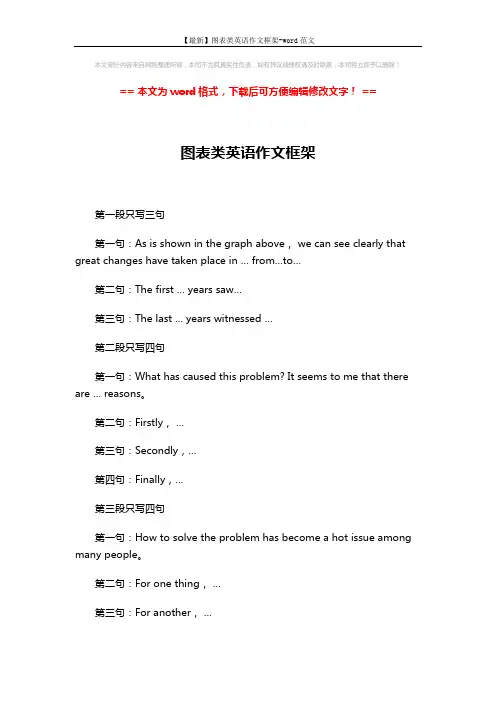
本文部分内容来自网络整理所得,本司不为其真实性负责,如有异议或侵权请及时联系,本司将立即予以删除!== 本文为word格式,下载后可方便编辑修改文字! ==图表类英语作文框架第一段只写三句第一句:As is shown in the graph above, we can see clearly that great changes have taken place in … from…to…第二句:The first … years saw…第三句:The last … years witnessed …第二段只写四句第一句:What has caused this problem? It seems to me that there are … reasons。
第二句:Firstly,…第三句:Secondly,…第四句:Finally,…第三段只写四句第一句:How to solve the problem has become a hot issue among many people。
第二句:For one thing,…第三句:For another,…第四句:Only in this way can we successfully solve the problem。
以下文字仅用于测试排版效果, 请使用时删除!当撩开窗的刹那,当推开门楣的倥偬,当抬头仰望天空时刻,秋阳光芒,总是令你防不胜防,把它光和热,幻化成清晰影子,将你打得,招架难熬,只有默默承受,从早到晚,变为它之囚徒,渴望于之脱逃。
但它还是温情脉脉,一早一晚,总会搅起微凉,让一丝丝风儿,轻轻吹拂,漫过肌肤,沁入骨髓,透进心灵,将凉之感觉和寓趣,成为相伴你欣慰舒朗。
在艳阳的秋高气爽,正以闲情逸致放飞畅想,思绪飘零,以平生芳华,一颦一笑,走出蜗居,到大自然里,旅游行走,穿街过巷,沟过河,感受秋的五彩缤纷,树木,植被,丛林,蒿草,河流,山川,田园,……一切只要人能寻觅处所,均可潇洒而去,而非徒走过场。
图表类英语作文范文图表类型的英语写作如果不擅于观察漫画的话,作文写出来可能会偏题。
下面是小编给大家带来图表类英语作文,供大家参阅!图表类英语作文范文篇1第一段:说明图表开篇句:As the bar chart shows, ____ during the years of ____to____.扩展句:1、As early as _____.2、Then _____ years later, ____.3、And arriving in the year ____, ____.第二段:解释图表变化原因主题句:Several factors contribute to _____.扩展句:1、______. (原因1)2、And ______.(原因2)3、Furthermore, ______ (原因3)4、All these result in ____.第三段:提出解决办法结尾句:However, ____ is faced with some problems.扩展句:1、With _____, ____, the effect of which is not only discouraging, but also challenging.2、So my principle is to pay due attention to ___, but notjustto____.示范第一段:说明图表开篇句:As the bar chart shows, the number of people below the poverty line decreased dramatically during the years of 1978 to1997.扩展句:1、As early as 1978, about 250 million people were under the poverty line.2、Then seven years later, the number became three fifths thatof1978.3、And arriving in the year 1997, the number was reduced to50millions.第二段:解释图表变化原因主题句:Several factors contribute to the sharp decrease of the below-poverty population.扩展句:1、The reform and opening following 1978 enabled the peasants to become much better off. (原因1)2、And with the development of Chinese economy, that policy also improved city dwellers lives greatly. (原因2)3、Furthermore, the high-tech introduced made it possible for the countrys economy as a whole to take off. (原因3)4、All these result in the great fall of theChinesepopulationbelow the poverty line.第三段:提出解决办法结尾句:However, a further decrease in the number of poverty-stricken people is faced with some problems.扩展句:1、With quite few employees being laid off, the effect of which is not only discouraging, but also challenging.2、So my principle is to pay due attention to the newcomers, but not just to care for the poor, say, in remote mountain areas.范文As the bar chart shows, the number of people below the poverty line decreased dramatically during the years of 1978 to 1997. Asearly as 1978, about 250 million people were under the poverty line.Then seven years later, the number became three fifths that of 1978.And arriving in the year 1997, the number was reduced to 50 millions.Several factors contribute to the sharp decrease of the below-poverty population. The reform and opening following 1978 enabled the peasants to become much better off. And with the development of Chinese economy, that policy also improved city dwellers lives greatly. Furthermore, the high-tech introduced made it possible for the countryseconomy as a whole to take off. All these result in the great fall of the Chinese population below the poverty line.However, a further decrease in the number of poverty-stricken people is faced with some problems. With quite few employees being laid off, the effect of which is not only discouraging, but also challenging. So my principle is to pay due attention to the newcomers, but not just to care for the poor, say, in remote mountain areas.图表类英语作文范文篇2The past years have witnessed a mounting number of Chinese scholars returning from overseas. As is lively illustrated by the column chart, the number of returnees climbed from a mere 69.3 thousand in 2008 to over 272.9 thousand in 2012, at an annual increase rate of around 50%.A multitude of factors may have led to the tendency revealed by the chart, but the following are the critical ones from my perspective. First and foremost, along with the development of Chinese economy and society, the number of Chinese studying abroad has been soaring in the past years, which has provided an expanding base for the number of returnees. In the second place, the government has enacted a series of preferential policies to attract overseas Chinesescholars back home. Last but not least, the booming economy, science and technology in this country have generated more attative job opportunites for scholars returning from overseas.The waves of returnees will definitely contribute to this nation’s development, since they have brought back not only advanced science and technology but also pioneering concepts of education and management. With more scholars coming back from overseas, and with the concerted efforts of the whole nation, we have reasons to expect a faster rejuvenation of this country.图表类英语作文范文篇3一、图表类型基本单词图表类型:table(表格)、chart(图表)、diagram(图标)、graph(多指曲线图)、column chart(柱状图)、pie graph(饼图)、tree diagram(树形图)、饼图:pie chart、直方图或柱形图:bar chart/histogram、趋势曲线图:line chart/curve diagram、表格图:table、流程图或过程图:flow chart/sequence diagram、程序图:processing/procedures diagram二、图表描述基本词语1、描述:show、describe、illustrate、can be seen from、clear、apparent、reveal、represent2、内容:figure、statistic、number、percentage、proportion三、常用的描述句型The table/chart diagram/graph shows (that)According to the table/chart diagram/graphAs (is) shown in the table/chart diagram/graphAs can be seen from the table/chart/diagram/graph/figures,figures/statistics shows (that)……It can be seen from the figures/statisticsWe can see from the figures/statisticsIt is clear from the figures/statisticsIt is apparent from the figures/statisticstable/chart/diagram/graph figures (that) ……table/chart/diagram/graph shows/describes/illustrates看过图表类英语范文的人还。
第一部分、写作模板——图表式作文It is obvious in the graphic/table that the rate/number/amount of Y has undergone dramatic changes. It has gone up/grown/fallen/dropped considerably in recent years (as X varies). At the point of X1, Y reaches its peak of …(多少).What is the reason for this change? Mainly there are … (多少) reasons behind the situation reflected in the graphic/table. First of all, …(第一个原因). More importantly, …(第二个原因). Most important of all, …(第三个原因).From the above discussions, we have enough reason to predict what will happen in the near future. The trend described in the graphic/table will continue for quite a long time (if necessary measures are not taken括号里的使用于那些不太好的变化趋势).第二部分、写作模板——提纲式作文一、说明原因型模块(一)Nowadays , there are more and more XX in some big cities . It is estimated that ( 1 ). Why have there been so many XX ? Maybe the reasons can be listed as follows.The first one is that ( 2 ) .Besides, ( 3 ) . The third reason is ( 4 ). To sum up , the main cause of XX is due to ( 5 ) .It is high time that something were done upon it. For one thing , ( 6 ). On the other hand , ( 7 ). All these measures will certainly reduce the number of XX .注释:(1)用具体数据说明XX现象;(2)原因一;(3)原因二;(4)原因三(5)指出主要原因;(6)解决建议一;(7)解决建议二。
中考英语图表类书面表达万能模板(打印背诵版)中考英语图表类书面表达万能模板(名师精选必考话题作文+剖析写作技巧,建议下载背诵)图表作文是中考英语写作中较为常见的题型之一,也是难度较大的一种写作题型。
这类作文可综合提供题目、数据、图像、提纲,形式多样,但实际上只涉及5个方面:描述图表、指明寓意、分析原因、联系实际、给出建议,而每次考试只是从这5个方面的内容中选出3个进行考查。
从写作类型来看,基本上属于说明文。
要求考生围绕题目将有关信息转化为文字形式,考生应该具有一定的数据分析和材料归纳能力,同时会运用一定的写作方法。
中考图表类作文一般有以下两种考查方式。
一、看图作文【命题形式】看图作文一般要求学生根据所给出的一幅图或几幅图所提供的信息写一篇短文。
在命题形式上,除了图的提示外,一般有英文单词提示或中文文字提示。
有的文章开头已给出。
要求书写的词数一般在80至100之间。
【写作技巧】1.审题要清看清题目要求,读懂画面内容和所陈述的含义,抓住要点,注意文体是什么。
如果是故事或日记,宜用过去时态;如果介绍物品之类的,多采用现在时态。
2.逐图列提纲看图作文所提供的材料是一幅或几幅图。
做题时,可遂图列好提纲,并运用所提供的词语。
根据图示情景并结合自己的英语水平,尽量扬长避短,避繁化简。
遇到一时想不起来的词、句时,可用同义词或同义句代替。
3.连句成文就是把第二步所写的句子,在规定的范围内稍加发挥,适当用上连词把它们串联起来整理成一篇短文。
连句成文时应注意文中动词时态的应用,简单句和复合句的交替应用。
4.复核检查按要求逐图写好句子后,认真通读写好的句子,一查所写句子是否准确表达出了所给图画的情景,行文是否流畅;二查有没有遗漏要求,句子的时态、语态是否正确,所写句子是否符合英语的基本语序,即:主语+谓语+宾语+状语(地点、时间等);三查单词的拼写、大小写是否规范,标点符号的运用是否正确,主谓语是否一致。
确定无误后,再誊写正稿。

中考英语作文万能模板(全)Unfortunately。
every coin has two sides。
The disadvantages of A can also be seen as follows。
One of the major drawbacks is -------------------(A的缺点之一)。
In n。
-----------------(A的缺点之二).2.Despite the drawbacks ned above。
I still XXX。
On the one hand。
---------------(我的观点)。
On the other hand。
-----------------(我的观点)。
Therefore。
I am XXX role in our daily life in the future.三、图表作文题型写作指导:这类题目主要考察的是考生的数据分析能力和图表描述能力。
在写作时,首先要对图表进行简单描述,然后分析图表所反映的数据,最后加以评论或总结。
写作思路:1.描述图表2.分析图表所反映的数据3.评论或总结1.As is shown in the chart / graph / table。
------------------(图表内容简述).2.According to the data / figures / statistics / percentages inthe chart / graph / table。
we can see that --------------(数据分析)。
It is us that ------------------(数据分析).3.From the chart / graph / table。
we can see that ------------------(总结或评论)。
Therefore。
it XXX ------------------(总结或评论).说明不同人的看法)A majority of people think that __第一个观点_____。
When writing an essay based on a chart,its important to follow a structured approach that allows you to clearly and effectively convey the information presented in the chart.Here is a template you can use to write a wellorganized English essay on a chart:Introduction:Begin by introducing the chart and providing a brief overview of what it represents. State the purpose of the essay,which is to analyze the data presented in the chart.Body Paragraph1:Start by discussing the first key aspect or trend that you observe in the chart.Use specific data points to support your observations.You may want to compare or contrast different elements of the chart.Body Paragraph2:Continue with the second key aspect or trend.Again,use specific data to back up your points.Discuss any patterns or relationships between different parts of the data.Body Paragraph3:If applicable,introduce a third aspect or trend.This could be a comparison between different time periods,groups,or categories as shown in the chart.Use data to illustrate how these comparisons support your analysis.Analysis:After discussing the key points,provide an analysis of why these trends or patterns might exist.Consider external factors or underlying causes that could explain the data.Conclusion:Summarize the main points discussed in the essay.Restate the significance of the chart and its implications.End with a final thought or a call to action,if appropriate for the context of the chart.Example of a Chart Essay:Title:The Rise of Renewable EnergyIntroduction:The chart illustrates the percentage of global energy production from renewable sources between2000and2020.This essay aims to analyze the trends and discuss the implications of the shift towards renewable energy.Body Paragraph1:From2000to2020,there has been a significant increase in the use of renewable energy. In2000,only15%of the global energy was produced from renewable sources,which increased to25%by2020.This growth is attributed to advancements in technology and a growing awareness of environmental issues.Body Paragraph2:The chart also shows a decline in the reliance on fossil fuels during the same period. While coal and oil accounted for70%of the energy production in2000,their share dropped to55%by2020.This trend is likely due to the increasing cost of fossil fuels and the negative environmental impact they have.Body Paragraph3:Interestingly,the chart reveals that the adoption of renewable energy varied significantly among different regions.Europe and North America showed the most significant increase in renewable energy production,while some parts of Asia and Africa still heavily rely on fossil fuels.Analysis:The shift towards renewable energy can be attributed to several ernment policies promoting clean energy,technological advancements that have made renewable energy more efficient and costeffective,and a growing public concern for climate change are all contributing to this trend.Conclusion:In conclusion,the chart clearly demonstrates a global trend towards the increased use of renewable energy.This shift is not only beneficial for the environment but also for the longterm sustainability of energy production.It is crucial for governments and industries to continue supporting and investing in renewable energy technologies to ensure a cleaner and more sustainable future.。

英语作文图表题模板Title: Template for English Essay on Graphical Representation。
Introduction:In the contemporary academic and professional landscapes, the ability to interpret and analyze graphical data is of paramount importance. Whether in scientific research, business analysis, or policy-making, proficiency in understanding and communicating insights from graphs and charts is a crucial skill. This essay aims to provide a comprehensive template for crafting responses to English essay prompts centered around graphical representation.1. Description of the Graph/Chart:The provided graph/chart depicts [describe the content of the graph/chart in detail]. It comprises [mention the elements such as axes, labels, legends, etc.].The data presented spans [mention the time period or range covered by the data].2. Overview of Trends/Patterns:Upon careful examination, several discernibletrends/patterns emerge from the graph/chart. For instance, [highlight the prominent trends or patterns observed, such as increases, decreases, fluctuations, correlations, etc.]. These trends may be influenced by [mention potentialfactors affecting the observed patterns].3. Analysis of Key Findings:Delving deeper into the data, it becomes evidentthat certain key findings warrant attention. One noteworthy observation is [describe the significant finding or insight derived from the graph/chart]. This finding suggests [provide analysis or interpretation of the finding, considering its implications or significance]. Additionally, it is important to note [mention any other significant findings or insights revealed by the data].4. Comparison and Contrast:To gain a more comprehensive understanding, it is beneficial to compare and contrast different elementswithin the graph/chart. For instance, a comparison between [mention the elements to be compared, such as different categories, time periods, regions, etc.] reveals [highlight the similarities and differences observed]. This comparison sheds light on [discuss the implications or significance of the observed similarities and differences].5. Possible Explanations and Interpretations:Considering the trends and findings elucidated by the graph/chart, it is essential to explore potential explanations and interpretations. One plausible explanation for [mention a trend or pattern] could be [provide alogical explanation supported by evidence or theory]. Furthermore, it is imperative to consider [mention any alternative explanations or interpretations that warrant consideration].6. Implications and Recommendations:The insights gleaned from the analysis of thegraph/chart have significant implications across various domains. For instance, in the context of [mention relevant field or sector], the observed trends may necessitate [propose potential actions or strategies based on the insights derived from the data]. Additionally, it iscrucial to consider the broader implications for [mention relevant stakeholders or entities] and recommend appropriate courses of action.7. Conclusion:In conclusion, the analysis of the graph/chart has provided valuable insights into [summarize the key findings and implications]. By systematically examining the data and interpreting the trends, it becomes evident that [reiterate the main conclusions drawn from the analysis]. Moving forward, it is imperative to continue leveraging graphical representation as a powerful tool for understanding andcommunicating complex information.8. References:[Include any references or sources consulted in the analysis, if applicable].This template provides a structured framework for crafting a comprehensive essay response to English prompts involving graphical representation. By following this template, one can effectively analyze and interpret graphical data, thereby enhancing their ability to communicate insights in written form.。
19 应试题型图表作文类中考英语万能黄金作文模板(通用版)第一部分应试题型图表作文类体裁解读及写法点拨体裁解读图表作文通常要求同学们根据题目所提供的图表、数据等进行分析、研究,通过一定的文字说明,弄清信息之间的关系,提炼要点,然后组织语言进行写作,有时候还要加入作者自己的观点。
这是考试中较为常见的题型之一,也是难度较大的一种写作题型。
这类作文形式多样,可综合提供题目、数据、图像、提纲等,但同学们在写作时一般是从五个方面入手,即描述图表、说明寓意、分析原因、联系实际、提出建议等,考试会从这五个方面中选出两到三个方面。
主要考查学生把图表信息转换成文字的能力,数据分析和材料归纳的能力以及写作能力,想象能力等。
写法点拨1.认真读取信息,弄清信息间的关系。
一般情况下,题目会提供多个信息或者多组数据等,我们要认真分析每一个信息和每一组数据,找准信息间的逻辑关系,把握信息的要点,点明主题。
有时候,我们可以借助题目的文字说明来帮助我们理清信息。
2.初步构思,拟定提纲。
把握了信息间的关系和要点之后,我们要在脑海中形成一个基本的框架,确定文章的体裁,是说明文还是议论文,或者是记叙文等。
3.连词成句,连句成文。
根据内容要点使用恰当的单词表达文章信息,同时要突出信息之间的关系,然后拓展成句子。
通过适当的过渡词或过渡句,把这些句子串联成文,使文章连贯、自然。
第二部分应试题型图表作文类万能黄金模板万能模板1注①点明问题②详细分析图表给出的细节信息③得出结论,提出建议模板内容可根据题目要求和具体情况取舍。
万能模板2据).(现象三)②In my opinion, (根据现象谈自己的感受或认识)注①列举数据,进行解读②提出建议模板内容可根据题目要求和具体情况取舍。
第三部分必备词汇与套用句型必备亮点词汇table n.表格chart n.图表bar chart n.柱形图figure n.数据show v.表明tell v.显示represent v.代表soar v.飞涨decline v.下降drop v.下降reduce v.减少increase v.增长suggest v.表明,显示percent n.百分比,百分数information n.信息investigation n.调查,研究necessary adj.必要的perform v.做,执行compared to/with...与······相比on the contrary 相反in contrast to相比之下as...as...和······一样······increase by...增加了······increase to...增加到······be similar to...与······相似 a quarter of...四分之一的·····be different from...与······不同a survey on...关于······的调查经典套用句型闪亮篇首句Recently,I did a survey on...最近,关于··..··我做了一个调查。