DOE试验设计模板
- 格式:doc
- 大小:110.00 KB
- 文档页数:4
DESIGN OF EXPERIMENTS TEMPLATEStep 1: State ObjectiveObjective of Experiment: Reflow profile [LED]Critical Characteristic(s): Temperature area and convey speedDesired Outcome: LED profileStep 2: Select Output Response(s)Identify the following for each output response.Desired Outcome (min., max., target):Unit of Measure:Instrument (name, MFG., model):Measurement Method(brief description):Measurement System Error (%):Alternative Measurement Method:Step 3: Select Input VariablesInput Variables - to be varied in the experimenta 2, etc. for each response. Add additional columns for more than two output responses. Expected InteractionsUncontrollable VariablesStep 4: Select Experiment TypeFull and Fractional FactorialsNumber of input variables:Blocking: (yes, no)Number of runs:Number of center points:Resolution: (R3, R4, R5, > R5)Insert base design layout: (optional)Response Surface ModelsNumber of input variables:Blocking: (yes, no)Number of runs:Number of center points:Axial Scaling: ( rotatable, orthogonal, on face, user specified)Design Type: (CCD or Box Behnken)Insert base design layout: (optional)Other Types of DesignsNumber of input variables:Blocking: (yes, no)Number of runs:Number of levels:Number of center points:Insert base design layout: (optional)Step 5 Define Experimental StrategyDefine the experimental unit:Is the process stable? (prior and during the experiment) - Yes/no Estimate Sample SizeCategorical Output ResponseUse np ≥ 5 guideline for character (categorical) data. For example, if p=.01, (1% defective); then n (sample size) ≥ 5 /.01 ≥ 500 per experimental run.Scaled Output Response1Best2Better3Average4Poor5WorstGuideline: The scale must measure the range of the variation. Example - rank the best unit a 1, rank the worst unit a 5, and so on.Randomization scheme(Examples - full randomization, hard to change input variable scheme, other)if other, briefly explain.INTERIM REPORT - Steps 1-5.Step 6: Run ExperimentThe documentation for step 6 should include the raw data.Insert data sheet with data recorded:Step 7: Fit ModelDocumentation for step 7 should include:Graphical -Numerical - Summary of Fit, Analysis of Variance, Lack of Fit, Parameter Estimates, Effect TestStep 8: Diagnose ModelDocumentation for step 8 should include residual test:Test for normalityTest for equal varianceTest for independenceTest for variance reduction factorStep 9: Interpret ModelDocumentation for step 9 should include:Prediction profiler with the input variables set at the best setting to meet theexperimental objective.Cube Plot (two level designs)Interaction PlotsContour Plot (RSM)Contour ProfilerPrediction EquationStep 10: Run ConfirmationDid the experiment confirm- yes / noRecommended next stepFINAL REPORTVerify that all the necessary information in the documentation template is entered accurately for steps 1-10. The final report may be used to present the results to a supervisor or the team.。
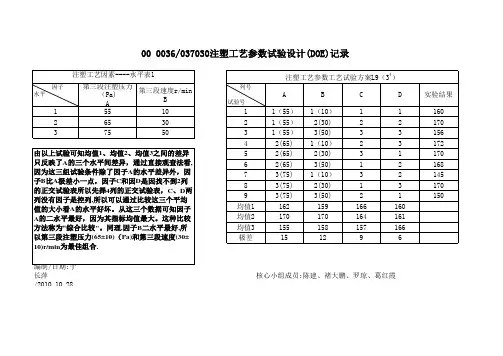

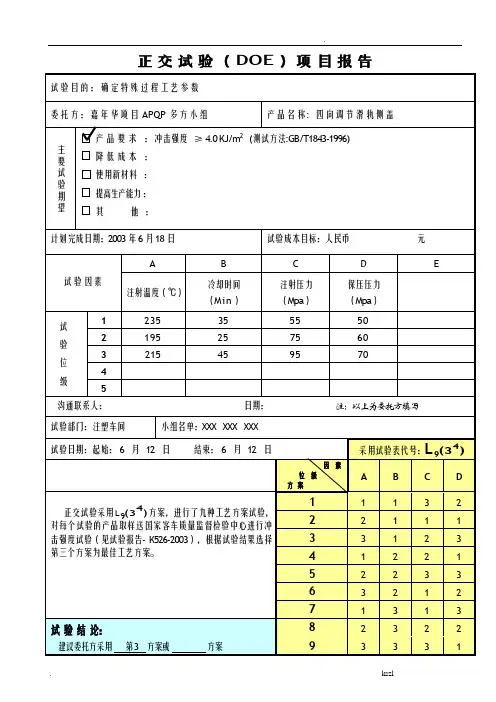
Design of Experiments(DOE)实验设计Design of Experiments(DOE)实验设计1. 定义和介绍实验设计(Design of Experiments)或设计实验(Designed Experiments)是一系列试验及分析方法集,通过有目的地改变一个系统的输入来观察输出的改变情况。
图1-1示出一个系统示意图。
图1-1中的系统既可以看作是一个产品开发过程,也可以看作是一个生产过程。
对于一个生产过程, 一般它是由一些机图1-1 一个系统示意图:Input输入; Output输出; Controllable input factors可控的输入参数 X1,X2,…,Xp; Uncontrollable inputfactors不可控的输入参数 Z1,Z2,…,Zq。
器、操作方法和操作人员所组成的,把一种输入原材料转变(加工)成某种输出产品。
这种输出产品具有一些可以观察的质量特性,也可叫响应(例如,产量、强度、硬度等)。
一些过程参数(X1,X2,…,Xp)是可控的, 例如进给速度、淬火温度等; 而另一些(Z1,Z2,…,Zq)是不可控的, 它们有时被称为噪声参数,例如环境温度、湿度等。
实验设计的目的可能包括:(1)确定哪些参数对响应的影响最大;(2)确定应把有影响的参数设定在什么水平,以使响应达到或尽可能靠近希望值(On target);(3)确定应把有影响的参数设定在什么水平,以使响应的分散度(或方差)尽可能减小。
(4)确定应把有影响的参数设定在什么水平,以使不可控参数(噪声参数)对响应的影响尽可能减小。
因此, 在制造过程的开发以及解决过程中出现的问题中都可以应用实验设计,以改善过程的性能,或者使过程对于外部波动源(干涉)不那么敏感,即得到一个“稳健”(Robust)的过程,同时还可节省时间和降低成本。
所以,实验设计对于开发和改善制造过程,提高产品质量是一个非常重要的工程工具。

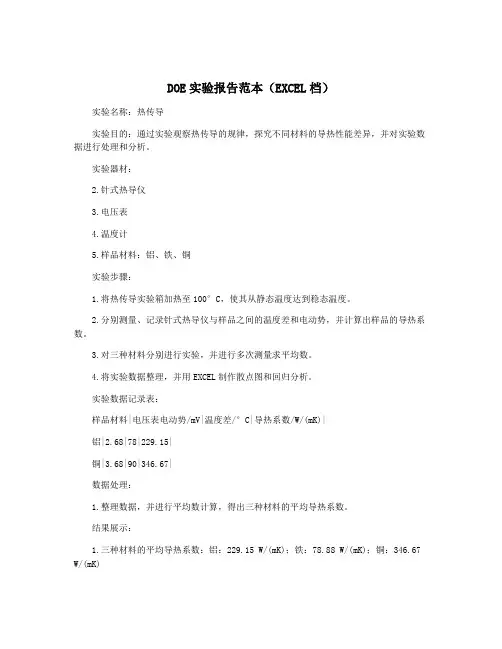
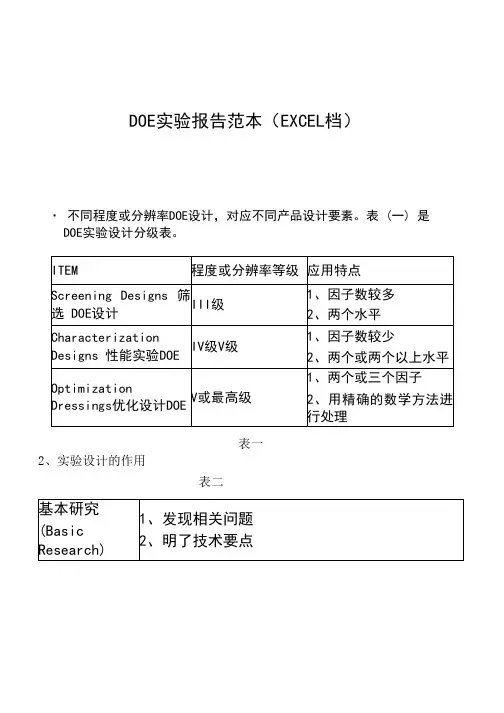
DOE实验报告范本(EXCEL档)
实验名称:热传导
实验目的:通过实验观察热传导的规律,探究不同材料的导热性能差异,并对实验数据进行处理和分析。
实验器材:
2.针式热导仪
3.电压表
4.温度计
5.样品材料:铝、铁、铜
实验步骤:
1.将热传导实验箱加热至100°C,使其从静态温度达到稳态温度。
2.分别测量、记录针式热导仪与样品之间的温度差和电动势,并计算出样品的导热系数。
3.对三种材料分别进行实验,并进行多次测量求平均数。
4.将实验数据整理,并用EXCEL制作散点图和回归分析。
实验数据记录表:
样品材料|电压表电动势/mV|温度差/°C|导热系数/W/(mK)|
铝|2.68|78|229.15|
铜|3.68|90|346.67|
数据处理:
1.整理数据,并进行平均数计算,得出三种材料的平均导热系数。
结果展示:
1.三种材料的平均导热系数:铝:229.15 W/(mK);铁:78.88 W/(mK);铜:346.67 W/(mK)
2.散点图和回归方程:
回归方程:y=0.3382x+1.2287
实验结论:
通过实验可以发现,不同材料具有不同的导热性能,这是由于材料的内部物理性质和分子结构不同所致。
铜的导热性能最好,铁次之,铝最差。
通过EXCEL制作的散点图和回归分析可以看出,实验数据符合线性关系,从而验证了导热规律。
通过本实验可以有效地提高我们对热传导的认识,并且可以运用EXCEL进行数据处理与分析。