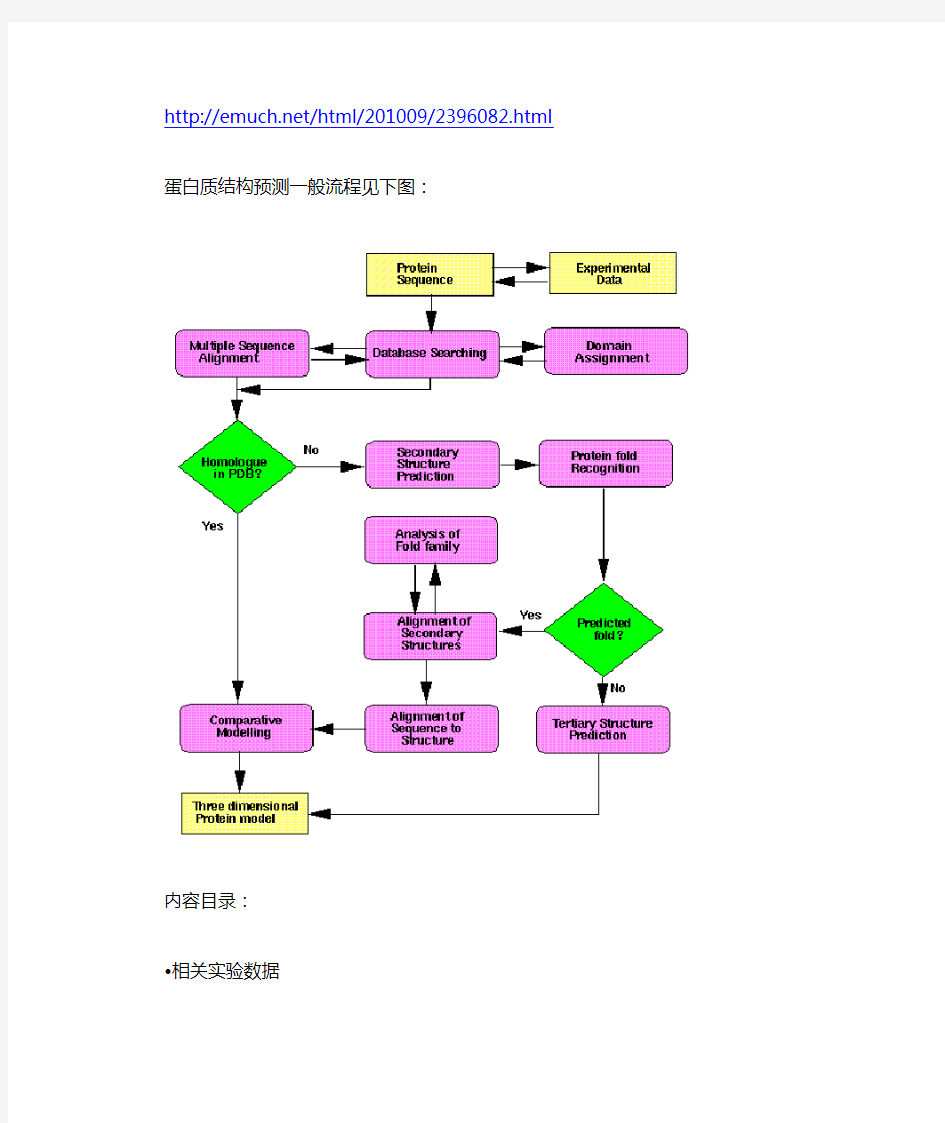

https://www.doczj.com/doc/b28610667.html,/html/201009/2396082.html 蛋白质结构预测一般流程见下图:
内容目录:
?相关实验数据
?序列数据和初步分析
?搜索序列数据库
?识别结构域
?多序列比对
?比较或同源建模
?二级结构预测
?折叠的识别
?折叠分析与二级结构比对
?序列与结构的比对
举报删除此信息广告
cnlics(站内联系TA)
实验数据
许多实验数据可以辅助结构预测过程,包括:
?二硫键,固定了半胱氨酸的空间位置
?光谱数据,可以提供蛋白的二级结构内容
?定位突变研究,可以发现活性或结合位点的残基
?蛋白酶切割位点,翻译后修饰如磷酸化或糖基化提示了残基必须是暴露的
?其他
预测时,必须清楚所有的数据。必须时刻考虑:预测与实验结果是否一致?如果不是,就有
必要修改做法。
cnlics(站内联系TA)
蛋白序列数据
对蛋白序列的初步分析有一定价值。例如,如果蛋白是直接来自基因预测,就可能包含多个结构域。更严重的是,可能会包含不太可能是球形或可溶性的区域。此流程图假设你的蛋白是可溶的,可能是一个结构域并不包含非球形结构域。
需要考虑以下方面:
?是跨膜蛋白或者包含跨膜片段吗?有许多方法预测这些片段,包括:
o TMAP (EMBL)
o PredictProtein (EMBL/Columbia)
o TMHMM (CBS, Denmark)
o TMpred (Baylor College)
o DAS (Stockholm)
?如果包含卷曲(coiled-coils)可以在COILS server 预测coiled coils 或者下载COILS 程序
(最近已经重写,注意GCG程序包里包含了COILS的一个版本)
?蛋白包含低复杂性区域?蛋白经常含有数个聚谷氨酸或聚丝氨酸区,这些地方不容易预测。
可以用SEG(GCG程序包里包含了一个版本的SEG程序)检查。
如果出现以上一种情况,就应该将序列打成碎片,或忽略序列中的特定区段,等等。这个问
题与细胞定位结构域相关。
cnlics(站内联系TA)
搜索序列数据库
分析任何新序列的第一步显然是搜索序列数据库以发现同源序列。这样的搜索可以在任何地方或者在任何计算机上完成。而且,有许多WEB服务器可以进行此类搜索,可以输入或粘贴序列到服务器上并交互式地接收结果。
序列搜索也有许多方法,目前最有名的是BLAST程序。可以容易得到在本地运行的版本(从NCBI 或者Washington University),也有许多的WEB页面允许对多基因或蛋白质序列的数据库比较蛋白质或DNA序列,仅举几个例子:
?National Center for Biot echnology Information (USA) Searches
?European Bioinformatics Institute (UK) Searches
?BLAST search through SBASE (domain database; ICGEB, Trieste)
?还有更多的站点
最近序列比较的重要进展是发展了gapped BLAST 和PSI-BLAST (position specific interat ed BLAST),二者均使BLAST更敏感,后者通过选取一条搜索结果,建立模式(profile),然后用再它搜索数据库寻找其他同源序列(这个过程可以一直重复到发现不了新的序列为止),可以探测进化距离非常远的同源序列。很重要的一点是,在利用下面章节方法之前,通过PSI-BLAST把蛋白质序列和数据库比较,找寻是否有已知结构。
将一条序列和数据库比较的其他方法有:
?FASTA软件包(William Pearson, University of Virginia, USA)
?SCANPS (Geoff Barton, European Bioinformati cs Institute, UK)
?BLITZ (Compugen's fast Smith Waterman search)
?其他方法.
It is also possible to use multiple sequence information to perform more sensitive s
earches. Essentially this involves building a profile from some kind of multiple seque nce alignment. A profile essentially gives a score for each type of amino acid at ea ch position in the sequence, and generally makes searches more sentive. Tools for doing this include:
?PSI-BLAST (NCBI, Washington)
?ProfileScan Server (ISREC, Geneva)
?HMMER 隐马氏模型(Sean Eddy,Washington University)
?Wise package (Ewan Birney,Sanger Centre;用于蛋白质对DNA的比较)
?其他方法.
A different approach for incorporating multiple sequence information into a database search is to use a MOTIF. Instead of giving every amino acid some kind of score at every position in an alignment, a motif ignores all but the most invariant position s in an alignment, and just describes the key residues that are conserved and defin e the family. Sometimes this is called a "signature". For example, "H--x--x-G-x(5)--H -x(3)-" describes a family of DNA binding proteins. It can be translated as "histidine, followed by either a phenylalanine or tryptophan, followed by an amino acid (x), f ollowed by leucine, isoleucine, valine or methionine, followed by any amino acid (x), followed by glycine,... ".
PROSITE (ExPASy Geneva) contains a huge number of such patterns, and several si tes allow you to search these data:
?ExPASy
?EBI
It is best to search a few different databases in order to find as many homologues as possible. A very important thing to do, and one which is sometimes overlooked, is to compare any new sequence to a database of sequences for which 3D structu re information is available. Whether or not your sequence is homologous to a protei n of known 3D structure is not obvious in the output from many searches of large sequence databases. Moreover, if the homology is weak, the similarity may not be apparent at all during the search through a larger database.
One last thing to remember is that one can save a lot of time by making use of pr e-prepared protein alignments. Many of these alignments are hand edited by expert s on the particular protein families, and thus represent probably the best alignment one can get given the data they contain (i.e. they are not always as up to date as the most recent sequence databases). These databases include:
?SMART (Oxford/EMBL)
?PFAM (Sanger Centre/Wash-U/Karolinska Intitutet)
?COGS (NCBI)
?PRINTS (UCL/Manchester)
?BLOCKS (Fred Hutchinson Cancer Research Centre, Seatle)
?SBASE (ICGEB, Trieste)
通常把蛋白质序列和数据比较都有很多的方法,这些对于识别结构域非常有用。
cnlics(站内联系TA)
确定结构域
If you have a sequence of more than about 500 amino acids, you can be nearly ce rtain that it will be divided into discrete functional domains. If possible, it is prefera ble to split such large proteins up and consider each domain separately. You can pr edict the locatation of domains in a few different ways. The methods below are giv en (approximately) from most to least confident.
?If homology to other sequences occurs only over a portion of the probe se quence and the other sequences are whole (i.e. not partial sequences), then this pr ovides the strongest evidence for domain structure. You can either do database sea rches yourself or make use of well-curated, pre-defined databases of protein domain s. Searches of these databases (see links below) will often assign domains easily. o SMART (Oxford/EMBL)
o PFAM (Sanger Centre/Wash-U/Karolinska Intitutet)
o COGS (NCBI)
o PRINTS (UCL/Manchester)
o BLOCKS (Fred Hutchinson Cancer Research Centre, Seatle)
o SBASE (ICGEB, Trieste)
You can also find domain descriptions in the annotations in SWISSPROT. ?Regions of low-complexity often separate domains in multidomain proteins. L ong stretches of repeated residues, particularly Proline, Glutamine, Serine or Threoni ne often indicate linker sequences and are usually a good place to split proteins int o domains.
Low complexity regions can be defined using the program SEG which is generally a vailable in most BLAST distributions or web servers (a version of SEG is also contai ned within the GCG suite of programs).
?Transmembrane segments are also very good dividing points, since they can easily separate extracellular from intracellular domains. There are many methods fo r predicting these segments, including:
o TMAP (EMBL)
o PredictProtein (EMBL/Columbia)
o TMHMM (CBS, Denmark)
o TMpred (Baylor College)
o DAS (Stockholm)
?Something else to consider are the presence of coiled-coils. These unusual s tructural features sometimes (but not always) indicate where proteins can be divide d into domains. You can predict coiled coils at the COILS server or you can downlo ad the COILS program (recently re-written by me of all people; a version of SEG is also contained within the GCG suite of programs).
?Secondary structure prediction methods (see below) will often predict region s of proteins to have different protein structural classes. For example one region of sequence may be predicted to contain only lpha helices and another to contain onl y beta sheets. These can often, though not always, suggest likely domain structure (e.g. an all alpha domain and an all beta domain)
If you have separated a sequence into domains, then it is very important to repeat
all the database searches and alignments using the domains separately. Searches with sequences containing several domains may not find all sub-homologies, particul arly if the domains are abundent in the database (e.g. kinases, SH2 domains, etc.). There may also be "hidden" domains. For example if there is a stretch of 80 amin o acids with few homologues nested in between a kinase and an SH2 domain, then you may miss matches found when searching the whole sequence against a datab ase.
Anyway, here is my slide from the talk related to this subject:
cnlics(站内联系TA)
多序列比对
Regardless of the outcome of your searches, you will want a multiple sequence alig nment containing your sequence and all the homologues you have found above. Some sites for performing multiple alignment:
?EBI (UK) Clustalw Server
?IBCP (France) Multalin Server
?IBCP (France) Clustalw Server
?IBCP (France) Combined Multalin/Clustalw
?MSA (USA) Server
?BCM Multiple Sequence Alignment ClustalW Sever (USA)
If you are going to do a lot of alignments, then it is probably best to get your ow n copy of one of many programs, some FTP sites for some of these are: ?HMMer (HMM method, Wash U)
?SAM (HMM method, Santa Cruz)
?ClustalW (EBI,UK)
?ClustalW (USA)
?MSA (USA)
?AMPS (UK)
Note that PileUp is contained within the GCG commercial package. Most institutions
with people doing this sort of work will have access to this software, so ask around if you want to use it.
Probably the most important advance since these pages first appeared are Hidden Markov Models for sequence alignment. Several methods are listed above. Alignments can provide:
?Information as to protein domain structure
?The location of residues likely to be involved in protein function ?Information of residues likely to be buried in the protein core or exposed to solvent
?More information than a single sequence for applications like homology mod elling and secondary structure prediction.
Some tips
?Don't just take everything found in the searches and feed them directly into the alignment program. Searches will almost always return matches that do not in dicate a significant sequence similarity. Look through the output carefully and throw things out if they don't appear to be a member of the sequence family. Inclusion of non-members in your alignment will confuse things and likely lead to errors late r.
?Remember that the programs for aligning sequences aren't perfect, and do not always provide the best alignment. This is particularly so for large families of pr oteins with low sequence identities. If you can see a better way of aligning the seq uences, then by all means edit the alignment manually.
cnlics(站内联系TA)
比较或同源建模
如果蛋白序列和已知三维结构的其他蛋白有显著的相似性,就可以通过同源建模的方法获得这个蛋白相当精确的3D结构。It is also possible to build models if you have found a suitable fold via fold recognition and are happy with the alignment of sequence to s tructure (Note that the accuracy of models constructed in this manner has not been
assessed properly, so treat with caution).
It is possible now to generate models automatically using the very useful SWISSMO DEL server.
Some other sites useful for homology modelling include:
?WHAT IF (G. Vriend, EMBL, Heidelberg)
?MODELLER (A. Sali, Rockefeller University)
?MODELLER Mirror FTP site
Sequence alignments, particularly those involving proteins having low percent sequen ce identities can be inacurrate. If this is the case, then a model built using the alig nment will obvious be wrong in some places. I would suggest that you look over th e alignment carefully before building a model.
Note that when using SWISSMODEL it is possible to send in a protein sequence onl y. I would only recommend doing this if the degree of sequence homology is high (50% or greater) for the above reasons. It is best, particularly if one has edited an alignment, to send an alignment directly to the server.
Once you have a three-dimensional model, it is useful to look at protein 3D structur es. There are numerous free programs for doing this, including:
?GRASP Anthony Nicholls, Columbia, USA.
?MolMol Reto Koradi, ETH, Zurrich, C.H.
?Prepi Suhail Islam, ICRF, U.K.
?RasMol Roger Sayle, Glaxo, U.K.
Most places with groups studying structural biology also have commercial packages, such as Quanta, SYBL or Insight, which contain more features than the visualisation packages described above. Crystallographers also tend to use O and FRODO, thoug h these require a lot of experience to use with ease.
cnlics(站内联系TA)
二级结构预测方法和链接
有许多做结构预测的WEB服务器,下面是简单的总括:
?PSI-pred (PSI-BLAST profiles used for prediction; David Jones, Warwick) ?JPRED Consensus prediction (includes many of the methods given below; Cu ff & Barton, EBI)
?DSC King & Sternberg (本服务器)
?PREDATORFrischman & Argos(EMBL)
?PHD home page Rost & Sander,EMBL,Germany
?ZPRED server Zvelebil et al.,Ludwig,U.K.
?nnPredict Cohen et al,UCSF,USA.
?BMERC PSA Server Boston University,USA
?SSP (Nearest-neighbor) Solovyev and Salamov,Baylor College,USA.
With no homologue of known structure from which to make a 3D model, a logical next step is to predict secondary structure. Although they differ in method, the aim of secondary structure prediction is to provide the location of alpha helices, and be ta strands within a protein or protein family.
单条序列的方法
二级结构预测已经存在约1/4世纪了,早期的方法受制于缺乏数据,仅对单条序列进行预测,而不是对同源序列家族,而且能得到数据的已知3D结构较少。早期最有名的方法是Chou & Fasman,Garnier,Osguthorbe & Robson (GOR)以及Lim。尽管作者开始声称准确率很高(70-80 %),仔细检查后,这些方法仅有56 到60%的准确率(Kabsch & Sander,1 984,见下)。早期预测二级结构的一个问题是An early problem in secondary structure prediction had been the inclusion of structures used to derive parameters in the se t of structures used to assess the accuracy of the method.
关于主题的一些好的参考资料:
?对单条序列的早期方法Early methods on single sequences
o Chou, P.Y. & Fasman, G.D. (1974). Biochemistry, 13, 211-222.
o Lim, V.I. (1974). Journal of Molecular Biology, 88, 857-872.
o Garnier, J., Osguthorpe, D.~J. \& Robson, B. (1978).Journal of Molecular Bi ology, 120, 97-120.
o Kabsch, W. & Sander, C. (1983). FEBS Letters, 155, 179-182. (An assessme
nt of the above methods)
?Later methods on single sequences
o Deleage, G. & Roux, B. (1987). Protein Engineering , 1, 289-294 (DPM)
o Presnell, S.R., Cohen, B.I. & Cohen, F.E. (1992). Biochemistry, 31, 983-993. o Holley, H.L. & Karplus, M. (1989). Proceedings of the National Academy of Science, 86, 152-156.
o King, R. & Sternberg, M. J.E. (1990). Journal of Molecular Biology, 216, 441 -457.
o D. G. Kneller, F. E. Cohen & R. Langridge (1990) Improvements in Protein Secondary Structure Prediction by an Enhanced Neural Network, Journal of Molecular Biology, 214, 171-182. (NNPRED)
Recent improvments
The availability of large families of homologous sequences revolutionised secondary s tructure prediction. Traditional methods, when applied to a family of proteins rather than a single sequence proved much more accurate at identifying core secondary s tructure elements. The combination of sequence data with sophisticated computing t echniques such as neural networks has lead to accuracies well in excess of 70 %. Though this seems a small percentage increase, these predictions are actually much more useful than those for single sequence, since they tend to predict the core ac curately. Moreover, the limit of 70-80% may be a function of secondary structure v ariation within homologous proteins.
Automated methods
There are numerous automated methods for predicting secondary structure from mu ltiply aligned protein sequences. Some good references on the subject include (the acronyms in parentheses given after each reference refer to the associated WWW s ervers, given below):
?Zvelebil, M.J.J.M., Barton, G.J., Taylor, W.R. & Sternberg, M.J.E. (1987). Pre diction of Protein Secondary Structure and Active Sites Using the Alignment of Hom ologous Sequences Journal of Molecular Biology, 195, 957-961. (ZPRED)
?Rost, B. & Sander, C. (1993), Prediction of protein secondary structure at b etter than 70 % Accuracy, Journal of Molecular Biology, 232, 584-599. PHD) ?Salamov A.A. & Solovyev V.V. (1995), Prediction of protein secondary sturct ure by combining nearest-neighbor algorithms and multiply sequence alignments. Jou rnal of Molecular Biology, 247,1 (NNSSP)
?Geourjon, C. & Deleage, G. (1994), SOPM : a self optimised prediction meth od for protein secondary structure prediction. Protein Engineering, 7, 157-16. (SOPM A)
?Solovyev V.V. & Salamov A.A. (1994) Predicting alpha-helix and beta-strand segments of globular proteins. (1994) Computer Applications in the Biosciences,10,66 1-669. (SSP)
?Wako, H. & Blundell, T. L. (1994), Use of amino-acid environment-depdende nt substitution tables and conformational propensities in structure prediction from ali gned sequences of homologous proteins. 2. Secondary Structures, Journal of Molecul ar Biology, 238, 693-708.
?Mehta, P., Heringa, J. & Argos, P. (1995), A simple and fast approach to pr ediction of protein secondary structure from multiple aligned sequences with accurac y above 70 %. Protein Science, 4, 2517-2525. (SSPRED)
?King, R.D. & Sternberg, M.J.E. (1996) Identification and application of the c oncepts important for accurate and reliable protein secondary structure prediction. P rotein Sci,5, 2298-2310. (DSC).
Nearly all of these now run via the world wide web. For individual details, see the papers for the individual methods, or click on the underlined acronyms given after most of the references given above (note that you can also run the methods by go ing to the approriate WWW site).
Manual intervention
It has long been recognised that patterns of residue conservation are indicative of p articular secondary structure types. Alpha helices have a periodicity of 3.6, which m eans that for helices with one face buried in the protein core, and the other expos
ed to solvent, will have residues at positions i, i+3, i+4 & i+7 (where i is a residue in an a helix) will lie on one face of the helix. Many alpha helices in proteins are amphipathic, meaning that one face is pointing towards the hydrophobic core and t he other towards the solvent. Thus patterns of hydrophobic residue conservation sh owing the i, i+3, i+4, i+7 pattern are highly indicative of an alpha helix.
For example, this helix in myoglobin has this classic pattern of hydrophobic and pol ar residue conservation (i = 1):
Similarly, the geometry of beta strands means that adjacent residues have their side chains pointing in oppposite directions. Beta strands that are half buried in the pro tein core will tend to have hydrophobic residues at positions i, i+2, i+4, i+8 etc, a nd polar residues at positions i+1, i+3, i+5, etc.
For example, this beta strand in CD8 shows this classic pattern:
Beta strands that are completely buried (as is often the case in proteins containing both alpha helices and beta strands) usually contain a run of hydrophobic residues, since both faces are buried in the protein core.
This strand from Chemotaxis protein CheY is a good example:
The principle behind most manual secondary structure predictions is to look for patt erns of residue conservation that are indicative of secondary structures like those sh own above. It has been shown in numerous successful examples that this strategy often leads to nearly perfect predictions. The work of Barton et al, Nierman & Krisc hner, Bazan and Benner & co-workers provide good starting points for getting doing this sort of work oneself. Some useful references are:
?Recent reviews on the subject (and on secondary structure prediction gener ally) See also references therein
o Rost, B., Schneider, R. & Sander, C. (1993), Trends in Biochemical Sciences, 18, 120-123.
o Benner, S. A., Gerloff, D. L. & Jenny, T. F. (1994), Science, 265, 1642-164 4.
o Barton, G. J. (1995), Protein Secondary Structure Prediction, Current Opinion in Structural Biology,5, 372-376.
o Russell, R. B. & Sternberg, M. J. E. (1995), Protein Structure Prediction: Ho w Good Are We?, Current Biology, 5, 488-490.
?Some guides for predicting structure:
o Benner, S. A. (1989), Patterns of divergence in homolgous proteins as indic ators of tertiary and quaternary structure, Advances in Enzyme Regulation, 31, 219-236.
o Benner, S. A. (1992), Predicting de novo the folded structure of proteins, C urrent Opinion in Structural Biology, 2, 402-412.
?Some particular examples of protein secondary structure predictions:
o Crawford, I. P., Niermann, T. & Kirschner, K. (1987), Predictions of seconda ry structure by evolutionary comparison: Application to the alpha subunit of tryptoph an synthase, PROTEINS: Structure, Function and Genetics, 1, 118-129.
o Bazan, J. F. (1990), Structural Design and Molecular Evolution of a Cytokine Receptor Superfamily,Proceedings of the National Academy of Science, 87, 6934-69 38.
o Benner, S. A. & Gerloff, D. (1990), Patterns of Divergence in Homologous P roteins and tertiary structure. A prediction of the structure of the catalytic domain o f protein kinases, Advances in Enzyme Regulation, 31, 121-181.
o Jenny, T. F. & Benner, S. A. (1994) A prediction of the secondary structure of the pleckstrin homology domain, A prediction of the secondary structure of the pleckstrin homology domain, PROTEINS: Structure, Function and Genetics, 20, 1-3. o Benner, S. A., Badcoe, I., Cohen, M. A. and Gerloff, D. L. (1993) Predicted secondary structure for the src homology 3 domain, Journal of Molecular Biology, 22 9, 295-305.
o Gerloff, D. L., Jenny, T. F., Knecht, L. J., Gonnet, G.H. & Benner, S. A. (19
93), The nitrogenase MoFe protein. A secondary structure prediction. FEBS Letters, 318, 118-124.
o Gerloff, D. L., Chelvanayagam, G. & Benner, S. A. (1995), A predicted cons ensus structure for the protein-kinase c2 homology (c2h) domain, the repeating unit of synaptotagmin, PROTEINS: Structure, Function and Genetics, 22, 299-310.
o Barton, G. J., Newman, R. H., Freemont, P. F. & Crumpton, M. J. (1991), A mino acid sequence analysis of the annexin super-gene family of proteins, European Journal of Biochemistry, 198, 749-760.
o Russell, R. B., Breed, J. & Barton, G. J., (1992) Conservation analysis and s econdary structure prediction of the SH2 family of phosphotyrosine binding domains, FEBS Letters, 304, 15-20.
o Livingstone, C. D. & Barton, G. J. (1994), Secondary structure prediction fro m multiple sequence data: Blood clotting factor XII and Yersinia protein tyrosine ph osphatase, International Journal of Peptide and Protein Research
o Barton, G. J., Barford, D. A. & Cohen, P. T. (1994), European Journal of Bi ochemsitry, 220, 225-237.
o Perkins, S. J., Smith K. F., Williams, S. C., Haris, P. I., Chapman, D. & Sim, R. B. (1994), The secondary structure of the von Willebrand Factor Type A Domai n in Factor B of Human Complement by Fourier Transform Infrared Spectroscopy, J ournal of Molecular Biology, 238, 104-119.
o Edwards, Y. J. K. & Perkins, S. J., (1995) The protein fold of the von Wille brand factor type A is predicted to be similar to the open twisted beta-sheet flanke d by alpha-helices found in human ras-p21, 358, 283-286.
o Lupas, A., Koster, A. J., Walz, J. & Baumeister, W. (1994) Predicted second ary structure of the 20S proteasome and model structure of the putative peptide ch annel, FEBS Letters, 354, 45-49.
A strategy for secondary structure prediction
In practice, I recommend getting as many state-of-the-art prediction approaches as possible and combining this with some human insight to give a consensus prediction
for the family. If you then align all of your predictions (including ideas you have b ased on residue conservation) with your multiple sequence alignment you can get a consensus picture of the structure. For example, here is part of an alignment of a family of proteins I looked at recently:
In this figure, three automated secondary structure predictions (PHD, SOPMA and S SPRED) appear below the alignment of 12 glutamyl tRNA reductase sequences. Posit ions within the alignment showing a conservation of hydrophobic side-chain characte r are shown in yellow, and those showing near total conservation of non-hydrophobi c residues (often indicative of active sites) are coloured green.
Predictions of accessibility performed by PHD (PHD Acc. Pred.) are also shown (b = buried, e = exposed), as is a prediction I performed by looking for patterns indica tive of the three secondary structure types shown above. For example, positions (wi thin the alignment) 38-45 exhibit the classical amphipathic helix pattern of hydropho bic residue conservation, with positions i, i+3, i+4 and i+7 showing a conservation of hydrophobicity, with intervening positions being mostly polar. Positions 13-16 com prise a short stretch of conserved hydrophobic residues, indicative of a beta-strand, similar to the example from CheY protein shown above.
By looking for these patterns I built up a prediction of the secondary structure for most regions of the protein. Note that most methods - automated and manual - ag ree for many regions of the alignment.
Given the results of several methods of predicting secondary structure, one can buil d up a consensus picture of the secondary structure, such as that shown at the bot tom of the alignment above.
Note that you can get predictions like the above (i.e. consensus predictions) from t he very useful JPRED server.
cnlics(站内联系TA)
折叠识别方法及其链接
一些折叠识别方法的链接(仅列名称):
?通过web网运行的方法:
o 3D-pssm (本站)
o TOPITS (EMBL)
o UCLA-DOE Structre Prediction Server (UCLA)
o 123D
o UCSC HMM (UCSC)
o FAS (Burnham Institute)
?有可执行程序或代码的方法:
o THREADER(Warwick)
o ProFIT CAME (Salzburg)
?其他相关链接:
o Protein Structure Prediction Centre (US)
o CASP1
o CASP2
o CASP3
o UCLA-DOE Fold-Recognition Benchmark Home Page
即使不存在已知3D结构的同源蛋白,仍然可能通过折叠识别方法,从已知的3D结构中找到未知蛋白最接近的折叠。
3D结构的相似性:
目前(真正意义上的)从头预测蛋白质3D结构仍然是不可能的,在较短的将来也不可能找到识别折叠的一般性方法。但是,长期以来人们就意识到,即使没有显著的序列或功能上的相似性,蛋白质常常采取相似的折叠,
Ab initio prediction of protein 3D structures is not possible at present, and a genera l solution to the protein folding problem is not likely to be found in the near future. However, it has long been recognised that proteins often adopt similar folds despit e no significant sequence or functional similarity and that nature is apparently restri cted to a limited number of protein folds.
There are numerous protein structure classifications now available via the WWW: ?SCOP (MRC Cambridge)
?CATH (University College, London)
?FSSP (EBI, Cambridge)
? 3 Dee (EBI, Cambridge)
?HOMSTRAD (Biochemistry, Cambridge)
?VAST (NCBI, USA)
Thus for many proteins (~ 70%) there will be a suitable structure in the database from which to build a 3D model. Unfortuantely, the lack of sequence similarity will mean that many of these go undetected until after 3D structure determination. The goal of fold recognition
Methods of protein fold recognition attempt to detect similarities between protein 3D structure that are not accompanied by any significant sequence similarity. There ar e many approaches, but the unifying theme is to try and find folds that are compat able with a particular sequence. Unlike sequence-only comparison, these methods ta ke advantage of the extra information made available by 3D structure information. I n effect, the turn the protein folding problem on it's head: rather than predicting h ow a sequence will fold, they predict how well a fold will fit a sequence.
部分相关文章(略)
The structure was correctly predicted to adopt a ras-p21 type fold
The realities of fold recognition
Despite initially promising results, methods of fold recognition are not always accura te. Guides to the accuracy of protein fold recognition can be found in the proceedin gs of the Critical Assessment of Structure Predictions (CASP) conferences. At the firs t meeting in 1994 (CASP1) the methods were found to be about 50 % accurate at best with respect to their ability to place a correct fold at the top of a ranked list. Though many methods failed to detect the correct fold at the top of a ranked list, a correct fold was often found in the top 10 scoring folds. Even when the methods were successful, alignments of sequence on to protein 3D structure were usually in correct, meaning that comparative modelling performed using such models would be inaccurate.
The CASP2 meeting held in December 1996, showed that many of the methods had improved, though it is difficult to compare the results of the two assessments (i.e. CASP1 & CASP2) since very different criteria were used to assess correct answers. It would be foolish and over-ambitious for me to present a detailed assessment of t he results here. However, and important thing to note, was that Murzin & Bateman managed to attain near 100% success by the use of careful human insight, a kno wledge of known structures, secondary structure predictions and thoughts about the function of the target sequences. Their results strongly support the arguments give n below that human insight can be a powerful aid during fold recognition. A summ ary of the results from this meeting can be found in the PROTEINS issue dedicated to the meeting (PROTEINS, Suppl 1, 1997).
The CASP3 meeting was held in December 1998. It showed some progress in the a bility of fold recognition methods to detect correct protein folds and in the quality o f alignments obtained. A detailed summary of the results will appear towards the en d of 1999 in the PROTEINS supplement.
For my talk, I did a crude assessment of 5 methods of fold recognition. I took 12 proteins of known structure (3 from each folding class) an ran each of the five met hods using default parameters. I then asked how often was a correct fold (not allo wing trival sequence detectable folds) found in the first rank, or in the top 10 scori ng folds. I also asked how often the method found the correct folding class in the first rank. The results are summarised in here in a PostScript file.
Perhaps the worst result from this study is shown below:
One method suggested that the sequence for the Probe (left) (a four helix bundle) would best fit onto the structure shown on the right (an OB fold, comprising a six stranded barrel).
The results suggest that one should use caution when using these methods. In spit e of this, the methods remain very useful.
A practical approach:
Although they are not 100 % accurate, the methods are still very useful. To use th e methods I would suggest the following:
?Run as many methods as you can, and run each method on as many sequ ences (from your homologous protein family) as you can. The methods almost alwa ys give somewhat different answers with the same sequences. I have also found th at a single method will often give different results for sets of homologous sequence s, so I would also suggest running each method on as many homologoues as possi ble. After all of these runs, one can build up a consensus picture of the likely fold in a manner similar to that used for secondary structure prediction above. ?Remember the expected accuracy of the methods, and don't use them as bl ack-boxes. Remember that a correct fold may not be at the top of the list, but tha t it is likely to be in the top 10 scoring folds.
?Think about the function of your protein, and look into the function of the proteins that have been found by the various methods. If you see a functional simil arity, then you may have detected a weak sequence homologue, or remote homolo gue. At CASP2, as said above, Murzin & Bateman managed to obtain remarkably ac curate predictions by identification of remote homologues. Their paper appeard in th e PROTEINS supplement for the CASP2 experiment:
Murzin AG, Bateman A (1997) Distant homology recognition using structural classific ation of proteins Proteins, Suppl 1, 105-112.
and provides some key insights into protein fold recognition using humans rather th an computers.
?Don't trust the alignments that are output by the programs. They can be u sed as a starting point, but the best alignment of sequence on to tertiary structure is still likely to come from careful human intervention. One strategy for doing this i s discussed in the next section
cnlics(站内联系TA)
Analysis of protein folds and alignment of secondary structure elements
________________________________________
蛋白质结构解析的方法对比综述 工程硕士李瑾 摘要:到目前为止,蛋白质结构解析的方法主要是两种,x射线衍射法和NMR法,这两种方法各有优点和不足。 关键词:x射线衍射法 NMR法 到目前为止,蛋白质结构解析的方法主要是两种,x射线衍射法和NMR法。其中X射线的方法产生的更早,也更加的成熟,解析的数量也更多,第一个解析的蛋白的结构,就是用x晶体衍射的方法解析的。而NMR方法则是在90年代才成熟并发展起来的。这两种方法各有优点和不足[1]。 首先是X射线晶体衍射法。该方法的前提是要得到蛋白质的晶体。通常是将表达目的蛋白的基因经PCR扩增后克隆到一种表达载体中,然后转入大肠杆菌中诱导表达,目的蛋白提纯之后摸索结晶条件,等拿到晶体之后,将晶体进行x射线衍射,收集衍射图谱,通过一系列的计算,得到蛋白质的原子结构[2]。 x射线晶体衍射法的优点是:速度快,通常只要拿到晶体,最快当天就能得出结构,另外不受肽链大小限制,无论是多大分子量的蛋白质或者RNA、DNA,甚至是结合多种小分子的复合体,只要能够结晶就能够得到其原子结构。所以x射线方法解析蛋白的关键是摸索蛋白结晶的条件。该方法得到的是蛋白质分子在晶体状态下的空间结构,这种结构与蛋白质分子在生物细胞内的本来结构有较大的差别。晶体中的蛋白质分子相互间是有规律地、紧密地排列在一起的,运动性较差;而自然界的生物细胞中的蛋白质分子则是处于一种溶液状态,周围是水分子和其他的生物分子,具有很好的运动性。而且,有些蛋白质只能稳定地存在于溶液状态,无法结晶[2]。 核磁共振NMR(nuclear magnetic resonance)现象很早就被科研人员观察到了,但将这种方法用来解析蛋白质结构,却是近一二十年的事情。NMR法具体原理是对水溶液中的蛋白质样品测定一系列不同的二维核磁共振图谱,然后根据已确定的蛋白质分子的一级结构,通过对各种二维核磁共振图谱的比较和解析,在图谱上找到各个序列号氨基酸上的各种氢原子所对应的峰。有了这些被指认的峰,就可以根据这些峰在核磁共振谱图上所呈现的相互之间的关系得到它们所对应的氢原子之间的距离。[3]可以想象,正是因为蛋白质分子具有空间结构,在序列上相差甚远的两个氨基酸有可能在空间距离上是很近的,它们所含的氢原子所对应的NMR峰之间就会有相关信号出现[4] 。通常,如果两个氢原子之间距离小于0.5纳米的话,它们之间就会有相关信号出现。一个由几十个氨基酸残基组成的蛋白质分子可以得到几百个甚至几千个这样与距离有关的信号,按照信号的强弱把它们转换成对应的氢原子之间的距离,然后运用计算机程序根据所得到的距离条件模拟出该蛋白质分子的空间结构。该结构既要满足从核磁共振图谱上得到的所有距离条件,还要满足化学上有关原子与原子结合的一些基本限制条件,如原子间的化学键长、键角和原子半径等[4]。 NMR解析蛋白结构常规步骤如下:首先通过基因工程的方法,得到提纯的目的蛋白,在蛋白质稳定的条件下,将未聚合,而且折叠良好的蛋白样品(通常是1mM-3mM,500ul,PH6-7的PBS)装入核磁管中,放入核磁谱仪中,然后由写好的程序控制谱仪,发出一系列的电磁波,激发蛋白中的H、13N、13C原子,等电磁波发射完毕,再收集受激发的原子所放出的“能量”,通过收集数据、谱图处理、电脑计算从而得到蛋白的原子结构[5] [6]。 用NMR研究蛋白质结构的方法,可以在溶液状态进行研究,得到的是蛋白质分子在溶液中的结构,这更接近于蛋白质在生物细胞中的自然状态[7]。此外,通过改变溶液的性质,还可以模拟出生物细胞内的各种生理条件,即蛋白质分子所处的各种环境,以观察这些周围环境的变化对蛋白质分子空间结构的影响。在溶液环境中,蛋白质分子具有与自然环境中类
三种分析蛋白结构域(Domains)的方法 1,SMART入门,蛋白结构和功能分析 SMART介绍 SMART (a Simple Modular Architecture Research Tool) allows the identification and annotation of genetically mobile domains and the analysis of domain architectures. More than 500 domain families found in signalling, extracellular and chromatin-associated proteins are detectable. These domains are extensively annotated with respect to phyletic distributions, functional class, tertiary structures and functionally important residues. Each domain found in a non-redundant protein database as well as search parameters and taxonomic information are stored in a relational database system. User interfaces to this database allow searches for proteins containing specific combinations of domains in defined taxa. For all the details, please refer to the publications on SMART. SMART(,可以说是蛋白结构预测和功能分析的工具集合。简单点说,就是 集合了一些工具,可以预测蛋白的一些二级结构。如跨膜区(Transmembrane segments),复合螺旋区(coiled coil regions),信号肽(Signal peptides),蛋白结构域(PFAM domains)等。 SMART前该知道的 1,SMART有两种不同的模式:normal 或genomic 主要是用的数据库不一样。Normal SMART, 用的数据库 Swiss-Prot, SP-TrEMBL 和 stable Ensembl proteomes。Genomic SMART, 用全基因组序列。详细列表:,一些名词解释 进行时 可以直接用各个数据库蛋白的ID。如Uniprot/Ensembl??ID / Accession number (ACC)。或是直接蛋白序列。运行SMART也可选择signal peptides、PFAM domains等的预测,勾上就是。看下图 SMART结果 运行后的结果用图表表示。其实运行后的结果都有明确的解释。详细请看下面。
蛋白质结构分析原理及工具 (南京农业大学生命科学学院生命基地111班) 摘要:本文主要从相似性检测、一级结构、二级结构、三维结构、跨膜域等方面从原理到方法再到工具,系统地介绍了蛋白质结构分析的常用方法。文章侧重于工具的列举,并没有对原理和方法做详细的介绍。文章还列举了蛋白质分析中常用的数据库。 关键词:蛋白质;结构预测;跨膜域;保守结构域 1 蛋白质相似性检测 蛋白质数据库。由一个物种分化而来的不同序列倾向于有相似的结构和功能。物种分化后形成的同源序列称直系同源,它们通常具有相似的功能;由基因复制而来的序列称为旁系同源,它们通常有不同的功能[1]。因此,推测全新蛋白质功能的第一步是将它的序列与进化上相关的已知结构和功能的蛋白质序列比较。表一列出了常用的蛋白质序列数据库和它们的特点。 表一常用蛋白质数据库 网址可能有更新 氨基酸替代模型。进化过程中,一种氨基酸残基会有向另一种氨基酸残基变化的倾向。氨基酸替代模型可用来估计氨基酸替换的速率。目前常用的替代模型有Point Accepted Mutation (PAM)矩阵、BLOck SUbstitution Matrix (BLOSUM)矩阵[2]、JTT模型[3]。 序列相似性搜索工具。序列相似性搜索又分为成对序列相似性搜索和多序列相似性搜索。成对序列相似性搜索通过搜索序列数据库从而找到与查询序列相似的序列。分为局部联配和全局联配。常用的局部联配工具有BLAST和SSEARCH,它们使用了Smith-Waterman 算法。全局联配工具有FASTA和GGSEARCH,基于Needleman-Wunsch算法。多序列相似性搜索常用于构建系统发育树,这里不阐述。表二列举了常用的成对序列相似性比对搜索工具
5. 业务流程分析p83 流程分析的目的是了解各个业务流程的过程,明确各个部门之间的业务关系,明确每个业务处理的意义,为业务流程的合理化改造提供建议,为系统的数据流程变化提供依据。 业务流程分析的步骤可以总结如下: (1)通过调查掌握基本情况。 (2)描述现有业务流程—绘制业务流程图。 (3)确认现有业务流程。 (4)对业务流程进行分析—知识和经验支持。 (5)发现问题提出解决方案。 (6)提出优化后的业务流程。 6. 业务流程再造(Business Process Reengineering,BPR)的概念 BPR是指对企业的业务流程进行根本的再思考和彻底的再设计,从而使企业的关键绩效指标,如成本、质量、服务、效率等,获得巨大的提高。 企业流程再造(BPR)应遵循以下原则: ·有一个明确的、具有启发性的目标,即共同远景。 ·充分考虑顾客的价值。 ·必须服从统一指挥。 ·充分做好横向及纵向沟通。 ·认识流程再造的两大要素—信息技术/信息系统和人员组织管理。 ·树立典范、逐步推进,充分利用变革的涟漪效应。 流程再造方法一般有两大类:全新设计法(Clean Sheet Approach)和系统改造法(SystematicRedesign),前者遵循“推倒重来”的主张,从根本上抛弃旧流程,零起点设计新流程;后者继承逐步改善的思想即BPI的思想,辨析理解现有流程,在现有流程的基础上,系统渐进地创造新流程。 7. 数据流图DFD p87 结构化分析方法是一种面向数据流的软件分析方法,适合于开发一些数据处理类型的软件的需求分析的方法。 采用数据流图的方式进行数据流程分析一般应遵循以下原则: ·明确系统边界。 ·在总体上遵循自顶向下逐层分解的原则 ·在局部上遵循由外向里的原则
蛋白质结构与功能的关系 蛋白质的结构包括一级结构、二级结构、三级结构、四级结构。 一级结构是蛋白质的一级结构指在蛋白质分子从N-端至C-端的氨基酸排列顺序。一级结构是蛋白质空间构象和特异生物学功能的基础,但不是决定蛋白质空间构象的唯一因素。 蛋白质的二级结构是指多肽链的主链骨架本身在空间上有规律的折叠和盘绕,它是由氨基酸残基非侧链基团之间的氢键决定的。常见的二级结构有α螺旋、三股螺旋、β折叠、β转角、β凸起和无规卷曲。α螺旋中肽链骨架围绕一个轴以螺旋的方式伸展,它可能是极性的、疏水的或两亲的。β折叠是肽链的一种相当伸展的结构,有平行和反平行两种。如果β股交替出现极性残基和非极性残基,那么就可以形成两亲的β折叠。β转角指伸展的肽链形成180°的U形回折结构而改变了肽链的方向。β凸起是由于β折叠股中额外插入一个氨基酸残基而形成的,它也能改变多肽链的走向。无规卷曲是在蛋白质分子中的一些极不规则的二级结构的总称。无规卷曲无固定走向,有时以环的形式存在,但不是任意变动的。从结构的稳定性上看,右手α螺旋>β折叠> U型回折>无规卷曲,但在功能上,酶与蛋白质的活性中心通常由无规卷曲充当,α右手螺旋和β折叠一般只起支持作用。 蛋白质的三级结构是指多肽链在二级结构的基础上,进一步盘绕、卷曲和折叠,形成主要通过氨基酸侧链以次级键以及二硫键维系的完整的三维结构。三级结构通常由模体和结构域组成。稳定三级结构的化学键包括氢键、疏水键、离子键、范德华力、金属配位键和二硫键。模体可用在一级结构上,特指具有特殊生化功能的序列模体,也可被用于功能模体或结构模体,相当于超二级结构。结构模体是结构域的组分,基本形式有αα、βαβ和βββ等。常见的模体包括:左手超螺旋、右手超螺旋、卷曲螺旋、螺旋束、α螺旋-环-α螺旋、Rossmann卷曲和希腊钥匙模体。结构域是在一个蛋白质分子内的相对独立的球状结构和/或功能模块,由若干个结构模体组成的相对独立的球形结构单位,它们通常是独自折叠形成的,与蛋白质的功能直接相关。一个结构域通常由一段连续的氨基酸序列组成。根据其占优势的二级结构元件的类型,结构域可分为五大类:α结构域、β结构域、α/β结构域、α+β 结构域、交联结构域。以上每一类结构域的二级结构元件可能有不同的组织方式,每一种组织就是一种结构模体。这些结构域都有疏水的核心,疏水核心是结构域稳定所必需的。 具有两条和两条以上多肽链的寡聚蛋白质或多聚蛋白质才会有四级结构。组成寡聚蛋白质或多聚蛋白质的每一个亚基都有自己的三级结构。蛋白质的四级结构内容包括亚基的种类、数目、空间排布以及亚基之间的相互作用。驱动四级结构形成或稳定四级结构的作用力包括
第一章蛋白质的结构与功能 [测试题] 一、名词解释:1.氨基酸 2.肽 3.肽键 4.肽键平面 5.蛋白质一级结构 6.α-螺旋 7.模序 8.次级键 9.结构域 10.亚基 11.协同效应 12.蛋白质等电点 13.蛋白质的变性 14.蛋白质的沉淀 15.电泳 16.透析 17.层析 18.沉降系数 19.双缩脲反应 20.谷胱甘肽 二、填空题 21.在各种蛋白质分子中,含量比较相近的元素是____,测得某蛋白质样品含氮量为15.2克,该样品白质含量应为____克。 22.组成蛋白质的基本单位是____,它们的结构均为____,它们之间靠____键彼此连接而形成的物质称为____。 23.由于氨基酸既含有碱性的氨基和酸性的羧基,可以在酸性溶液中带____电荷,在碱性溶液中带____电荷,因此,氨基酸是____电解质。当所带的正、负电荷相等时,氨基酸成为____离子,此时溶液的pH值称为该氨基酸的____。 24.决定蛋白质的空间构象和生物学功能的是蛋白质的____级结构,该结构是指多肽链中____的排列顺序。25.蛋白质的二级结构是蛋白质分子中某一段肽链的____构象,多肽链的折叠盘绕是以____为基础的,常见的二级结构形式包括____,____,____和____。 26.维持蛋白质二级结构的化学键是____,它们是在肽键平面上的____和____之间形成。 27.稳定蛋白质三级结构的次级键包括____,____,____和____等。 28.构成蛋白质的氨基酸有____种,除____外都有旋光性。其中碱性氨基酸有____,____,____。酸性氨基酸有____,____。 29.电泳法分离蛋白质主要根据在某一pH值条件下,蛋白质所带的净电荷____而达到分离的目的,还和蛋白质的____及____有一定关系。 30.蛋白质在pI时以____离子的形式存在,在pH>pI的溶液中,大部分以____离子形式存在,在pH 关于施工项目管理业务流程存在的问题分析(doc 8页) 更多企业学院: 《中小企业管理全能版》183套讲座+89700份资料《总经理、高层管理》49套讲座+16388份资料《中层管理学院》46套讲座+6020份资料《国学智慧、易经》46套讲座 《人力资源学院》56套讲座+27123份资料《各阶段员工培训学院》77套讲座+ 324份资料 细部流程则反映各管理环节中业务活动的相互关系和流转过程。 施工项目管理流程,则反映了建设工程施工生产的客观规律和管理活动的特点,将施工过程所需要的信息流和物质流进行有机的结合,并为施工技术作业和管理活动输入行为目标、物质条件、运作规则,促使其产出预期的结果。 施工项目管理全过程的总体性管理流程及主要环节为:(1)项目投标合同阶段:市场调查、施工投标、签订施工合同等;(2)项目管理准备阶段:投标交底与合同评审、选派项目经理与组建项目经理部、施工组织设计和项目管理规划等;(3)项目管理实施阶段:这阶段施工项目管理主要围绕着项目管理目标的控制进行,分别执行质量控制流程,工程进度控制流程,成本控制流程和安全管理流程;(4)项目管理终结阶段:这阶段主要进行工程施工验收、决算、签署工程回访保修证书,建筑物使用说明;施工项目管理效益审计;施工项目管理总结评价等。 根据笔者的观察,从施工项目管理的总体流程到细部业务工作流程,主要存在以下三方面的问题:一是缺少某些重要环节;二是个别管理流程不明确,致使有关管理工作不到位;三是有的管理流程颠倒,起不到应有的作用。 1、缺少某些重要环节 1.1投标交底和合同评审 投标过程和中标情况交底,是指应由施工企业经营部门负责主持投标工作的人员,通过企业经营例会,向其他职能部门负责人及拟选派的施工项目经理人员,传达该工程施工招标情况和投标者竞争情况,最终由本企业中标的原因,标书中已考虑到哪些降低造价的技术措施和管理措施,合同条件等,其作用在于: ①使各职能部门掌握这些信息。 ②引导各职能部门共同进行该工程管理方针、目标和措施的进一步策划,把企业长期生产经营中积累的技术和管理经验,应用于该施工项目的管理中。 ③深入展开合同评审,掌握合同条件和要求,明确各职能部门及项目经理对履行合同所承担的责任。 按照ISO9000质量管理与质量保证系列标准中“合同评审”的要求,工程承包企业应对每项标书合同进行评审,评审合同的各项要求是否明确,与投标时不一致的要 文档编号:VR_4 业务流程分析 —————————————————————————————————— 基于VR(Virtual Reality)的室内设计 编写人: 使用人: 密级: 日期: 文档修订历史 编写目的 本文档编写是为了明确系统对应的实际业务,保证系统开发有序、保质的进行。有了对具体的业务处理流程,在开发的过程中才会更好地处理计算机与实际业务之间的映射关系,才会更好地使用计算机解决现实业务活动中的繁琐,提高工作的效率。 本文档要求项目组的每个成员都需要阅读,熟悉系统的实际业务,避免开发时对系统业务的茫然,使开发出来的系统更满足需求。 参考资料 《软件需求说明书.doc》 2 业务背景调查 VR(虚拟设计)模块 VR(虚拟设计)模块为用户提供三维虚拟房屋设计的个性化服务功能,在虚拟空间上,用户可以根据自己房间的大小创建虚拟空间,然后自主进行装饰设计;用户可以在虚拟空间里随意摆放家居,当用户摆放家居时,如果空间不足,则提示“空间不足,不能摆放”;可以更换场景中房间墙砖、地板、天花板的材质和颜色;设计后的场景以“3D场景文件”格式保存,方便用户查看,同时,用户可以根据自己的需求,向供应商提出定制要求;最后统计房间中的各种物品,放入购物车中,方便用户下订单。 (图2-1) 顾客模块 顾客模块为顾客提供一些基本操作,如注册、登录、浏览商品、搜索等,还为顾客提供三维虚拟设计特色服务,提高顾客的购物体验,顾客可以看到商品的整体外观,也有效地为顾客避免买到不合适的商品的情况;顾客还可以根据自己的需求向供应商提出定制申请。 (图2-2) 供应商模块 供应商模块主要为供应商提供商品管理、模型管理、订单处理、处理定制需求等,供应商先把商品相关资料上传到系统,由我们创建3D模型,再提交到网站前端;当顾客下订单或提出定制需求时,系统会通知供应商进行处理。该模块提供了数据统计的功能,方便供应商查看商品的销售和评价情况,方便制定相应的销售计划。 (图2-3) 课时作业(六) [学业水平层次(A)] 1.(2015·济南高一期末)下列物质分子中,不属于构成生物体蛋白质的氨基酸的是( ) 【解析】构成生物体蛋白质的氨基酸必须是有一个氨基和一个羧基连在同一个碳原子上,据此,A、B、C三项的物质分子中都有一个氨基和一个羧基连在同一个碳原子上,而D项是连在不同的碳原子上,因此不属于构成生物体蛋白质的氨基酸。 【答案】 D 2.在活细胞中发生的大多数化学反应中,起重要作用的物质是蛋白质,蛋白质在细胞中的存在方式通常有两种状态,一是游离态,二是被膜结构固定起来的结合态,结合态的蛋白质不可能具有的功能是( ) A .催化作用 B .运输作用 C .免疫作用 D .调节作用 【解析】 蛋白质的功能是:①构成生命体;②催化作用;③运输作用;④调节作用; ⑤免疫作用,而其中起调节作用的蛋白类激素是细胞分泌产物,不是被膜固定起来的蛋白质。 【答案】 D 3.(2015·延安期末)某蛋白质由3条多肽链、n 个氨基酸组成,下列关于该蛋白质说法正确的是( ) A .形成该蛋白质时产生了n 个水分子 B .该蛋白质中至少含有n 个肽键 C .该蛋白质中至少含有3个游离的羧基 D .合成该蛋白质至少需要20种氨基酸 【解析】 形成该蛋白质时,产生水分子数为n -3,含有n -3个肽键。至少含有的游离的羧基数=肽链条数=3。 【答案】 C 4.蛋白质在消化道内的消化过程为:蛋白质――→①多肽――→②氨基酸,则①② 过程中分别破坏了下列什么结构( ) A .肽键 氨基酸 B .肽键 肽键 C .空间结构 肽键 D .空间结构 氨基酸 【解析】 多肽内氨基酸残基之间通过肽键连接,一条或几条多肽链盘曲折叠形成具有一定空间结构的蛋白质。 【答案】 C 5.有一种二肽,化学式是C 8H 14N 2O 5,水解后得到丙氨酸(R 基为—CH 3)和另一种氨基酸M ,则氨基酸M 的R 基的化学式是( ) A .—C 5H 9O 4N B .— C 3H 5NO 2 C .—C 5H 7O 2 D .—C 3H 5O 2 【解析】 丙氨酸的化学式为氨基酸共有部分加上R 基,即C 2H 4O 2N 加上CH 3,为C 3H 7O 2N 。氨基酸M 的化学式为二肽加上水减去丙氨酸, 即C 8H 14N 2O 5 1.案例分析 显示器事业部的采购业务的财务处理流程再造 长城电脑显示器事业部的财务部门应付账款的工作就是接受采购部门送来的采购订单副本、仓库的收货单和供应商的发票,然后将三类票据在一起进行核对,查看其中的12项数据是否相符。部门的绝大部分时间被耗费在检查这12项数据上。 原有的业务处理流程图如图1所示: 图1原有的业务处理流程图 第一,采购部门向供货商发出订单并将订单的复印件送往财务部门;第二,供货商发货,显示器的验收部门收检,并将验收报告送到财务部门;第三,供货商同时将产品的发票送至财务部门。 业务重新设计后,财务部门不再需要按发票审核数据,需要核实的数据项减少为三项:零部件名称、数量和供货商代码,米购部门和仓库分别将米购订单和收货确认信息输入到计算机系统后,由计算机进行电子数据匹配。 再造后的公司采购业务流程如图2所示。 图2再造后的公司流程 新流程中包含两个工作步骤:第一,采购部门发出订单,同时将订单内容输入计算机数据库;第二,供货商发货,验收部门核查来货是否与数据库中内容相吻合,如吻合就收货,并在终端机用按键通知数据库,计算机会自动按时付款。 问题:比较原有业务流程与再造后业务流程的差异在何处?分析由此改动后带来的好处是什么? 差异: 1、加入了数据库系统。 2、不需开订单以及复印件送往相应部门,只需要对电脑输入数据。 3、供货商发货,验收部门验收后还要将验收报告送往财务部,供应商同时把发票送往财务部,财务部何时所有票面数据属实才能付款。而业务流程再造后,验收部门核查来货属实后直接通知数据库,计算机自动付款。中间减少了发送验收报告,以及发送发票流程,财务部门只需要使用计算机便可付款。 好处:总的来说,再造后的业务流程相比原有业务流程主要是加入了一个数据库系统。 1、加入数据库系统,业务流程机械化,不需要人工,提高效率,提高准确信性。 2、简化业务流程,使业务流程更加清晰。 3、操作方便快捷。 《蛋白质结构解析研究进展》 一、蛋白质结构分类 人类对于进化的认识及蛋白质结构相似性比较的研究使蛋白质结构分类成为可能,而且近年来取得的研究进展表明,大部分蛋白质可以成功的分入到适当数目的家族中。目前国际上流行的蛋白质结构分类数据库基本上采取两种不同的思路,一种是数据库中储存所有结构两两比较的结果;第二种思路是致力于构建非常正式的分类体系。由于所有分类方法反映了各研究小组在探究这个重要领域的不同角度,所以这些方法是同等有效的。目前,被广泛应用的四种分类标准是:手工构造的层次分类数据库SCOP,全自动分类的MMDB和FSSP,和半手工半自动的CATH。 蛋白质结构自动分类问题可以被纳入机器学习的范畴,通过提取分析蛋白质结构的关键特征,构造算法来学习蕴含于大量已知结构和分类的数据中的专家经验知识,来实现对未知蛋白质结构的分类预测。目前,对蛋白质结构的不同层次分类,结果比较好的机器学习方法是:神经网络多层感知器、支持向量机和隐马尔可夫模型。支持向量机应用于分类问题最终归结于求解一个最优化问题。上世纪90 年代中期,隐马尔可夫模型与其他机器学习技术结合,高效地用于多重比对、数据挖掘和分类、结构分析和模式发现。多层感知器即误差反向传播神经网络,它是在各种人工神经网络模型中,在机器学习中应用最多且最成功的采用BP学习算法的分类器。 二、蛋白质结构的确定 蛋白质三维空间结构测定方法主要包括X射线晶体学分析、核磁共振波谱学技术和三维电镜重构,这三种方法都可以完整独立地在原子分辨水平上测定出蛋白质的三维空间结构。蛋白质数据库PDB中80%的蛋白质结构是由X射线衍射分析得到的,约15%的蛋白质结构是由核磁共振波谱学这种新的结构测定方法得到。 1、X射线晶体学 随着国内企业管理水平的日益提高,管理者对于流程的重视程度日益提高,咨询客户对于流程优化的需求也有增加的趋势。 流程优化的起点是流程诊断,而不同企业在管理流程中存在的问题往往存在共性。笔者通过多个咨询项目的实践经验和相关咨询案例的研究,初步总结出企业的管理流程中常见的三十个问题,并按照流程结构、流程环节、流程节点以及流程管理四个方面进行了分类,用于指导流程诊断的实践,取得了良好的效果。 一、流程结构问题 通过把企业现有流程作为一个整体进行评价,往往会发现以下问题: 1、流程的系统性差:流程缺乏整体统筹,对于需要统一规划的相关流程没有进行整体考虑。例如,生产计划流程、销售计划流程、大修计划流程、备品备件计划流程、物料采购计划流程,必须根据企业特点,以生产或者销售为起点,制定相关的系列计划,而有的企业往往将这几个流程单独运行,造成各项计划对相关工作的制度性差。 2、关键流程缺失:关键流程缺失是较为常见的一种情况,既包括没开展相关工作导致的流程缺失,也包括开展了某项工作但没有确定相应流程的情况。前者较为常见的例子是战略规划方面的流程缺失,后者的例子通过细致的流程梳理往往能找出很多,不再赘述。 3、流程主体不明确:一般包括两种情况,一是没有明确规定某一流程的负责部门,二是对于不可分割的一项工作由两个以上部门负责,造成多头管理。 4、流程间的衔接不顺畅:由于设计不合理,造成某一流程结束后,无法顺利进入下一流程,或者流程中涉及到的子流程无法达到无缝衔接。 5、节点过多、流程过长:一个流程中设计了众多的步骤、子流程,各个步骤间存在复杂的依赖关系,流程顺利运转的难度极大。 6、流程节点之间的等待时间过长:流程中单个节点的效率尚可,但节点间的等待时间过长,从而影响了流程的整体效率。 7、串行审批过多:对于可以并行审批或者事中、事后控制的事项,全都设计成事前的串行审批,导致流程运行缓慢。 8、流程振荡性高:在流程中设置了多个反复出现的环节或子流程,例如某企业在采购流程中,在招标阶段和合同审批阶段需要财务、审计、采购等部门的经办人、主管领导对相同的内容反复审核三次。 二、流程环节问题 晶体结构解析过程1 1:分子置换法 使用condition:目标蛋白A有同源1蛋白结构B,同源性30%以上。 用到的软件及程序:HKL2000,CCP4,COOT,Phenix,CNS。 解析过程:收集数据(X-RAY)--> hkl2000 处理数据--> 置换前数据处理分子置换(ccp4Molecular Replacement--MR)-->COOT手工修正,氨基酸序列调换-->phenix refine--coot 手工修正phenix refine。。。__拉氏构象图上outlier为0为之,且R-free,R-work达到足够低的值。-->phenix 加水refine(溶剂平滑)。。。(若修正过程中有bias 最好也用CNS修正一下) 2:同晶置换法--硒代蛋白 使用condition:目标蛋白没有同源结构。 用到的软件及程序:HKL2000,CCP4,COOT,Phenix,CNS。 解析过程:收集数据(X-ray 硒代蛋白及母体蛋白)--> hkl2000处理数据-->ccp4 程序包搜索搜索硒信号(gap),相位确定-->搭模--->以硒代数据得到的pdb为模型和母体高分辨数据得到的mtz进行分子置换--> 后面修正过程与分子置换相似。 各步骤介绍: (1)hkl2000:将x-ray 收集的图像编译转化为数字信息,得到的关键文件有.sca和.log ,log文件会给出hkl2000 处理的过程记录,sca文件是最终处理的输出文件。sca文件包含晶体的空间群等信息。带有可以被转化为电子密度图的信息。评价hkl2000处理是否成功的参数有数据完整度,最高分辨率等,一般希望处理出在完整度允许的情况下最高分辨率的数据。 分子置换前处理:ccp4 软件包 a. data reduction,即将sca文件转换为mtz文件。用imported integrated data。 b. cell content analysis 这个是晶体中蛋白聚集体数的分析,通过分析晶体含水量得到一个晶胞内的蛋白分子数。用mtz文件进行。含水量在40%-60%之间时对应得n即为正确值。这个聚集体数会在mr中使用。 一、物流产业的研究背景 (4) 三、中通快递企业组织管理系统分析 (5) 四、中通快递企业业务流程 (7) 五、数据流程图 (11) 六、数据字典 (13) 七、物流企业发展展望 (14) 八、物流企业的发展策略 (15) 一、宏观建议 (15) 二、微观对策 (16) 物流公司业务流程分析 【摘要】 要从世界物流行业的发展趋势上来说,快递物流行业是世界经济发展到一定阶段必然出现的产物,我国的快递物流行业,虽然发展速度十分迅猛,但在过程中也不可避免的暴露了一些问题。固有的经营模式和服务思想已经违背了新时期的特征,基本上还是传统意义上的、以生产为导向的业务处理流程为主。这种流程虽然能够在一定程 度上为该行业的信息化、现代化提供必要的支持,但是从本质上来说组织框架形式还是没有得到相应的改变,在当前的市场竞争过程中不具有相应的竞争能力。在现代化的企业经营中,个性化、速度、以及服务这三个方面重要性越来越凸显,这就要求现代化的快递物流企业必须根据自身的实际情况构成一个有效的物流组织,优化业务流程,从而为实现精益物流作出积极努力 关键字:物流、中通、 一、物流产业的研究背景 随着我国社会主义市场经济体系的不断完善,我国市场内专业化生产模式也随之成长起来,这就要求我们必须在市场化程度日益提升的今天,必须对物流行业给予足够的重视。应该看到,作为当前阶段世界范围内的朝阳行业,物流产业被认为是国民经济发展的动脉。 我国经济要想在新世纪取得更为显著的发展,必须在国民经济和社会生产中对快递物流给予一定的重视和肯定根据相关部门提供的数据显示,2003年1-9月中国物流业的各种经济指标高速增长,全国社会物流总值21.7万亿元,同比增长26.9%,其中工业品物流总值18.3万亿元,同比增长26.5%;农业品物流总值8635亿元,同比增长4.8%;全社会物流总值增长25%左右[21。我国市场总体发展前景广阔,为我国的物流行业的发展提供了相对庞大的商机。 从世界物流行业的发展情况以及发展趋势上来说,快递物流行业的发展是世界经济发展到一定阶段时候必然出现的产物,尤其是在网络信息化的今天,网上购物的兴起和勃发,更是为快递类物流行业的进一步发展提供了新的方向。1998年欧洲天地快递(TNT)以3.6亿美元兼并法国第一大国内快递服务商,充分说明了现代物流发展过程中快递业务已经成为其中的重点,并已经从市场的实际需求角度为社会经济的发展做出了卓越的贡献。 二、需求分析 4.2 针对蛋白质的预测方法 传统的生物学认为,蛋白质的序列决定了它的三维结构,也就决定了它的功能。由于用X光晶体衍射和NMR核磁共振技术测定蛋白质的三维结构,以及用生化方法研究蛋白质的功能效率不高,无法适应蛋白质序列数量飞速增长的需要,因此近几十年来许多科学家致力于研究用理论计算的方法预测蛋白质的三维结构和功能,经过多年努力取得了一定的成果。 1. 从氨基酸组成辨识蛋白质 根据组成蛋白质的20种氨基酸的物理和化学性质可以分析电泳等实验中的未知蛋白质,也可以分析已知蛋白质的物化性质。ExPASy工具包中提供了一系列相应程序: AACompIdent:根据氨基酸组成辨识蛋白质。这个程序需要的信息包括:氨基酸组成、蛋白质的名称(在结果中有用)、pI和Mw(如果已知)以及它们的估算误差、所属物种或物种种类或“全部(ALL)”、标准蛋白的氨基酸组成、标准蛋白的SWISS-PROT编号、用户的Email地址等,其中一些信息可以没有。这个程序在SWISS-PROT和(或)TrEMBL数据库中搜索组成相似蛋白。 AACompSim:与前者类似,但比较在SWISS-PROT条目之间进行。这个程序可以用于发现蛋白质之间较弱的相似关系。 除了ExPASy中的工具外,PROPSEARCH也提供基于氨基酸组成的蛋白质辨识功能。程序作者用144种不同的物化性质来分析蛋白质,包括分子量、巨大残基的含量、平均疏水性、平均电荷等,把查询序列的这些属性构成的“查询向量”与SWISS-PROT和PIR中预先计算好的各个已知蛋白质的属性向量进行比较。这个工具能有效的发现同一蛋白质家族的成员。可以通过Web使用这个工具,用户只需输入查询序列本身。 ExPASy的网址是:http://www.expasy.ch/tools/。 PROSEARCH的网址是:http://www.embl-heidelberg.de/prs.html。 2. 预测蛋白质的物理性质 从蛋白质序列出发,可以预测出蛋白质的许多物理性质,包括等电点、分子量、酶切特性、疏水性、电荷分布等。相关工具有: Compute pI/MW:是ExPASy工具包中的程序,计算蛋白质的等电点和分子量。对于碱性蛋白质,计算出的等电点可能不准确。 PeptideMass:是ExPASy工具包中的程序,分析蛋白质在各种蛋白酶和化学试剂处理后的内切产物。蛋白酶和化学试剂包括胰蛋白酶、糜蛋白酶、LysC、溴化氰、ArgC、AspN 和GluC等。 ERP业务流程优化实施过程分析 一.企业基本情况分析 公司在正式实施ERP项目之前,除了进行了全公司范围的动员和培训之外,首先进行的是BPI,即业务流程优化。业务流程优化的作用一方面是通过业务流程优化解决现存的管理问题,提升公司的基础管理,另一方面力求在ERP实施之前完成新流程与软件的匹配,以降低ERP实施的风险。这里强调所进行的是BPI而不是BPR,因为用循序渐进的业务流程优化(BPI)代替业务流程重组(BPR)的“彻底的革命”,可以防止单方面强调软件功能或者特殊流程的极端做法,也更符合公司的实际。公司前期请专业咨询公司对企业的现状流程进行了疏理和诊断,形成了业务流程优化的方案及配套的优化措施,而后到ERP系统上线之前所要进行的工作就是进行流程优化方案的实施,这也是我所在的ERP 实施工作组的主要工作内容。 公司具有鲜明的企业特点,所生产的产品技术复杂度高,系统集成性强,生产复杂,涉及环节多,施工周期长且施工条件复杂。其客户分布除了电力系统之外还有工矿企业等多种类型,客户需求难以管理,而电力系统的客户属于强势客户。在管理方面具有国有企业的特点,仍处于传统工厂式向高科技企业转变的阶段。 二.业务流程优化实施过程分析 (一)ERP业务流程优化成员组织结构 流程优化实施工作的实质是推行管理变革,需要上至公司领导下至普通员工的参与;优化工作具有整体系统性和逻辑关联性,需要有人深入的理解和整体的把握。参与优化实施的人员包括:决策者:对优化实施过程中的关键和重大问题作出决策;推动者:使用权威,通过行政手段和奖惩措施推动实施工作;策划者:理解掌握方案并结合实际情况进行研究分析,提出工作方法和行动计划;监控者:管理协调实施过程,了解计划执行情况和工作质量,及时发现、汇报和解决问题; 蛋白质结构分析方法:X射线晶体衍射分析和核磁共振 x 射线衍射法的分辨率可达到原子的水平,使它可以测定亚基的空间结构、各亚基间的相对拓扑布局,还可清楚的描述配体存在与否对蛋白质的影响。多维核磁共振波谱技术已成为确定蛋白质和核酸等生物分子溶液三维结构的唯一有效手段。NM R技术最大的优点不在于它的分辨率,而在于它能对溶液中和非晶态的蛋白质进行测量。 蛋白质的序列结构测定: 1.到目前为止,最经典的蛋白质的氨基酸序列分析方法是,sarI等人基于Edman降解原理研制的液相蛋白质序列仪,及后来发展的固相和气相的蛋白质序列分析仪。 2.质谱:早期的质谱电离的方式主要是电子轰击电离(EI),它要求样品的挥发性好,一般与气相色谱联用。但使用G C/M S分析,肽的长度受到限制,只能分析小的肽段。近年来,在离子化的技术及仪器方面取得了突破性进展,使得质谱所能测定的分子量的范围大大超出了10k u。因此,软离子化技术、基质辅助的激光解吸/离子化(MALDI)和电喷雾离子化(E SI)显得尤为有前途。通过串联质谱技术(MS/MS)和源后衰减基质辅助的激光解吸/离子化(PSD—MAIDI—MS),人们就可以从质谱分析中获得肽及蛋白质的结构信息。 蛋白质三维结构的研究: 1.X射线单晶衍射分析 2.核磁共振分析 3.蛋白质的二维晶体与三级重构: 蛋白质二维结晶及其电子晶体学的结构分析是目前结构生物学最活跃的领域之一。此法既适用于水溶性蛋白质,也适用于脂溶性膜蛋白的研究。电子晶体学的结构分析源于早期的电子衍射分析。与X射线衍射方法类似,电子衍射数据的实验分析得到的只是结构因子的振幅部分,丢掉了相位信息。但从剑桥MRC分子生物学实验室的Klug和DeRo sier建立了三维重构的方法开始,电子晶体学才真正发展成为一种独立的空间结构的分析方法,并从传统的X射线晶体学中脱胎出来。所谓电镜图像的三维重构是指由样品的一个或多个投影图得到样品中各成分之间的三维关系。这一方法的基本思路是电子显微图像含有振幅和相位的信息,二者可通过数字图像处理的傅立叶变换方法提取出来。蛋白质溶液构想的光谱技术: 紫外-可见差光谱:紫外一可见差光谱也是电子光谱,由电子跃迁产生。而蛋白质在紫外区的光吸收是由于芳香族氨基酸侧链吸收光引起的。可见区的研究则限于蛋白质一蛋白质、酶一辅酶、酶一底物的相互作用等,有时还需引人生色团才能进行。差光谱的产生是基于生色团经受一定的环境变化时,吸收峰发生位移,吸光度和谱带半宽度也有改变。生色团经受的这种环境变化称为微扰作用,变化后和变化前的光谱差称为差光谱。根据差光谱的光谱参数,可以推断这些生色团在大分子中是隐藏的半暴露的还是暴露的。 荧光探针法:荧光光谱法是研究蛋白质分子构象的一种有效方法,它能提供包括激发光谱、发射光谱、斯托克斯位移,荧光强度、总荧光量、量子产率、荧光偏振和荧光寿命等参数,这些参数从各个角度反映了分子的成键和结构情况。通过这些参数的测定,不但可以做一般的定量分析,而且还可以推断蛋白质分子在各种环境下的构象变化,从而阐明蛋白质分子在各种环境下的构象变化,进而阐明蛋白质结构与功能之间的关系。 圆二色谱:圆二色性和旋光色散都可用于测定分子的立体结构。旋光色散利用不对称分子对左、右圆偏振光折射的不同进行结构分析,而圆二色性则利用不对称分子对左、右圆偏振光吸收的不同进行结构分析。在蛋白质分子中,每个氨基酸残基的a碳是不对称碳,再加上主链构象也是不对称结构,因而蛋白质分子具有光学活性。通过圆二色的测定和计算可以了解蛋白质分子在溶液状态下的二级结构。圆二色对构象变化敏感,故它可灵敏的检测一些反应引起的构象变化,特别是用于观测蛋白质的变性是最方便的. 业务流程分析 业务流程分析(Business Process Analysis, BPA) 目录 [隐藏] ? 1 业务流程分析概 述 ? 2 业务流程分析的 内容 ? 3 业务流程分析的 步骤 ? 4 业务流程的调查 ? 5 业务流程分析方 法 [编辑] 业务流程分析概述 业务流程分析是对业务功能分析的进一步细化,从而得到业务流程图即TFD (Transaction Flow Diagram ),是一个反映企业业务处理过程的“流水帐本”。业务流程分析的目的是:形成合理、科学的业务流程。通过分析现有业务流程的基础上进行业务流程重组(BPR),产生新更为合理的业务流程。 [编辑] 业务流程分析的内容 业务流程分析的内容: (1)原有流程的分析。 (2)业务流程的优化。 (3)确定新的业务流程 (4)新系统的人机界面。 [编辑] 业务流程分析的步骤 根据对组织结构图和业务功能体系图的分析,可决定下一步重点调查的部门,然后对该部门的业务信息、业务流程等进行详细调查。流程分析的目的是了解各个业务流程的过程,明确各个部门之间的业务关系,明确每个业务处理的意义,为业务流程的合理化改造提供建议,为系统的数据流成变化提供依据。 业务流程分析是要将企业具体的业务活动过程(内容、步骤等)描述出来,并对此优化 1.绘制各部门的业务流程图; 2.与各部门业务人员讨论业务流程图是否符合实际情况; 3.分析业务流程中存在的问题(有无不合理流程/环节); 4.与各部门业务人员讨论,提出改进方案; 5.将新业务流程图提交决策者,以便确定合理的、切合实际的业 务流程。 [编辑] 业务流程的调查 1. 系统环境调查 包括现行系统的管理水平,原始数据的精确程度,规章制度是否齐全和切实可行,各级领导对开发新的MIS是否有比较清楚的认识,用户单位能否抽调出比较精通本行业管理业务、对本单位存在的问题有深刻了解而又热心于改革的工作人员。此外,还要调查原系统的设备情况。 2. 组织机构和职责的调查 调查中应详细了解各部门人员的业务分工情况和有关人员的姓名、工作职责、决策内容、存在问题和对新系统的要求等。 3. 功能体系的调查与分析 系统有一个总的目标,为了达到这个目标,必须完成各子系统的功能,而各子系统功能的完成,又依赖于下面各项更具体的功能来执行。功能结构调查的任务,就是要了解或确定系统的这种功能构造。 4. 管理业务流程的调查与分析 管理业务流程的调查与分析就是要弄清管理职能是如何在有关部门具体完成的,以及在完成这些职能时信息处理工作的一些细节情况。 [编辑]关于施工项目管理业务流程存在的问题分析(doc 8页)
业务流程分析
蛋白质的结构与功能(含解析)
业务流程案例分析题
蛋白质结构解析研究进展作业
企业管理流程四大常见问题解析
蛋白质结构解析
物流业务流程分析
蛋白质序列分析和结构预测
ERP业务流程优化实施过程分析
蛋白质结构分析方法
业务流程分析
相关主题
文本预览