
Sugar Bulletin
Inside
Sugar crop plantings for 2011/12 and their implications for the market
June 2011
White Premium Rockets Upwards
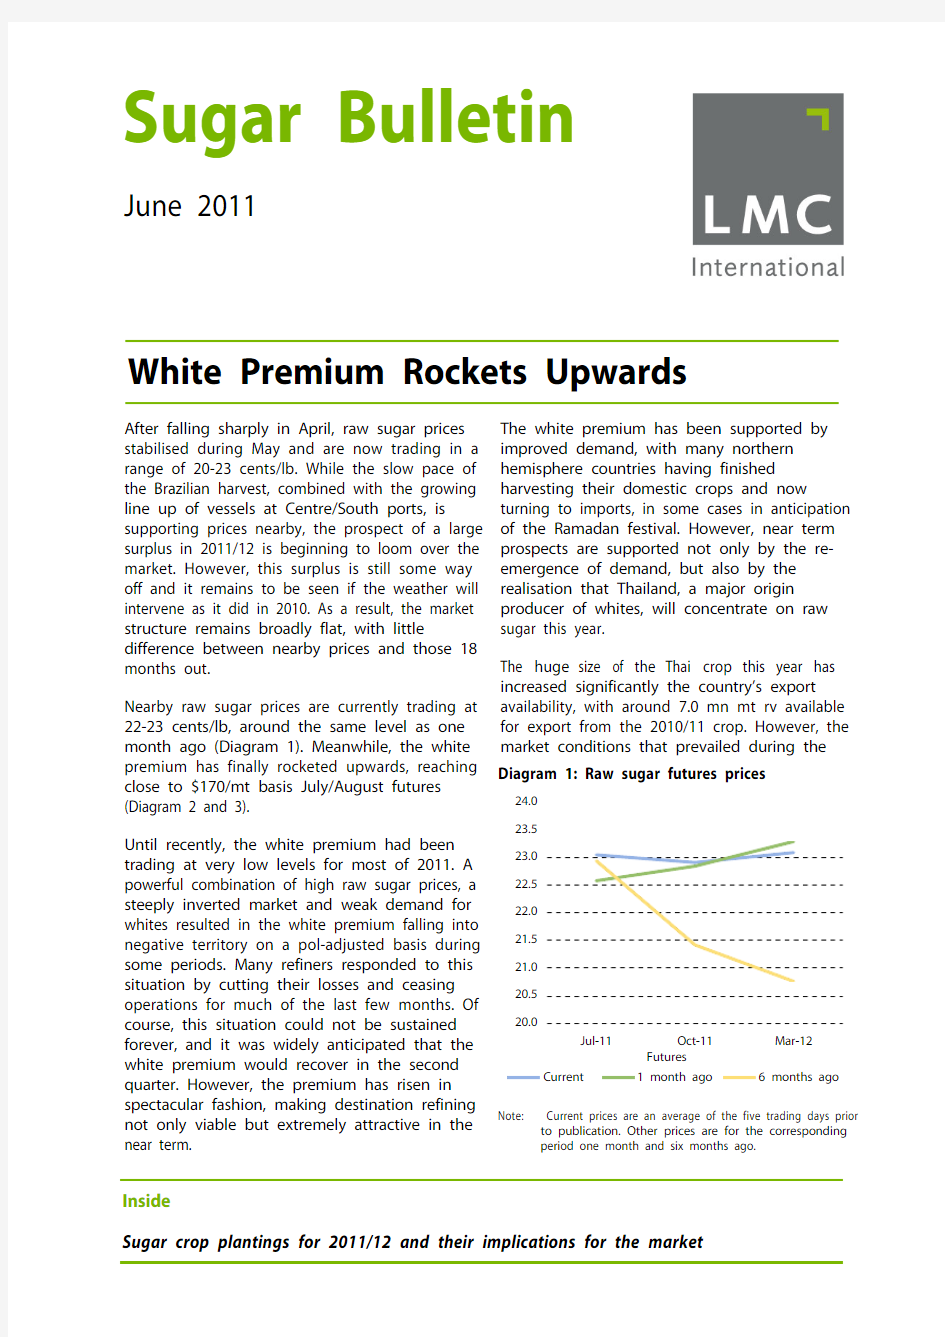
After falling sharply in April, raw sugar prices stabilised during May and are now trading in a range of 20-23 cents/lb. While the slow pace of the Brazilian harvest, combined with the growing line up of vessels at Centre/South ports, is supporting prices nearby, the prospect of a large surplus in 2011/12 is beginning to loom over the market. However, this surplus is still some way off and it remains to be seen if the weather will intervene as it did in 2010. As a result, the market structure remains broadly flat, with little difference between nearby prices and those 18 months out. Nearby raw sugar prices are currently trading at 22-23 cents/lb, around the same level as one month ago (Diagram 1). Meanwhile, the white premium has finally rocketed upwards, reaching close to $170/mt basis July/August futures (Diagram 2 and 3). Until recently, the white premium had been trading at very low levels for most of 2011. A powerful combination of high raw sugar prices, a steeply inverted market and weak demand for whites resulted in the white premium falling into negative territory on a pol-adjusted basis during some periods. Many refiners responded to this situation by cutting their losses and ceasing operations for much of the last few months. Of course, this situation could not be sustained forever, and it was widely anticipated that the white premium would recover in the second quarter. However, the premium has risen in spectacular fashion, making destination refining not only viable but extremely attractive in the near term.
The white premium has been supported by improved demand, with many northern hemisphere countries having finished harvesting their domestic crops and now turning to imports, in some cases in anticipation of the Ramadan festival. However, near term prospects are supported not only by the re-emergence of demand, but also by the realisation that Thailand, a major origin producer of whites, will concentrate on raw sugar this year.
The huge size of the Thai crop this year has increased significantly the country’s export availability, with around 7.0 mn mt rv available for export from the 2010/11 crop. However, the market conditions that prevailed during the
Diagram 1: Raw sugar futures prices
20.0
20.521.021.522.022.523.023.524.0Jul-11Oct-11Mar-12U S c e n t s /l b Current
1 month ago
6 months ago
Futures
Note: Current prices are an average of the five trading days prior
to publication. Other prices are for the corresponding period one month and six months ago.
Table 1: Supply/demand balance (million tonnes, centrifugal sugar, raw value)
2007 2008 2009 2010 2010 2011 2011 12 months
Total Total Total Oct-Dec Total Jan-Mar Apr-Jun to Jun 2011 World Production 164.7 162.6 152.5 56.8 158.3 51.4 24.1 164.6 World Consumption 156.7 159.2 160.7 41.2 163.1 40.2 41.3 163.0 Apparent Change in Stocks 8.1 3.4 -8.2 15.7 -4.8 11.2 -17.2 1.6 Statistical Adjustment -1.5 -3.2 -1.9 -0.1 -0.4 -0.9 -0.9 -2.1 Actual Change in Stocks 6.6 0.2 -10.1 15.5 -5.2 10.3 -18.1 -0.5 Total Stocks at End-Period 79.8 80.0 70.0 64.8 64.7 75.0 56.9 56.9 LMC Index of World Sugar Stocks 1.44 1.43 1.16 1.04 1.04 0.93 1.01 1.01 (Seasonally Adjusted)
New York No 11 (in $/mt) 218.2 266.7 396.4 639.5 491.1 672.5 520.2 572.8 London No 5 (in $/mt) 309.4 351.5 486.2 728.3 616.2 751.0 644.1 679.1
'True' White Premium (in $/mt) 66.4 56.6 50.9 30.5 75.8 18.4 72.4 52.0
Notes: 1: The LMC Index of World Sugar Stocks takes the value 1.00 at end-September 1980. LMC has calculated the seasonal adjustment that is required to bring each month's index of the stock:consumption ratio to the same base.
2: The 'True' White Premium is derived by deducting the value of the pol adjustment in refining.
3: The prices cover the period up to the last completed month prior to publication.
Sources: ISO Statistical Bulletin; US Dept of Agriculture; FIRS; F O Licht; LMC estimates.
Table 2: Sugar production (million tonnes, centrifugal sugar, raw value)
2007 2008 2009 2010 2010 2011 2011 12 months
Total Total Total Oct-Dec Total Jan-Mar Apr-Jun to Jun 2011 Total Africa 9.9 9.7 10.0 2.8 10.4 1.4 2.6 10.4 Cuba 1.2 1.4 1.4 0.0 1.1 0.8 0.3 1.1 Total C. America 12.2 12.1 11.7 1.9 11.6 6.8 3.1 11.8 USA 7.6 7.2 7.0 2.9 7.3 2.9 0.8 7.3 Total N. America 7.7 7.2 7.1 2.9 7.3 2.9 0.8 7.3 Brazil 33.1 33.6 35.7 9.8 41.2 2.0 10.0 38.6 Total S. America 40.9 41.2 43.8 11.4 48.4 3.1 11.4 46.0 India 29.1 25.9 15.7 8.3 22.2 14.8 2.6 26.2 Total Asia 63.4 63.0 49.2 16.9 52.2 36.2 5.9 60.8 Total Oceania 4.9 4.9 4.7 1.2 3.8 0.0 0.2 3.8 EU 16.8 15.3 16.9 12.5 15.7 0.6 0.1 15.6 Total Europe 25.8 24.5 26.1 19.8 24.7 1.0 0.1 24.4 World Total 164.7 162.6 152.5 56.8 158.3 51.4 24.1 164.6
Sources: ISO Statistical Bulletin; US Dept. of Agriculture: FIRS; F.O. Licht; LMC estimates.
Page 2 ? LMC International Ltd, 2011 Sugar Bulletin: June 2011
Sugar Bulletin: June 2011 ? LMC International Ltd, 2011 Page 3
Table 3: Sugar consumption (million tonnes, centrifugal sugar, raw value)
2007 2008 2009 2010
2010
2011 2011 12 months
Total Total Total Oct-Dec Total Jan-Mar
Apr-Jun to Jun 2011
Total Africa 15.1 15.8 16.0 4.2 16.2 3.9 4.0 16.3 Total C. America 8.8 8.7 8.6 1.9 8.1 2.0 2.1 8.1 USA
9.3 9.7 9.7 2.5 10.1 2.4 2.5 10.1 Total N. America 10.7 11.0 11.2 2.8 11.5 2.7 2.9 11.5 Brazil
11.5 11.8 12.6 3.0 12.1 3.1 3.4 12.5 Total S. America 19.0 19.4 20.3 5.0 19.8 4.8 5.4 20.4 India 23.0 23.6 24.6 5.6 24.6 5.9 6.1 23.8 Total Asia 69.9 71.5 72.7 17.8 74.0 19.3 18.9 73.3 Total Oceania 1.4 1.4 1.4 0.4 1.4 0.3 0.4 1.5 EU
18.6 18.8 18.6 5.2 18.7 4.2 4.8 18.7 Total Europe 31.6 31.4 30.5 9.0 32.0 7.1 7.8 32.0 World Total
156.7
159.2
160.7
41.2
163.1
40.2
41.3
163.0
Sources: ISO Statistical Bulletin; US Dept. of Agriculture: FIRS; F.O. Licht; LMC estimates.
Diagram 2: World white premium 70
8090100110120130140150160170Mar-11Apr-11
May-11Jun-11U S $/t o n n e (t e l q u e l )May/May 2011
August/July 2011
October/October 2011
Diagram 3: World raw and white sugar futures
prices
450500550600650700750800Mar-11
Apr-11
May-11Jun-11
U S $/t o n n e
No. 5 May-11No. 5 Aug-11No. 11 May-11
No. 11 July-11
peak harvest period (i.e., high raw sugar prices
and low white premium), as well as the desire among millers to produce sugar as quickly as possible to take advantage of high prices, means that this year’s output has been heavily biased towards raw sugar. At the end of May, milling statistics indicate that only around 43% of the crop has been produced as white or refined sugar, compared to 55-60% in normal years. Moreover, the re-melt programme, while underway, is expected to be unspectacular, despite the very favourable market signals, because Thai millers have already contracted large quantities of raw sugar for export.
One of the reasons for the strong demand for Thai raws has been the slow start to the Brazilian harvest. This has limited the availability of raw sugar for export. It also means that white sugar produced in the early part of the season has been directed to the domestic market, where, until recently, returns have been more favourable (Diagram 5). This has added further to nearby tightness in the whites market.
Page 4 ? LMC International Ltd, 2011 Sugar Bulletin: June 2011
Diagram 4: Indian domestic price vs. the No.5
550
600650
700
750
800
Mar-11Apr-11May-11Jun-11
U S $/t o n n e
Domestic Price (Delhi warehouse)No.5 nearby futures
Diagram 5: Ex-mill returns from bulk/bagged
sugar exports and domestic sugar in Brazil 400
450500
550600650700
750800
Mar-11
Apr-11May-11
Jun-11U S $/t o n n e
Bulk exports
Bagged exports
Domestic
Diagram 6: Brazil: Ex-mill returns from
domestic sugar, export sugar and ethanol
350400450500550600650700750800Mar-11
Apr-11May-11Jun-11
U S $/t o n n e Domestic sugar Export sugar (bulk)
Hydrous ethanol (VHP equivalent)
By May 16th , Centre/South Brazil had only crushed 56.6 mn mt of cane, 40% down on last
year, while sugar and ethanol production were approximately half the levels produced last year.
The slow start to the season was widely anticipated and has already been priced into the
market. Nevertheless, it has still resulted in a build up of vessels at Brazilian ports, with the situation looking very similar to last year. However, the reason for the line-up this year is that ships are waiting for sugar to arrive at the ports. The current line-up totals over 50 vessels. Constraints at Brazilian ports, together with any negative news about the progress of this year’s harvest, should continue to support sugar prices in the near term. However, the prospect of a
large global surplus in 2011/12 (Oct/Sept) is starting to loom over the market, with news of
plantings, which take place in the first quarter in most countries, beginning to emerge. In Russia, despite a slow start to the planting season, the Russian Sugar Producer’s Association has announced that plantings have surpassed the target of 1.2 mn hectares. By the end of May, a total of 1.23 mn hectares had been planted and, assuming normal weather conditions and yields, a record beet crop is certainly on the cards. Other beet producing countries, most notably the EU, have also been expanding planted area.
In India, initial industry estimates point to an increase in cane area of between 7-10%, increasing national area to around 5.3-5.4 mn hectares. Furthermore, latest meteorological reports point towards a normal monsoon this year, which should mean improved yields over
2010/11, when recovery rates where hit by late
rains. This means that sugar output in the region of 27 mn mt wv could be achievable. With the cassava crop still badly affected by pest
problems, Thai farmers are expected to stick with cane for another season. Reports suggest that, given good weather conditions, the cane crop could even exceed this year, reaching as much as 100 mn mt. In theory, these increases in beet and cane area
should translate into much greater global sugar
production in 2011/12. Indeed, our forecasts indicate a significant surplus of as much as eight million tonnes. While many other analysts have
produced similar forecasts, for the moment, this is not being reflected in forward futures prices,
which have continued to trade at a similar level to nearby values over the last month. This reflects the uncertainty about what the weather
Sugar Bulletin: June 2011 ? LMC International Ltd, 2011 Page 5
Sugar by-products and ethanol
Diagram 7: No. 11 commitments of traders
vs. nearby sugar prices
Jul-10
Sep-10Nov-10Jan-11Mar-11May-11
12
141618202224262830323436World sugar price (US cents/lb)
Net speculative position No 11 nearby futures price
N e t s p e c u l a t i v e p o s i t i o n (000 c o n t r a c t s )
will hold over the next few months. The experience of 2010/11 is still fresh in many people’s minds, when expectations of a large surplus were gradually eroded as weather events around the world took their toll on sugar crops. These problems only began in the summer months, when news emerged about the drought in Russia. Indeed, while the current drought in E urope is not thought to have affected the beet crop so far, if it continues it will undoubtedly have an adverse effect. This suggests that the prospect of a surplus may only be reflected in prices in later in the year when the Brazilian crop is in full flow and there is greater confidence about the prospect of a production surplus next season.
If a large surplus is realised, this will take the pressure off Brazil to continue maximising its sugar output. This is good news for consumers, particularly given that the dramatic slowdown in the expansion of cane area in Brazil means that any increase in production would have to come at the expense of ethanol. The arrival of new crop ethanol onto the market has pushed ethanol prices down to 20-21 cents/lb, ICE No.11 equivalent, which is around the level we expect them to average over the course of the season. If a large surplus looks likely, it should mean that sugar prices could be pushed below this level later in the year. However, any problems with the progress of Brazil’s harvest will make it harder for prices to be pushed below this support level.
Molasses
The US Gulf Blackstrap molasses price rose slightly over the last month reaching $176/mt in May. Meanwhile, EU cane molasses prices fell by $2/mt to $229/mt, while South Korean cane molasses prices also declined marginally to $187/mt (Diagram 8). Rising corn prices mean that molasses continues to look cheap as an input for animal feed. This is illustrated by Diagram 9, which compares corn and molasses prices. On a molasses equivalent basis, corn is now almost 20% more expensive than molasses. Corn prices have been supported by unfavourable weather, which has delayed US corn sowing. The USDA’s acreage report, which will provide clearer details on corn area, is due at the end of June. This will provide the next signal for the future direction of corn prices. Ethanol
In the US, gasoline prices dipped in May and now stand at US$0.80/lt. This is in contrast to ethanol prices, which have remained steady at
around $0.70/lt narrowing blenders margins. In the international market, high prices in Brazil have resulted in a diversion of surplus US ethanol from the E U to Brazil. However, this trade is likely to be short-lived as Brazilian prices are falling quickly. Moreover, although US output has rebounded after the decline in production during April, tight corn stocks remain a threat to producers’ margins.
Diagram 8: Molasses prices in key markets
100
125150175200225250Apr-09Sep-09Feb-10Jul-10Dec-10May-11U S $/t o n n e
US Blackstrap f.o.b. Gulf EU Cane c.i.f. Amsterdam EU Beet c.i.f. Amsterdam
South Korea (Cane) c.i.f.
Page 6 ? LMC International Ltd, 2011 Sugar Bulletin: June 2011
Table 4: Sugar by-products and ethanol prices
2007 2008 2009 2010 2010 2010
2011 2011
Average Average Average Jul-Sep Oct-Dec Average Jan-Mar Apr-Jun US Cane Molasses, Gulf ($/mt) 122.7 147.5 174.7 167.3 168.7 169.9 169.8 174.8 US Molasses:Maize Price Ratio 0.85 0.78 1.18 1.05 0.78 1.07 0.66 0.62 EU Molasses, Amsterdam ($/mt) 147.1 194.1 206.4 196.0 210.4 202.0 217.2 223.7 EU Molasses:Barley Price Ratio 0.60 0.82 1.37 0.90 0.80 1.13 0.77 0.80 EU Cane Molasses Import Levy/Tariff 0.00 0.00 0.00 0.00 0.00 0.00
0.00
0.0 (Euro/mt)
US Beet Pulp, Los Angeles ($/mt) 140.1 185.4 129.7 126.8 139.3 128.6 173.0 215.3 EU Beet Pulp, Rotterdam ($/mt) 269.6 286.2 148.7 202.1 263.2 190.1 323.9 224.7 US Ethanol Spot Price ($/lt) 0.58 0.63 0.48 0.52 0.65 0.54 0.69 0.75 US Gasoline Spot Price ($/lt) 0.54 0.65 0.43 0.51 0.57 0.54 0.68 0.81 Brent Crude Oil Price ($/barrel)
72.4 99.0 60.9 77.3 86.8 79.9
104.2
119.6
Sources: USDA; LEI; LMC estimates.
Political pressure to scale down the US$0.45 per gallon (US$0.12/lt) tax credit from which ethanol blenders benefit continues to grow. A bill has been introduced that would instead tie subsidies to movements in the oil price.
In Brazil, after record prices in the past two months, the start of the 2011/12 cane crushing campaign has helped ease prices, which averaged US$0.62/lt and US$0.88/lt in May for hydrous and anhydrous ethanol, respectively. This means that prices are starting to become competitive against gasoline again.
In the U, ethanol trading has been very subdued of late and prices averaged US$0.84/lt (spot FOB Rotterdam) during May. Motorists in Germany have been reluctant to use recently introduced E 10 principally out of concern that the higher ethanol blend could damage their engines. Concerns regarding the environmental benefits of ethanol and using food for fuel have also been cited.
While delays by the Commission in announcing which voluntary sustainability schemes will be approved have resulted in lacklustre demand, the industry continues to be hit by the high price of wheat and cash margins have been negative over the past two months. A number of plants have already ceased operations and others are considering suspending operations.
Diagram 9: Corn vs. molasses prices on a
molasses equivalent basis
406080100120140160180200220
2005
2006
2007
2008
2009
2010
2011
C o s t o n a m o l a s s e s e q u i v a l e n t b a s i s ($/t o n n e )
Corn US Gulf Blackstrap Molasses
Diagram 10: Brazilian, EU and US ethanol
prices
0.2
0.4
0.60.81.01.21.41.61.8May-09Sep-09Jan-10May-10Sep-10Jan-11May-11U S $/l i t r e Brazil Anhydrous US (CBOT 1st Position)EU Anhydrous (Rotterdam)
Sugar Bulletin: June 2011
? LMC International Ltd, 2011
Page 7
Alternative sweeteners
Diagram 11: Ratio of wholesale HFCS prices to
white sugar prices in the US
304050607080901001101201997
1999
2001
2003
2005
2007
2009
2011
R a t i o o f w h o l e s a l e p r i c e t o t h a t o f r e f i n e d s u g a r (%)
(42) HFCS
(55) HFCS
E ncouraging developments have been taking place in the beverage sector with a number of surveys pointing to an improved outlook in some of the key markets around the world. In April, Beverage World’s “State of the Industry” 2011 report revealed that the US market, which had a difficult period in 2009, is now starting to see better performance in nearly all of the drink categories. E ven the carbonated soft drinks sector, which had a particularly difficult five years, seems slowly to be picking up, capturing some market share from higher end energy drinks.
The diet segment of the market has also had a relatively good year, although it is still said to be underperforming. This is despite the push with natural sweeteners, which include stevia-based sweeteners. However, key market drivers for the sector, in terms of a health and weight management are still proving to be very much evident in the US market.
The findings are consistent with E uromonitor’s survey of the soft drinks sector carried out earlier in the year. In addition to better performance in the mature markets, Asia is predicted to overtake North America as the largest region in terms of overall soft drinks sales, in value terms, by the end of 2011. Health considerations are also driving consumption choices in this market. WOW! Nutrition, a pioneer and leading sweetener manufacturer in Brazil, launched 100% Stevia in May. This new line of sweeteners under the Doce Menor brand comes under a joint venture with PureCircle. Wow! Nutrition is the second largest sweetener manufacturer in Brazil and specializes in diet foods and healthy beverages. 100% stevia is their latest product line to be naturally sweetened with stevia. In other sweetener news, Tate & Lyle have made plans to reopen their mothballed US sucralose factory, expected to take place in the first half of the 2013 financial year. The plant, located in Alabama, had been closed in 2009 following Tate’s decision to integrate all their sucralose (Splenda) production in Singapore. Up until now, the company had indicated this had been sufficient to meet demand. Sucralose has been an extremely profitable business for Tate & Lyle
and the company has just reported a good year in terms of sales volumes. The sales growth has been helped by reduced selling prices, reflecting a strategy of securing long-term volume contracts with customers. In its 2011 end year results, the value share of sucralose in the high intensity sweeteners market rose from 27% to 28% in the last year, with Splenda’s share of the global market for sucralose still around 90%. Tate & Lyle foresees even rosier prospects in 2012, justifying its decision to utilise capacity at two global sites. Rising obesity levels in emerging markets has rapidly expanded the market for healthier low-calorie products. Several food manufacturers are also seeking to use a higher proportion of sweeteners in blends, given high sugar prices, to keep their costs down. This has helped the fortunes of sucralose which is stable under varying heat conditions and hence is attractive for use in warmer climates.
GLG Life Tech Corporation released information on its joint venture with China Agriculture and Healthy Foods Company Limited (CAHFC). The new venture will be called Dr. Zhang’s All Natural and Zero Calorie Beverage and Foods Company (ANOC). GLG announced that ANOC’s first line of six zero/low calorie teas will be the first to be sweetened with stevia, sourced from GLG. Most of the leading brands in China are sweetened with sugar. The new products are aimed at the ready-to-drink (RTD) teas which has been one of the fastest growing beverage categories in the country since 2000.
? LMC International Ltd. 2011. All rights reserved.
No material may be reproduced or transmitted, in whole or in part, in any manner, without written consent.E ditors: Martin Todd, Gareth Forber, Nikki Powell, Owen Wagner, Tara Nutt, Feifei Lu., Marsha Ribeiro, Rachel Cook, Suhrid Patel.
Table 5: Wholesale prices for alternative sweeteners
200720082009201020102010 2011 2011
Average Average Average Jul-Sep Oct-Dec Average Jan-Mar Apr-Jun USA Prices (in $/mt, dry basis, Midwest)
Bulk dry beet sugar 552.6717.6838.21,241.4 1,234.6 1165.9 1,219.3 1,228.3 Dextrose 620.5683.9746.3636.0 636.0 649.4 636.0 636.0 HFCS (42% fructose) 515.8607.0694.8539.5 654.2 587.0 663.7 663.7 HFCS (55% fructose) 561.5645.6726.5583.4 702.3 630.4 712.2 712.2 Glucose Corn Syrup 483.5564.1641.8559.4 667.1 590.3 676.1 676.1 Cost of Corn Wet Milling Inputs (in $/mt of Corn Sweetener, dry basis, ex-Chicago)
No. 2 Yellow Maize 245.0337.5249.0271.6 362.3 276.0 432.5 474.5 By-product credits 116.3163.7116.9120.5 159.5 128.2 181.3 191.9 Net cost of maize inputs 128.9173.1131.8151.7 203.2 147.9 253.0 281.7 Japanese Prices (in Yen/kg, dry basis)
Refined white soft sugar 154.5159.5167.2176.7 182.3 179.2 189.5
HFCS (42% fructose) 136.8157.0159.2149.6 151.3 150.6 160.1
HFCS (55% fructose) 145.0165.0167.2157.6 159.3 158.6 168.1
Index of Intense Sweetener Prices, World Market(1987=100)
World Raw Sugar Price 143.0174.9259.9291.5 419.2 321.9 440.9 341.1 Saccharin 64.1169.488.2103.3 109.3 71.2 117.7 38.3 Cyclamate (non-US markets) 216.0328.8351.2337.5 322.6 346.7 326.6 332.3 Aspartame (non-US markets) 15.315.815.615.0 15.2 15.2 15.1
Notes: 1: Figures in italics are based upon incomplete coverage of the period in question.
2: These corn sweetener prices are list prices, which are frequently very much higher than actual traded values for US
deliveries. US sugar prices, however, are actual traded values; thus the discounts for corn sweeteners shown in this table and Diagram 9 are understated.
Sources: Milling and Baking News; Feedstuffs; Mitsui; LMC estimates.
Summary
●World production rose by 4.8% to 164.6 mn
mt in the 12 months ending June 2011.
●World consumption grew by 0.5% to 163.0
mn mt during the same period.
●World stocks fell slightly by 0.9% to 56.9 mn
mt for the 12 months ending June 2011.
●Raw sugar prices stabilised during May
trading in a 20-23 cents/lb range. Meanwhile the white premium rocketed upwards to around $170/mt basis July/August futures. ●The slow pace of the Brazilian harvest and
the growing line up of vessels at Centre/South ports are supporting prices
nearby, however, the prospect of a large
surplus in 2011/12 is beginning to loom
over the market.
●Brazilian ethanol prices have fallen sharply
over the last few weeks as new crop ethanol
has become available.
●Recent survey’s of the global beverage
sector point to positive developments for
low calorie sweeteners.
LMC International
New York 1841 Broadway New York, NY 10023
USA
T +1 (212) 586-2427 F +1 (212) 397-4756 info@https://www.doczj.com/doc/6511654096.html,
Oxford
14-16 George Street
Oxford OX1 2AF
UK
T +44 1865 791737
F +44 1865 791739
info@https://www.doczj.com/doc/6511654096.html,
Kuala Lumpur
B-03-19, Empire Soho
Empire Subang
Jalan SS16/1, SS16
47500 Subang Jaya
Selangor Darul Ehsan
Malaysia
T +603 5611 9337
info@https://www.doczj.com/doc/6511654096.html, https://www.doczj.com/doc/6511654096.html,
木糖醇市场调研报告 说起口香糖,几乎没有人不知道它。在上个世纪四十年代,口香糖由西方传入。也不知从何时起,口香糖和木糖醇成了“连体婴”,甚至木糖醇的名气盖过了口香糖,尽管不少人还不太清楚木糖醇究竟是什么。人们渐渐已经习惯在超市里随手拿一盒木糖醇口香糖,似乎有了它,口香糖由原来的“一无是处”,变成如今的清洁口腔预防龋齿同时还能够减肥的“良药”。下面是小编整理的木糖醇市场调研报告,欢迎来参考! 鉴于木糖醇的优点,它大有取代蔗糖成为第一甜味剂的趋势。它从最早的口香糖已经衍生出了许多其他食品,甚至还有专门的“无糖食品专卖店”,其中商品琳琅满目,不仅有休闲小食品,还有大米、面粉等商品。似乎在食品中加入木糖醇已经成为了一种风尚,为什么木糖醇能享此殊荣,它真有那么神奇吗? 看上去、吃起来都像糖的东西到底是不是糖 几年前,当超市出现木糖醇口香糖的时候,虽然价格比普通口香糖要贵出5倍,但是好奇的顾客们都会顺带买上一盒,尝尝到底是什么味道。咀嚼上一到两块后,会发现味道也是甜丝丝的,和普通口香糖甜味相差无几。再仔细阅读产品包装的说明书后,会发现,据说这种含有木糖醇的口香糖
还可以防止蛀牙。于是,经过商家不遗余力的宣传,越来越多的年轻人成为木糖醇口香糖的忠实拥趸。 “没错,木糖醇和口香糖真是一对黄金搭档。”南京农业大学食品科技学院副教授安辛欣对于木糖醇在食品中的运用有着很高的评价,理由很简单――木糖醇不是糖但却像糖。 安辛欣告诉记者,木糖醇原产于芬兰,是从白桦树、橡树、玉米芯、甘蔗渣等植物中提取出来的一种天然植物甜味剂。在自然界中,它的分布范围很广,广泛存在于各种果品、蔬菜、谷类、蘑菇等食物之中。 对于我们的身体来说,木糖醇也不是一种“舶来品”,它本就是我们身体正常糖类代谢的中间体。一个健康成年人即使不吃任何含有木糖醇的食物,血液中也流动着0。03~0。06毫克/100毫克的木糖醇。 木糖醇学名叫做戊五醇,从化学的角度来看,属于一种多元醇,而且是多元醇中最甜的一种。纯的木糖醇是白色晶体或呈白色粉末状晶体,如果不是特别说明,无论是看起来还是尝起来,人们都很难将其同蔗糖分辨开来。如果低温品尝效果更佳,其甜度可以达到蔗糖的1。2倍。木糖醇入口后往往伴有微微的清凉感,令人感觉舒服,这是因为它易溶于水,并在溶解时吸收一定热量。
制糖行业研究报告 一、制糖行业概念 制糖业是利用甘蔗或甜菜等农作物为原料,生产原糖和成品食糖及对食糖进行精加工的工业行业。制糖业是资源型行业,糖价是判断制糖行业是否景气的最主要的指标。制糖行业也是周期性行业,糖价的波动主要是由供求关系所决定的。 糖料一般春季生长,10月开始收获。制糖企业每年从10、11月开榨到第二年3、4月停榨为一个生产周期,称为一个榨季。原料采购和生产呈现季节性和阶段性,而销售则是全年进行。 食糖既是人民生活的必需品,也是食品工业及下游产业的重要基础原料,与粮、棉、油等同属关系国计民生的大宗产品。制糖行业作为传统的农产品加工业,与糖料种植紧密相关。 二、国际制糖业状况分析 2.1、国际制糖业现状 2.1.1、国际原糖价格稍有回落,未来有望继续回落 图1:国际原糖现货价格
图2:2012年5月21日国际原糖价格 根据目前国际市场原糖的供给量来分析,由于缺少现货面支撑,本周一ICE糖市原糖期货价格经缩量窄幅整理后继续稍稍下跌,与此同时,伦敦糖市白糖期货价格也稍稍下跌。 2012年5月21日讯,路透社孟买消息,由于夏季需求一直没有得到大的改善,加上市场上食糖供给充足,上周五印度国内糖价小幅下跌。 尽管纽约原糖在20美分有企稳迹象,但国际市场供应充足,利空糖价。巴西最大糖贸易公司预计巴西中南部地区2012/2013年度糖产量为3200万吨。印度丰收在望,政府也为出口顺利积极放宽政策扫除障碍。据悉,印度最近不仅修改了食糖出口单次申请量限制,由原来的不超过1万吨提高到2.5万吨,而且还拟将糖出口装运期限由原来的30天放宽至60天。原糖跌至20美分附近处于相对低位,买家采购,印度得以出口更多糖。而泰国2012/2013年度则预计产糖
白糖市场研究报告 一食糖产品介绍 食糖是天然甜味剂,是人们日常生活的必需品,同时也是饮料、糖果、制药等含糖食品中不可或缺的原料。常规生产食糖的基本原料是甘蔗和甜菜。甘蔗生长于热带和亚热带地区,而甜菜生长于温带地区。在世界主要产糖国中,中国和美国是既种甘蔗又种甜菜,主要原因是中国和美国的国家幅员辽阔、纵跨纬度较大。但在中国,甘蔗占全部糖料生产的88%,甜菜占12%;而在美国,甜菜和甘蔗在糖料生产中所占比例接近,均为50%左右。 二食糖分类 按照不同的分类方法可将食糖分为不同的种类。根据加工环节不同、深加工程度不同、加工工艺不同、专用性不同,食糖可以分为原糖或粗糖、白砂糖、绵白糖、冰糖、方糖、赤砂糖、土红糖等。按加工程序不同可分为原糖和成品糖两种,原糖是由压榨厂一次性压榨甘蔗或甜菜之后结晶而得的产品,主要以散货形势存在。炼糖厂对原糖进一步深加工后,精炼出的就是不同规格的成品糖。在我国,成品糖又可细分为绵白糖、白砂糖、赤砂糖、冰糖等等,可直接用于食用消费或用于食品加工业消费。根据我国目前炼糖技术的不同(主要指在精炼过程中采用添加剂的不同),成品糖又可分为由亚硫酸法和碳化法精炼的硫化糖和碳化糖。在存储方面,碳化糖品质较优,在存储过程中,可以比较好地保持白色,不易发黄变色,但生产成本相对较高,市场价格较为昂贵。目前我国绝大部分糖厂生产的是硫化糖。目前世界市场上交易的主要是原糖。糖料与其它作物不同的是,收获后不能直接变成商品糖,必须经过工业化加工,因此白糖属于工业品。 三世界食糖市场介绍 世界食糖市场的特点: 1.生产相对集中。从生产方面来看,世界食糖的生产主要集中在少数几个国家,并且大多是第三世界国家,如巴西、印度、泰国等等。而全球几个主要产糖国的食糖除了满足本国国内的需求外,还要大量向国外出口,因为一些大的消费国生产不能自给,还需要进口,如俄罗斯、美国等。
( 研究报告) 姓名:____________________ 单位:____________________ 日期:____________________ 编号:YB-BH-047798 利用白糖期货市场研究报告Research Report on the utilization of sugar futures market
利用白糖期货市场研究报告 利用白糖期货市场研究报告 摘要:白糖期货已于20XX年1月6日在郑州商品交易所上市交易。广西是白糖主产区,深入研究广西利用白糖期货市场问题,对加快广西糖业向现代产业转变,以及推动广西资本市场的发展都具有十分重要的意义。本研究报告论述了白糖期货市场运行情况和广西利用白糖期货市场存在的问题,分析了广西利用白糖期货市场的必要性,提出广西利用白糖期货市场的目标、主要任务和对策措施建议。 关键词:期货市场;证券市场;期权 文章编号:1003-4625(2009)02-0084-06 中图分类号:F830.91 文献标识码:A Abstract: Sugar future was trade in Zhengzhou Commodity Exchange in Jan 6, 20xx. Guangxi is the main production region, so the research of the usage of sugar future market is greatly significant to promote sugar industry in Guangxi to be a modern industry and to improve the development of capital market in Guangxi. This study report discusses the situation of sugar future market and the problems in using
Sugar Bulletin Inside Sugar crop plantings for 2011/12 and their implications for the market June 2011 White Premium Rockets Upwards After falling sharply in April, raw sugar prices stabilised during May and are now trading in a range of 20-23 cents/lb. While the slow pace of the Brazilian harvest, combined with the growing line up of vessels at Centre/South ports, is supporting prices nearby, the prospect of a large surplus in 2011/12 is beginning to loom over the market. However, this surplus is still some way off and it remains to be seen if the weather will intervene as it did in 2010. As a result, the market structure remains broadly flat, with little difference between nearby prices and those 18 months out. Nearby raw sugar prices are currently trading at 22-23 cents/lb, around the same level as one month ago (Diagram 1). Meanwhile, the white premium has finally rocketed upwards, reaching close to $170/mt basis July/August futures (Diagram 2 and 3). Until recently, the white premium had been trading at very low levels for most of 2011. A powerful combination of high raw sugar prices, a steeply inverted market and weak demand for whites resulted in the white premium falling into negative territory on a pol-adjusted basis during some periods. Many refiners responded to this situation by cutting their losses and ceasing operations for much of the last few months. Of course, this situation could not be sustained forever, and it was widely anticipated that the white premium would recover in the second quarter. However, the premium has risen in spectacular fashion, making destination refining not only viable but extremely attractive in the near term. The white premium has been supported by improved demand, with many northern hemisphere countries having finished harvesting their domestic crops and now turning to imports, in some cases in anticipation of the Ramadan festival. However, near term prospects are supported not only by the re-emergence of demand, but also by the realisation that Thailand, a major origin producer of whites, will concentrate on raw sugar this year. The huge size of the Thai crop this year has increased significantly the country’s export availability, with around 7.0 mn mt rv available for export from the 2010/11 crop. However, the market conditions that prevailed during the Diagram 1: Raw sugar futures prices 20.0 20.521.021.522.022.523.023.524.0Jul-11Oct-11Mar-12U S c e n t s /l b Current 1 month ago 6 months ago Futures Note: Current prices are an average of the five trading days prior to publication. Other prices are for the corresponding period one month and six months ago.
白糖季节性研究报告 在国际市场上,食糖是成熟的也是比较活跃的交易品种。世界食糖产量1.21-1.40亿吨,产量超过1000万吨的国家和地区包括巴西、印度、欧盟、中国等,其中巴西产量超过2000万吨。巴西、欧盟、泰国是世界食糖主要出口国家,其产量和供应量对国家市场的影响较大。特别是巴西,作为世界食糖市场最具影响力和竞争力的产糖国,其每年的糖产量、货币汇率及其政府的糖业政策直接影响到国际食糖市场价格的变化走向。 我国是世界上第三大产糖国,前两位分别是巴西和印度。2003年之前,我国食糖仅仅当做是调味品,消费水平位于世界食糖平均消费的“低下水平”行列。随着我国经济的发展和人们生活水平的提高,食糖的消费量迅速上升。2003-2004年人均消费水平为8.9公斤/年,近几个榨季我国食糖的消费平均年增长率在4-7%之间。 从白糖的属性上看,既具有工业品性质也有农产品特征,依据白糖价格变化的走势可以看出,白糖生产销售的季节性特征明显,对其进行细致分析后,有利于投资者把握郑糖价格走势。 一、生产周期 我国食糖生产主要以甘蔗糖和甜菜糖为主。从产量上看,08/09榨季甜菜糖的产量占全国食糖产量的7.3%,甘蔗糖占92.7%。依据历年的产量比率比较,我国食糖品种中以甘蔗糖为主,因此,对白糖进行季节性分析时,主要研究蔗糖的原料--甘蔗的种植周期。 我国甘蔗种植的季节周期性很强,甘蔗的种植是一年一季,因此我国的食糖生产具有季产年销的特点。 影响甘蔗产量的主要原因有: 1、甘蔗宿根生长,甘蔗种植一次,宿根生长3年,根据农作物生长的自然周期,大年产量强于小年产量。 2、自然灾害影响甘蔗产量。根据甘蔗种植的季节性,食糖的生产周期大约为6年一个周期,三年增产三年减产。2000-2002年为增产三年,2003-2005年为减产三年,这是一个完整的周期。下一周期中2006-2008年为增产三年,2009-2011年为减产三年。在这一周期中2008年因罕见的暴雪灾害引起广西产量骤减,因此本属于增产周期内的2008年蔗糖产量不增反减。本榨季是减产周期的第三年。 一般在没有人为调控的生产周期内,糖料增产时蔗糖因丰产而低价倾销;而减产时因糖短缺待价而沽。甘蔗生产的周期性影响了白糖价格的波动。
一、基本面分析 (1)现货市场供求状况 一般来说,对于供给而言,商品供给的增加会引起价格的下降,供给的减少会引起价格的上扬;对于需求而言,商品需求的增加将导致价格的上涨,需求的减少导致价格的下跌。白糖的供求也遵循同样的规律。 1、白糖的供给 世界食糖产量1.21-1.40 亿吨,产量超过1000 万吨的国家和地区包括巴西、印度、欧盟、中国等,其中巴西产量超过2000 万吨。巴西、欧盟、泰国是世界食糖主要出口国家,其产量和供应量对国家市场的影响较大。特别是巴西,作为世界食糖市场最具影响力和竞争力的产糖国,其每年的糖产量、货币汇率及其政府的糖业政策直接影响到国际食糖市场价格的变化走向。 2、白糖的需求 世界食糖消费量约1.24 亿吨,消费量较大的的国家和地区包括印度、欧盟、中国、巴西等。从近几年消费情况来看,印度食糖年消费量维持在1900 万吨左右,欧盟消费量维持于1500 万吨左右,中国消费量增长至1100万吨左右,巴西年消费量950 万吨左右。 3、白糖进出口食糖进出口对市场的影响很大。食糖进口会增加国内供给数量,食糖出口会导致需求总量增加。对食糖市场而言,要重点关注世界主要出口国和主要进口国有关情况。世界食糖贸易量每年约为3700 万吨,以原糖为主。主要出口国为巴西、欧盟、泰国、澳大利亚、古巴等。主要进口国为俄罗斯、美国、印尼、欧盟、日本等。主要进口国的消费量和进口量相对比较稳定,而主要出口国的生产量和出口量变化较大,出口国出口量的变化对世界食糖市场的影响比进口国进口量的变化对世界食糖市场的影响大。 我国食糖处于供求基本平衡的状态,略有缺口,进口食糖以原糖为主。食糖进口仍然实行配额管理,2004-2006 年的每年配额均为194.5 万吨。2001- 2004年进口量分别为119.87 万吨、118.31 万吨、77.51 万吨、105.78 万吨,2005 年进口量为139 万吨。 我国市场出口量较少,2004 年仅为4.84 万吨。
2020年白糖产业链分析报告 2020年3月
研究背景 食糖产业周期性明显,2016 年-2018 年底行业进入下行周期,糖价不断下行。随着产能、库存的逐步去化,周期见底迹象显现,2019 年以来,糖价开始缓步抬升。 同时从国际方面来看,主产国泰国、印度减产明显,巴西产量维持低位。目前主流机构普遍预测2019/20 榨季,全球糖供给将出现300-600 万吨左右的缺口。近期国际糖价开始上行,为国内涨价奠定基础。 我们区别于市场的观点: 白糖进入减产周期这一观点目前已逐步获得市场认可,但是市场对供需缺口到底有多大、糖价弹性有多高存在较大分歧。我们通过分析我国白糖的主要供给来源地减产幅度、储备糖、进口数量等多因素的定量分析,测算出,新榨季国内总供给在1450 万吨左右,而食糖消费相对稳定在1500 万吨左右。从绝对量上来看,目前供给缺口不大(随着政策、天气等变化,不排除供给进一步减少可能),但糖在工业、居民生活中有着不可替代的作用,其足可以支撑国内糖价底部回升。
1、开启慢牛行情 1.1、糖价底部抬升 在经过2016 年底以来的连续下跌后,2019 年年初以来,我国白糖价格整体维持上涨。其中柳糖从年初的5040 元/吨,到2019 年10 月16 日上涨至19 年最高点,到6040 元/吨,涨幅17.9%,白糖期货价格(主力合约)从年初的4697 元/吨,至2019 年11 月6 日上涨至年内最高点,达5762 元/吨。 随后新榨季开始,供应充足,糖价小幅调整。2019 年11 月南方糖厂陆续开榨,12 月开榨产能已达顶峰,新糖产量不断提高。在进口和国储抛储两大利空因素的影响下,国内糖价至2019 年11 月下旬开始小幅调整。截止至2020 年2 月10 日,柳糖价格为5855 元/吨,白糖期货价格(主力合约)结算价为5779 元/吨。 图1:2019 年年初以来,白糖价格整体呈上涨趋势(单位:元/吨) 资料来源:wind,数据截止至2020 年2 月10 日 1.2、供给偏紧,奠定上涨基础 国内白糖需求稳定。当前我国食糖消费呈现“以工业消费为主、居民消费为辅”的格局。居民直接用糖稳定,食品工业用糖量成为需求主要动力,占总消费量的70%左右。由于人口增长放缓、我国经济向新常态转换,近年我国食糖消费量整体波动较小。根据美国农业部数据,2018 年我国食糖消费量为1580 万吨;而根据中国糖业协会数据统计显示,2017/2018 榨季我国食糖消费量为1510 万吨,同比增加20 万吨。综合来看,近年来我国食糖消费量在1500 万吨左右。
白糖项目 可行性研究报告规划设计/投资分析/产业运营
报告摘要说明 我国是全球第五大食糖生产国,南方盛产甘蔗、北方宜种甜菜。蔗糖是我国内糖的主要来源,甘蔗主产区位于广西、云南、广东等南方省份,甜菜主产区位于内蒙古、新疆、黑龙江等地区。2018/19榨季蔗糖产量占全国食糖产量88%,甜菜糖产量占比12%。我国食糖生产具有较强的周期性,大致以5-6年为一个生产周期,这与甘蔗宿根性特点相关,即甘蔗种植一次,宿根可以生长三年,待三年期满,蔗农才会考虑更换种植作物。 国内产量大幅下降或全球产需缺口是糖价主要驱动因素。国内糖消费量基本保持稳定,糖价波动主要由供给端变化所引发。国内糖产量占国内糖总供应量60%以上,并且呈现“三年增、三年减”的周期性变化,与国内糖价走势负相关。此外,国际糖价通过进口影响国内糖价格,国际糖价走势由全球糖产需缺口决定。 该白糖项目计划总投资6590.57万元,其中:固定资产投资4678.85万元,占项目总投资的70.99%;流动资金1911.72万元,占项目总投资的29.01%。 本期项目达产年营业收入16270.00万元,总成本费用12347.56 万元,税金及附加133.86万元,利润总额3922.44万元,利税总额4597.33万元,税后净利润2941.83万元,达产年纳税总额1655.50万
元;达产年投资利润率59.52%,投资利税率69.76%,投资回报率 44.64%,全部投资回收期3.74年,提供就业职位263个。 十几年以来,我国食糖生产具有非常强的周期性,主要原因:一是糖 料种植具有自然的周期性生长规律,如甘蔗种植一次,宿根可以生长3年;二是周期性出现的自然灾害也导致糖料生产的强周期性;三是糖料大幅减 产或增产,导致价格的大幅涨跌,从而影响第二年的播种面积。十几年来 食糖生产大致以5-6年为一个生产周期,基本上是2-3年连续增产,接下 来的2-3年连续减产。根据中国糖业协会数据,以最近的两个生产周期为例,2007/08榨季食糖产量创历史新高,达到1484.02万吨,随后2009/10 榨季、2010/11榨季、2011/12榨季食糖连续减产,产量分别为1073万吨、1045万吨、1151万吨,随后2012/13榨季、2013/14榨季进入增产周期, 产量分别为1306万吨、1331万吨,2014/15榨季开始又回到减产周期,2014/15榨季产量减为1052万吨,2015/16榨季产量870万吨。 自1990年以来,我国白糖消费经历了快速发展期与稳定期两个阶段:1990-2007年间白糖消费受到经济发展与人口增长的拉动快速提升,由 1990年745.1万吨增长到1350万吨,增长81.18%,年复合增长达到3.36%;2008年后由于经济发展疲软等原因,白糖消费稳定在1400-1600万吨左右。
(二零一二年十二月) 2020-2025年中国白糖行业 全国市场开拓策略研究报告 系统全面的实战解决方案 让每个人都能成为 战略专家 管理专家 行业专家 ……
报告目录 第一章企业全国市场开拓策略概述 (5) 第一节研究报告简介 (5) 第二节研究原则与方法 (5) 一、研究原则 (5) 二、研究方法 (6) 第三节研究企业全国市场开拓策略的重要性及意义 (8) 第二章市场调研:2019-2020年中国白糖行业市场深度调研 (9) 第一节白糖行业简要梳理 (9) 一、糖的大周期分析 (9) 二、白糖行业的淡旺季 (10) 三、我国白糖产量、消费量及进出口 (10) 四、全球产糖和出口情况 (13) 五、国家对糖业的政策 (15) 六、巴西、印度、泰国白糖行业情况 (16) (1)巴西 (16) (2)印度 (17) (3)泰国 (17) 七、小结 (18) 第二节2019-2020年中国白糖行业发展情况分析 (18) 一、国内白糖产量统计情况 (18) 二、中国食糖进口数量统计情况 (21) 三、中国食糖出口数量统计情况 (22) 四、我国糖主要进口国占比情况 (23) 五、白糖下游需求市场分布情况 (24) 第三节2020年白糖行业开启慢牛行情 (24) 一、糖价底部抬升 (24) 二、供给偏紧,奠定上涨基础 (25) 第四节2020年白糖行业国际市场分析 (26) 一、主产国减产,供给短缺显现 (26) 二、巴西:产量低位微幅提升 (30) 三、印度:产量减少,库存积压 (33) 四、泰国:干旱天气影响产量 (37) 第五节2020年国产糖:进入减产周期 (39) 一、近年来糖料种植面积减少 (39) 二、我国食糖生产相对集中 (40) 三、国内制糖进入减产周期 (41) 四、2019/20榨季减产 (42) 第六节2020年外糖:政策影响大,走私大幅减少 (44) 一、进口管控严格 (44) 二、严格打击走私 (46) 第七节2020年白糖工业库存低位,国储去库存 (47)
一、基本面分析 (一)现货市场供求状况 一般来说,对于供给而言,商品供给的增加会引起价格的下降,供给的减少会引起价格的上扬;对于需求而言,商品需求的增加将导致价格的上涨,需求的减少导致价格的下跌。白糖的供求也遵循同样的规律。 1、白糖的供给 世界食糖产量1.21-1.40亿吨,产量超过1000万吨的国家和地区包括巴西、印度、欧盟、中国等,其中巴西产量超过2000万吨。巴西、欧盟、泰国是世界食糖主要出口国家,其产量和供应量对国家市场的影响较大。特别是巴西,作为世界食糖市场最具影响力和竞争力的产糖国,其每年的糖产量、货币汇率及其政府的糖业政策直接影响到国际食糖市场价格的变化走向。 2、白糖的需求 世界食糖消费量约1.24亿吨,消费量较大的的国家和地区包括印度、欧盟、中国、巴西等。从近几年消费情况来看,印度食糖年消费量维持在1900万吨左右,欧盟消费量维持于1500万吨左右,中国消费量增长至1100万吨左右,巴西年消费量950万吨左右。 3、白糖进出口 食糖进出口对市场的影响很大。食糖进口会增加国内供给数量,食糖出口会导致需求总量增加。对食糖市场而言,要重点关注世界主要出口国和主要进口国有关情况。世界食糖贸易量每年约为3700万吨,以原糖为主。主要出口国为巴西、欧盟、泰国、澳大利亚、古巴等。主要进口国为俄罗斯、美国、印尼、欧盟、日本等。主要进口国的消费量和进口量相对比较稳定,而主要出口国的生产量和出口量变化较大,出口国出口量的变化对世界食糖市场的影响比进口国进口量的变化对世界食糖市场的影响大。 我国食糖处于供求基本平衡的状态,略有缺口,进口食糖以原糖为主。食糖进口仍然实行配额管理,2004-2006年的每年配额均为194.5万吨。2001-2004年进口量分别为119.87万吨、118.31万吨、77.51万吨、105.78万吨,2005年进口量为139万吨。 我国市场出口量较少,2004年仅为4.84万吨。
内蒙古甜菜糖市场调研报告 内蒙古甜菜糖市场最新调研报告 一、调研背景 北方甜菜糖以新疆地区最为集中,但近些年来内蒙古产能扩张明显,2017/18制糖年内蒙古地区产糖已经达到48万吨,而今年产量将会继续扩张,大有超过新疆成为北方第一甜菜糖产区之势。甜菜一般在每年的4月份种植,生长期7-8个月,制糖用甜菜属于一年生作物。甜菜不同于甘蔗,为了避免上冻,一般在每年的10-11月集中收获,也就是糖厂开机初期,收获后的甜菜放在地窖中储存,最多只能存放4个月,2月底之后冻化造成变质,因此甜菜糖厂收榨时间普遍较早,新疆最早收榨一般在1月底,内蒙古、河北和黑龙江最迟也在2月底之前就全部收榨。17/18榨季内蒙古甜菜糖厂为8家,18/19榨季将再增加6家,合计14家糖厂投产,新增糖厂分别为佰惠生的太仆寺旗宝昌糖厂、众益的额尔古纳糖厂、骑士乳业的敕勒川糖厂、凌云海的阿鲁科尔沁旗糖厂、奈曼旗糖厂、荷丰的扎赉特旗糖厂。 二、调研时间及路线 2018年4月10日-4月12日,张北-赤峰。 三、调研参与方 资讯网站、郑商所、期货公司、南方糖企、贸易商等。
四、调研内容 z糖厂。4月10日,我们首先来到河北Z糖厂调研,Z 糖厂拥有产能在4500吨/日,17/18榨季于2月底结束生产,种植面积万亩,收购甜菜量由16/17榨季的73万吨增至80万吨,单产超过吨,甜菜含糖%,产糖万吨。该地区是内蒙地区菜丝含糖量最高的地方,近5年以来除了2016年都保持在16%以上。今年的甜菜收购价均为550元/亩,比去年提高了30元,总共万亩,都已经在3月份签订。该糖厂纸筒比例达到85%,直播为15%。纸筒种植的成本大概在1500元,亩产可以达到4吨,而直播种植的成本为1200元,亩产只有3吨。 B糖厂。4月11日我们前往了赤峰xx县,该糖厂历史悠久,全部生产绵糖,也有原糖加工能力。17/18制糖年产糖7万多吨,颗粒粕3万吨,糖蜜万吨。去年签约18万亩菜地,收购甜菜63万多吨(前年万吨),净菜亩产能够达到吨/亩,其去年的产能已经能够达到6000吨,不过实际处理甜菜依旧是4000吨。由于该地区无霜期短,适合种甜菜,并不适合种植其他作物,因此争地的情况比较少。我们了解到,该糖厂12月之前定了很高的销售目标,这导致其销售进度很快,年前就已经销售了4万吨。由于提前卖糖,使得其今年的销售均价和去年相比几乎持平,规避了上半年糖价下跌的风险。其销售半径主要在东北三省。此外,我们还了