高三英语图表类作文模版
- 格式:docx
- 大小:433.93 KB
- 文档页数:11
高考英语指导写作专题:图表说明文一,图表说明1,分类:数字表、函数关系图、曲线图(graph);表格(table);几何图形(figure);图形表、饼状图(pie chart);条状图、柱状图(bar chart);平面图、示意图、外形图(diagram)。
2,一般可分三个层次来写:按照题目要求描述图表反映的总情况,即概括大意。
对数字进行仔细的比较,抓住特点进行分析、归纳并找出产生变化的原因。
读图表后的想法、结论、评论或针对反映出的问题采取的解决措施。
二.表达方式:1,常用的描述句型The table/chart/diagram/graph shows that ...According to the table/chart/diagram/graph...As is shown in the table/chart/diagram/graph...As can be seen from the table/chart/diagram/graph/figures...We can see from the figures/statistics...It is clear/ apparent from the figures/statistics...2.图表中数据(data)的具体表达法数据(data)在某一个时间段固定不变:fixed in time在一系列的时间段中转变:changes over time增加:increase/raise/rise/...减少:decrease/grow down/drop/fall/decline稳定:remain stable3.描写变化的形容词及副词rapid/rapidly,dramatic/dramatically,significant/significantly,sharp/sharplysteep/steeply,steady/steadily,gradual/gradually,slow/slowly,slight/slightly三、写作模板As (is) shown/indicated by the figure/in the table/graph/pie chart/chart,_____ has been increased/decreased significantly/steadily from _____ to_____. From the sharp decline/rise in the chart,it goes without saying that_____.There are at least two reasons accounting for / contributing to ____. On the one hand, _____ On the other hand, _____. _____is due to the fact that_____. In addition,_____is responsible for_____. Maybe there are other reasons to show. But it is generally believed that the above mentioned reasons are commonlyconvincing/persuasive.As far as I am concerned,I hold the view that_____. I am sure my opinion is both sound and well-grounded.四,作文范例1,最近你校对中学生的消费情况进行了调查。
![高考英语图表作文模板[1]](https://img.taocdn.com/s1/m/0ca7ba8002d276a200292e93.png)
英语图表作文模板推荐The chart gives us an overall picture of the ____________(图表主题)。
The first thing we notice is that_______________(图表最大特点)。
This means that as __________, _________________(进一步说明)。
We can see from the statistics given that _______________(图表细节一)。
After ving_________(细节一中的第一个变化), the _____Ved+幅度+时间(紧跟着的变化)。
The figures also tells us that_________________________(图表细节二)。
(数据位置,如In the second column), we can see that ____________accounts for _______(进一步描述)。
Judging from these figures, we can draw the conclusion that___________(结论)。
The reason for this, as far as I am concerned is that_____________(给出原因)。
/It is high time that we Ved(发出倡议)英语四六级作文模板大全(二) 图表式作文模板It is obvious in the graphic/table that the rate/number/amount of Y has undergone dramatic changes. It has gone up/grown/fallen/dropped considerably in recent years (as X varies). At the point of X1, Y reaches its peak value of …(多少). What is the reason for this change? Mainly there are … (多少)reasons behind the situation reflected in the graphic/table. First of all, …(第一个原因). More importantly, …(第二个原因). Most important of all, …(第三个原因). From the above discussions, we have enough reason to predict what will happen in the near future. The trend described in the graphic/table will continue for quite a long time (if necessary measures are not taken括号里的使用于那些不太好的变化趋势).图表作文写作常识1、图形种类及概述法:泛指一份数据图表:a data graph/chart/diagram/illustration/table饼图:pie chart直方图或柱形图:bar chart / histogram趋势曲线图:line chart / curve diagram表格图:table流程图或过程图:flow chart / sequence diagram程序图:processing/procedures diagram2、常用的描述用法The table/chart diagram/graph shows (that)According to the table/chart diagram/graphAs (is) shown in the table/chart diagram/graphAs can be seen from the table/chart/diagram/graph/figures,We can see from the figures/statisticsIt is clear from the figures/statisticsIt is apparent from the figures/statisticstable/chart/diagram/graph figures (that) ...table/chart/diagram/graph shows/describes/illustrates how......3、图表中的数据(Data)具体表达法数据(Data)在某一个时间段固定不变:fixed in time在一系列的时间段中转变:changes over time持续变化的data在不同情况下:增加:increase / raise / rise / go up ...减少:decrease / grow down / drop / fall ...波动:fluctuate / rebound / undulate / wave ...稳定:remain stable / stabilize / level off ...最常用的两种表达法:动词+ 副词形式(Verb+Adverb form)形容词+ 名词形式(Adjective+Noun form)相关常用词组1、主章开头图表类型:table、chart、diagramgraph、column chart、pie graph描述:show、describe、illustrate、can be seen from、clear、apparent、reveal、represent内容:figure、statistic、number、percentage、proportion2、表示数据变化的单词或者词组rapid/rapidly 迅速的,飞快的,险峻的dramatic/dramatically 戏剧性的,生动的significant/significantly 有意义的,重大的,重要的sharp/sharply 锐利的,明显的,急剧的steep/steeply 急剧升降的steady/steadily 稳固的,坚定不移的gradual/gradually 渐进的,逐渐的slow/slowly 缓慢的,不活跃的slight/slightly轻微的、略微地stable/stably 稳定的3、其它在描述中的常用到的词significant changes 图中一些较大变化noticeable trend 明显趋势during the same period 在同一时期grow/grew 增长distribute 分布,区别unequally 不相等地in the case of adv. 在...的情况下in terms of / in respect of / regarding 在...方面in contrast 相反,大不相同government policy 政府政策market forces 市场规率measure n. 尺寸,方法,措施v.估量,调节forecast n. 先见,预见v. 预测英语图表写作套句精选1.the table shows the changes in the number of……over the period from……to……该表格描述了在……年之……年间……数量的变化。

高考英语:满分作文经典模板之图表描述段
高考英语:满分作文经典模板之图表描述段
导读:本文高考英语:满分作文经典模板之图表描述段,仅供参照,
假如能帮助到您,欢迎谈论和分享。
【示例一】① From the picture (graph, chart, table, pie, bar),
we know that ________ (图表内容总概括). ② On the one hand, the left/first picture tells us that ________(状况一,图一 / 表一的
内容). ③ On the other hand, (the right/second)picture informs
us that ________(状况二,图二 / 表二的内容). ④ It can easily be seen that ________(揭示图画 / 表寓意) .【示例二】① As is
vividly shown/described/depicted in the cartoon/picture,(图表内容总概括). ② In the first picture, ________
图/ 表一内容,假如是一个表,则可左或上半部分) . ③ As is shown in the second drawing/picture, ________(描述图/表二内容,假如是
一个表,则右或下半部分) . ④ It is safe to draw the conclusion that (提示寓意,或主题句,回应主题但不是主题句的重复).。

英语作文图表作文(五篇范文)第一篇:英语作文图表作文图表分析作文1As is clearly shown in the table/ figure/ graph / chart, 图表总体描述 between 年代 and 年代.Especially, 突出的数据变化.There are three reasons for 具体表示急剧上升、下降或特殊现象的词.To begin with, 原因一.In addition / Moreover, 原因二.For example, 具体例证.Last but no least, 原因三.In short,总结上文.As far as I am concerned, / For my part, / As for me,作者自己的观点.On the one hand, 理由一.On the other hand, 理由二.In brief,总结上文.图表分析作文2The table / figure / graph / chart shows that 图表总述from 年代to年代.It is self-evident that突出的数据变化.Three possible reasons contribute to 具体表示急剧上升、下降或特殊现象的词或代词代替上文内容.One reason is that原因一.Another reason is that 原因二.For instance,举例证.What’s more原因三.As a result, 重述上文之趋势.However, in my opinion 作者观点.For one thing,理由一.For another, 理由二.T o sum up,总结上文.图表分析作文3It can be seen from the table / figure / graph / chart that图表总述between年代and年代.Especially,突出的数据变化.Why are there such great changes during 图表涉及的年头数years? There are mainly two reasons explaining具体表示急剧上升、下降或特殊现象的词或代词代替上文内容.First,原因一.In the old days,比较法说明过去的情况.But now,说明现在的情况.Second,原因二.As a result,总结上文.In my viewpoint,作者自己的观点.On the one hand,论点一.On the other hand,论点二.图表分析作文4As the table / figure / graph / chart shows,图表总述in the past years年代.Obviously,突出的数据变化.Why are there suchsharp contrasts during 图表涉及的年头 years?Two main factors contribute to具体表示急剧上升、下降或特殊现象的词或代词代替上文内容.First of all,原因一.In the past,比较法说明过去的情况.But now 说明现在的情况.Moreover,原因二.Therefore,总结上文.As I see it,作者自己的观点.For one thing,论点一.For another,论点二.图表作文补充句型• As is shown in the graph…如图所示…•The graph shows that…图表显示…•As can be seen from the table,…从表格中可以看出…•From the chart, we know that…从这张表中,我们可知…• All these data clearly prove the fact that… 所有这些数据明显证明这一事实,即…• The increase of ….In the ci ty has reached to 20%.….在这个城市的增长已达到20%.• In 1985, the number remained the same.1985年,这个数字保持不变.• There was a gradual decline in 1989.1989年,出现了逐渐下降的情况.第二篇:英语图表作文图表描述专题训练(一)这类作文时,注意以下几点:第一,审题时,除了要把握好图表的表层信息外,还要分析图标的深层含义,如原因、根源、可能的发展趋势等。
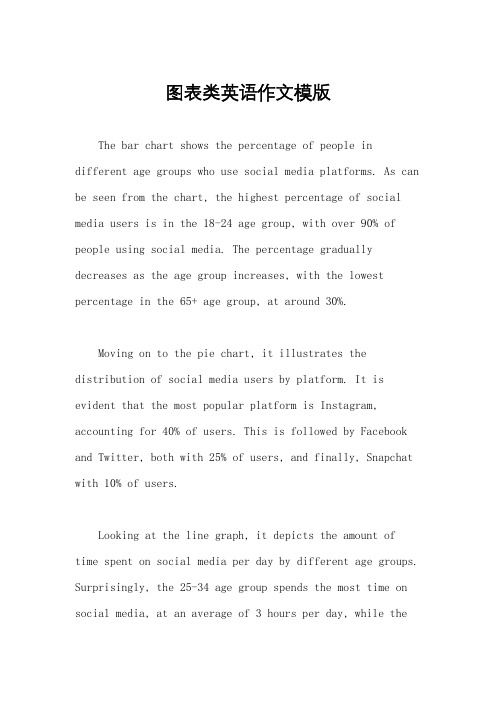
图表类英语作文模版The bar chart shows the percentage of people in different age groups who use social media platforms. As can be seen from the chart, the highest percentage of social media users is in the 18-24 age group, with over 90% of people using social media. The percentage gradually decreases as the age group increases, with the lowest percentage in the 65+ age group, at around 30%.Moving on to the pie chart, it illustrates the distribution of social media users by platform. It is evident that the most popular platform is Instagram, accounting for 40% of users. This is followed by Facebook and Twitter, both with 25% of users, and finally, Snapchat with 10% of users.Looking at the line graph, it depicts the amount of time spent on social media per day by different age groups. Surprisingly, the 25-34 age group spends the most time on social media, at an average of 3 hours per day, while the18-24 age group, despite having the highest percentage of users, only spends around 2 hours per day on social media.In conclusion, the charts provide valuable insightsinto the usage and preferences of social media among different age groups. It is clear that social media is most popular among younger age groups, with Instagram being the preferred platform, and the 25-34 age group spending the most time on social media.。

高考英语满分作文模板——图画/图表描述段
【示例一】
①From the picture (graph, chart, table, pie, bar), we know that ________(图表内容总概括). ②On the one hand, the left/first picture tells us that ________(情况一,图一/表一的内容). ③On the other hand, (the right/second)picture informs us that ________(情况二,图二/表二的内容).④It ca n easily be seen that ________(揭示图画/表寓意).
【示例二】
①As is vividly shown/described/depicted in the cartoon/picture, ________(图表内容总概括).②In the first picture, ________(描述图/表一内容,如果是一个表,则可左或上半部分).③As is shown in the second drawing/picture, ________(描述图/表二内容,如果是一个表,则右或下半部分).④It is safe to draw the conclusion that ________(提示寓意,或主题句,回应主题但不是主题句的重复).
我要投稿。
英语图表高中作文【优秀3篇】(经典版)编制人:__________________审核人:__________________审批人:__________________编制单位:__________________编制时间:____年____月____日序言下载提示:该文档是本店铺精心编制而成的,希望大家下载后,能够帮助大家解决实际问题。
文档下载后可定制修改,请根据实际需要进行调整和使用,谢谢!并且,本店铺为大家提供各种类型的经典范文,如工作资料、求职资料、报告大全、方案大全、合同协议、条据文书、教学资料、教案设计、作文大全、其他范文等等,想了解不同范文格式和写法,敬请关注!Download tips: This document is carefully compiled by this editor.I hope that after you download it, it can help you solve practical problems. The document can be customized and modified after downloading, please adjust and use it according to actual needs, thank you!In addition, this shop provides you with various types of classic model essays, such as work materials, job search materials, report encyclopedia, scheme encyclopedia, contract agreements, documents, teaching materials, teaching plan design, composition encyclopedia, other model essays, etc. if you want to understand different model essay formats and writing methods, please pay attention!英语图表高中作文【优秀3篇】There are differences between high school in China and that in the United States。
汾湖高级中学高三英语作文专题一出题人:审核人:日期:第一类:图表类作文写作步骤:1.点明图表所反映的主题。
常用词汇:table, chart, figure, graph, describe, tell,show, represent等2.分析数据差异及趋势或者描写数据代表内容。
注意层次。
常用词汇:rise,increase, drop, reduce, decrease, fall. but, on the contrary, however, the same as, be similar to, be different from 等3.归纳总结或发表自己看法。
常用词汇:in a word, in short, to sum up, We candraw the conclusion that……等。
重点句子:一.引入话题1.It can be seen from the table that….2.As is indicated in the chart,….3.From the sharp rise (上升n.) / decline (下降n.) in the chart, it goes without sayingthat….(不用说…)4.It has gone up(上升) / fallen / dropped(下降) considerably in recent years.二.描述变化或原因1.表示递进what’s more, besides, in addition, furthermore, to make mattersworse, what’s worse (更糟糕的是)2.表示解释account for , that is to say, mean, in other words3.表示变化---快速上升rise (increase / go up ) sharply (quickly, rapidly)Eg: The number sharply went up.---缓慢下降decrease (reduce/ come down/ decline/ drop/ fall) slowly---表示对比compare with , contrary to, on the contrary4.描述多重原因---There are several reasons behind the situation reflected in the above table. First of all, ……; More importantly,…….; Most importantly,……..;---There are at least two good reasons accounting for this phenomenon. On one hand,…….; On the other hand,………; In addition,…. is responsible for…. 三.总结或评论1.Personally speaking, in a word, in conclusion,2.It can be concluded that….(可以得出结论,)3.From the above discussion, we have enough reasons to predict what will happenin the near future.4.The trend described in the table will continue for quite a long time if necessarymeasures are not taken.5.As far as I’m concerned, I hold the view that……6.I’m sure my opinion is both sound and well-grounded. (既合理又理由充分)写作模版:1.分析图表数字代表内容As can be seen from the chart, _____________________(话题).Different people hold different opinions on this matter.Obviously, the majority of the people believe that ______________. However, others (20%) consider that_______________. Besides, another 5% hold the view that_______________.As far as I am concerned, we should pay more attention to __________. On one hand, ________________. On the other hand, __________________.2.分析数字反映的原因As can be seen from the chart, ____________________(话题). Different people hold different opinions. About 60% of the people ____________, while 25% of the people ______________.The least people, accounting for 15%, _______________.Various reasons are responsible for their different choices. To begin with, ___________. What’s more, ______________.Besides, _____________.As far as I am concerned, I am in favor of the view that_____________. I believe that ___________________.或As far as I am concerned, despite such problems, I hold the view that we should ________________. Only in this way can we _______________.下面的图表显示了你们学校高三学生周末放假的学习生活情况。
图表描述类英语作文(4篇)图表描述类英语作文篇一The above bar chart informs us of the phenomenon that there exist some differences in additional working hours among diverse careers, especially between self-employed businessmen and civil servants. Self-employed businessmen spend nearly 2 hours per day in working overtime. On the contrary, civil servants’ additional working hours is the shortest, only less than 50 minutes per day. The overtime of scientific researchers, cultural and sports workers and teachers is 80 minutes, 70 minutes and 55 minutes respectively.Ample reasons can account for this phenomenon. Firstly, to make more profits, self-employed businessmen have to spend more time in manufacturing products, attracting customers, providing after-sale services and managing staff. Moreover, with the competition becoming fiercer, they have no alternative but to work overtime to avoid being eliminated by the market and their rivals. When it comes to civil servants, things have gone otherwise. Confronted with less risks as well as pressures and leading a steady and routine life, they don’t have to work overtime frequently.Working overtime is a two-bladed sword. Surely, it will generate considerable benefits. However, it will give rise to some damages, especially to our health. We should balance our work, life and health or we will eventually become a machine and salve of work.四级英语作文图表类篇二图片模板:It seems to me that the cartoon / drawing issending a message about ____________(图画内容),which reveals ____________(稍作评价).In myperspective of view, ____________ (表明个人观点)。
图表类英语作文范文图表类型的英语写作如果不擅于观察漫画的话,作文写出来可能会偏题。
下面是小编给大家带来图表类英语作文,供大家参阅!图表类英语作文范文篇 1 第一段:说明图表开篇句:As the bar chart shows, ____ during the years of ____to____.扩展句:1、As early as _____.2、Then _____ years later, ____.3、And arriving in the year ____, ____.第二段:解释图表变化原因主题句:Several factors contribute to _____.扩展句:1、______. 原(因1)2、And ______.(原因2)3、Furthermore, ______ ( 原因3)4、All these result in ____.第三段:提出解决办法结尾句:However, ____ is faced with some problems.扩展句:1、With _____, ____, the effect of which is not only discouraging, but also challenging.2、So my principle is to pay due attention to ___, but notjustto____.示范第一段:说明图表开篇句:As the bar chart shows, the number of people below the poverty line decreased dramatically during the years of 1978 to1997.扩展句:1、As early as 1978, about 250 million people were under the poverty line.2、Then seven years later, the number became three fifthsthatof1978.3、And arriving in the year 1997, the number was reducedto50millions.第二段:解释图表变化原因主题句:Several factors contribute to the sharp decrease ofthe below-poverty population.扩展句:1、The reform and opening following 1978 enabledthe peasants to become much better off. ( 原因1)2、And with the development of Chinese economy, that policy also improved city dwellers lives greatly. ( 原因2)3、Furthermore, the high-tech introduced made it possiblefor the countrys economy as a whole to take off. ( 原因3)4 、All these result in the great fall of theChinesepopulationbelow the poverty line.第三段:提出解决办法结尾句:However, a further decrease in the number of poverty-stricken people is faced with some problems.扩展句:1、With quite few employees being laid off, the effect of which is not only discouraging, but also challenging.2 、So my principle is to pay due attention to the newcomers, but not just to care for the poor, say, in remote mountain areas.范文As the bar chart shows, the number of people below thepoverty line decreased dramatically during the years of 1978to 1997. Asearly as 1978, about 250 million people were underthe poverty line.Then seven years later, the number became three fifths that of 1978.And arriving in the year 1997, the number was reduced to 50 millions.Several factors contribute to the sharp decrease of the below-poverty population. The reform and opening following1978 enabled the peasants to become much better off. And with the development of Chinese economy, that policy also improved city dwellers lives greatly. Furthermore, the high-tech introduced made it possible for the countryseconomy as a whole to take off. All these result in the great fallof the Chinese population below the poverty line.However, a further decrease in the number of poverty-stricken people is faced with some problems. With quite few employees being laid off, the effect of which is notonly discouraging, but also challenging. So my principle is topay due attention to the newcomers, but not just to care forthe poor, say, in remote mountain areas.图表类英语作文范文篇2The past years have witnessed a mounting number of Chinese scholars returning from overseas. As is lively illustrated by the column chart, the number of returnees climbed from a mere 69.3 thousand in 2008 to over 272.9 thousand in 2012, at an annual increase rate of around 50%.A multitude of factors may have led to the tendency revealed by the chart, but the following are the critical ones from my perspective. First and foremost, along with the development of Chinese economy and society, the number ofChinese studying abroad has been soaring in the past years,which has provided an expanding base for the number of returnees. In the second place, the government has enacted aseries of preferential policies to attract overseas Chinesescholars back home. Last but not least, the booming economy, science and technology in this country have generated moreattative job opportunites for scholars returning from overseas.The waves of returnees will definitely contribute to this nation’s development, since they have brought back not only advanced science and technology but also pioneering concepts of education and management. With more scholarscoming back from overseas, and with the concerted efforts ofthe whole nation, we have reasons to expect a faster rejuvenation of this country.图表类英语作文范文篇 3 一、图表类型基本单词图表类型:table( 表格)、chart( 图表)、diagram( 图标)、graph( 多指曲线图) 、column chart( 柱状图) 、pie graph( 饼图) 、tree diagram( 树形图)、饼图:pie chart 、直方图或柱形图:bar chart/histogram 、趋势曲线图:line chart/curve diagram 、表格图:table 、流程图或过程图:flow chart/sequence diagram 、程序图:processing/procedures diagram二、图表描述基本词语1、描述:show 、describe 、illustrate 、can be seen from 、clear 、apparent 、reveal 、represent2、内容:figure 、statistic 、number 、percentage 、proportion三、常用的描述句型The table/chart diagram/graph shows (that)According to the table/chart diagram/graphAs (is) shown in the table/chart diagram/graphAs can be seen from the table/chart/diagram/graph/figures ,figures/statistics shows (that)……It can be seen from the figures/statisticsWe can see from the figures/statisticsIt is clear from the figures/statisticsIt is apparent from the figures/statisticstable/chart/diagram/graph figures (that) ……table/chart/diagram/graph shows/describes/illustrates看过图表类英语范文的人还。
高三英语作文专题 第一类:图表类作文 写作步骤: 1. 点明图表所反映的主题。常用词汇:table, chart, figure, graph, describe, tell, show, represent等
2. 分析数据差异及趋势或者描写数据代表内容。注意层次。常用词汇:rise, increase, drop, reduce, decrease, fall. but, on the contrary, however, the same as, be similar to, be different from 等
3. 归纳总结或发表自己看法。常用词汇:in a word, in short, to sum up, We can draw the conclusion that……等。
重点句子: 一.引入话题 1. It can be seen from the table that…. 2. As is indicated in the chart,…. 3. From the sharp rise (上升n.) / decline (下降n.) in the chart, it goes without saying that….(不用说…)
4. It has gone up(上升) / fallen / dropped(下降) considerably in recent years. 二.描述变化或原因 1. 表示递进what’s more, besides, in addition, furthermore, to make matters worse, what’s worse (更糟糕的是)
2. 表示解释 account for , that is to say, mean, in other words 3. 表示变化 ---快速上升rise (increase / go up ) sharply (quickly, rapidly) Eg: The number sharply went up. ---缓慢下降 decrease (reduce/ come down/ decline/ drop/ fall) slowly ---表示对比 compare with , contrary to, on the contrary 4. 描述多重原因 ---There are several reasons behind the situation reflected in the above table. First of all, ……; More importantly,…….; Most importantly,……..;
---There are at least two good reasons accounting for this phenomenon. On one hand,…….; On the other hand,………; In addition,…. is responsible for….
三.总结或评论 1. Personally speaking, in a word, in conclusion, 2. It can be concluded that….(可以得出结论,) 3. From the above discussion, we have enough reasons to predict what will happen in the near future.
4. The trend described in the table will continue for quite a long time if necessary measures are not taken.
5. As far as I’m concerned, I hold the view that…… 6. I’m sure my opinion is both sound and well-grounded. (既合理又理由充分) 写作模版: 1. 分析图表数字代表内容 Ascan be seen from the chart, _____________________(话题).Different people hold different opinions on this matter.
Obviously, the majority of the people believe that ______________. However, others (20%) consider that_______________. Besides, another 5% hold the view that_______________.
As far as I am concerned, we should pay more attention to __________. On one hand, ________________. On the other hand, __________________.
2. 分析数字反映的原因 As can be seen from the chart, ____________________(话题). Different people hold different opinions. About 60% of the people ____________, while 25% of the people ______________.The least people, accounting for 15%, _______________.
Various reasons are responsible for their different choices. To begin with, ___________. What’s more, ______________.Besides, _____________. As far as I am concerned, I am in favor of the view that_____________. I believe that ___________________.或 As far as I am concerned, despite such problems, I hold the view that we should ________________. Only in this way can we _______________.
图表类作文实战1: 下面的图表显示了你们学校高三学生周末放假的学习生活情况。 Ways to Spend the Weekend 根据上图信息,写一篇150词左右的短文,要求:1.简要描述图中信息;2.说明原因(为了高效学习,
回家休息在校学习户外运动锻炼身体,争分夺秒……)3.谈谈你自己的看法。 图表类作文实战1 答案: As can be seen from the chart, Senior Three students have different ways to spend their weekends. Different people hold different opinions. Most students would like to go back home and have a good rest, while 25% students choose to study at school during weekends. The least students, accounting for15%, are willing to take outdoor activities to spend their weekends.
Various reasons are responsible for their different choices. To begin with, those who choose to go back home believe that a good rest does help them relax and work more efficiently during the school time. What’s more, outdoor-activity lovers hold the opinion that taking exercise is a wonderful way to refresh themselves. However, a small number of students living far away from home tend to stay at school to save every minute to study.
As far as I am concerned, despite such problems, I hold the view that we should learn to relax ourselves besides concentrating on our studies.As we all know, a good rest and proper exercise can be of vital importance. Only in this way can we improve our efficiency and make our weekends meaningful.