python第16章下载数据课后习题答案
- 格式:docx
- 大小:718.81 KB
- 文档页数:8
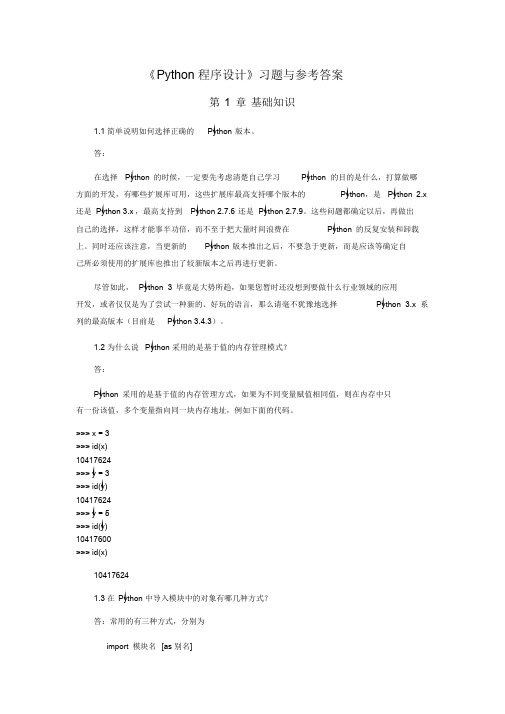
《Python 程序设计》习题与参考答案第1章基础知识1.1 简单说明如何选择正确的Python 版本。
答:在选择Python 的时候,一定要先考虑清楚自己学习Python 的目的是什么,打算做哪方面的开发,有哪些扩展库可用,这些扩展库最高支持哪个版本的Python,是Python 2.x 还是Python 3.x ,最高支持到Python 2.7.6 还是Python 2.7.9。
这些问题都确定以后,再做出自己的选择,这样才能事半功倍,而不至于把大量时间浪费在Python 的反复安装和卸载上。
同时还应该注意,当更新的Python 版本推出之后,不要急于更新,而是应该等确定自己所必须使用的扩展库也推出了较新版本之后再进行更新。
尽管如此,Python 3 毕竟是大势所趋,如果您暂时还没想到要做什么行业领域的应用开发,或者仅仅是为了尝试一种新的、好玩的语言,那么请毫不犹豫地选择Python 3.x 系列的最高版本(目前是Python 3.4.3)。
1.2 为什么说Python 采用的是基于值的内存管理模式?答:Python 采用的是基于值的内存管理方式,如果为不同变量赋值相同值,则在内存中只有一份该值,多个变量指向同一块内存地址,例如下面的代码。
>>> x = 3>>> id(x)10417624>>> y = 3>>> id(y)10417624>>> y = 5>>> id(y)10417600>>> id(x)104176241.3 在Python 中导入模块中的对象有哪几种方式?答:常用的有三种方式,分别为import 模块名[as 别名]from 模块名import 对象名[ as 别名]from math import *1.4 使用pip 命令安装numpy 、scipy 模块。
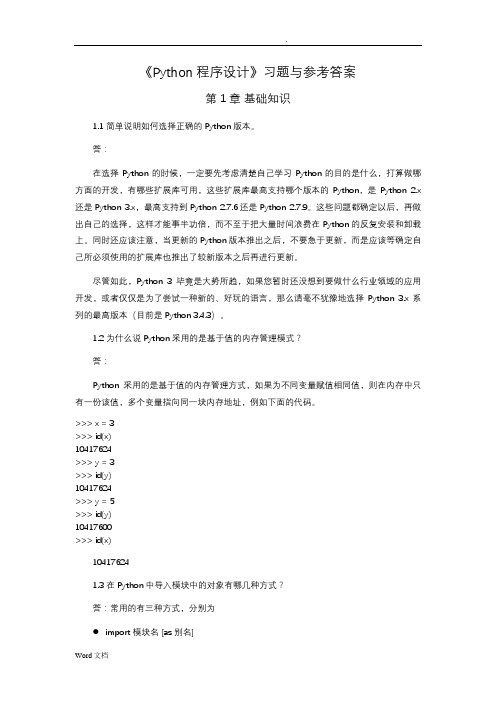
《Python程序设计》习题与参考答案第1章基础知识1.1 简单说明如何选择正确的Python版本。
答:在选择Python的时候,一定要先考虑清楚自己学习Python的目的是什么,打算做哪方面的开发,有哪些扩展库可用,这些扩展库最高支持哪个版本的Python,是Python 2.x 还是Python 3.x,最高支持到Python 2.7.6还是Python 2.7.9。
这些问题都确定以后,再做出自己的选择,这样才能事半功倍,而不至于把大量时间浪费在Python的反复安装和卸载上。
同时还应该注意,当更新的Python版本推出之后,不要急于更新,而是应该等确定自己所必须使用的扩展库也推出了较新版本之后再进行更新。
尽管如此,Python 3毕竟是大势所趋,如果您暂时还没想到要做什么行业领域的应用开发,或者仅仅是为了尝试一种新的、好玩的语言,那么请毫不犹豫地选择Python 3.x系列的最高版本(目前是Python 3.4.3)。
1.2 为什么说Python采用的是基于值的内存管理模式?答:Python采用的是基于值的内存管理方式,如果为不同变量赋值相同值,则在内存中只有一份该值,多个变量指向同一块内存地址,例如下面的代码。
>>> x = 3>>> id(x)10417624>>> y = 3>>> id(y)10417624>>> y = 5>>> id(y)10417600>>> id(x)104176241.3 在Python中导入模块中的对象有哪几种方式?答:常用的有三种方式,分别为import 模块名 [as 别名]●from 模块名 import 对象名[ as 别名]●from math import *1.4 使用pip命令安装numpy、scipy模块。
答:在命令提示符环境下执行下面的命令:pip install numpypip install scipy1.5 编写程序,用户输入一个三位以上的整数,输出其百位以上的数字。


python基础习题答案Python基础习题答案Python是一种简单易学的编程语言,广泛应用于各个领域。
对于初学者来说,通过练习一些基础习题可以帮助巩固所学的知识,并提升解决问题的能力。
下面将给出一些常见的Python基础习题,并给出相应的答案。
1. 编写一个程序,输出1到100之间所有的偶数。
答案:```pythonfor i in range(1, 101):if i % 2 == 0:print(i)```2. 编写一个程序,计算1到100之间所有奇数的和。
答案:```pythonsum = 0for i in range(1, 101):if i % 2 != 0:sum += iprint(sum)```3. 编写一个程序,判断一个数是否为素数。
答案:```pythonnum = int(input("请输入一个正整数:"))is_prime = Trueif num <= 1:is_prime = Falseelse:for i in range(2, int(num ** 0.5) + 1):if num % i == 0:is_prime = Falsebreakif is_prime:print(num, "是素数")else:print(num, "不是素数")```4. 编写一个程序,找出一个字符串中出现次数最多的字符。
答案:```pythonstring = input("请输入一个字符串:")char_count = {}for char in string:if char in char_count:char_count[char] += 1else:char_count[char] = 1max_count = max(char_count.values())most_frequent_chars = [char for char, count in char_count.items() if count == max_count]print("出现次数最多的字符是:", most_frequent_chars)```5. 编写一个程序,将一个列表中的元素去重。
Python基础教程习题(含答案)第一章一、判断题1、Python是一种跨平台、开源、免费的高级动态编程语言。
(对)2、Python 3.x完全兼容Python 2.x。
(错)3、在Windows平台上编写的Python程序无法在Unix平台运行。
(错)4、不可以在同一台计算机上安装多个Python版本。
(错)5、pip命令也支持扩展名为.whl的文件直接安装Python扩展库。
(对)二、填空题1、Python安装扩展库常用的是_______工具。
(pip)2、在IDLE交互模式中浏览上一条语句的快捷键是__________。
(Alt+P)3、Python程序文件扩展名主要有__________和________两种,其中后者常用于GUI 程序。
(py、pyw)4、Python源代码程序编译后的文件扩展名为_________。
(pyc)5、使用pip工具升级科学计算扩展库Numpy的完整命令是______________。
(pip install --upgrade Numpy)6、使用pip工具安装科学计算扩展库Numpy的完整命令是___________。
(pip install Numpy)7、使用pip工具查看当前已安装的Python扩展库的完整命令是__________。
(pip list)8、现有一python文件为“Stu.py”,ico文件为“Stu.ico”,两者均在同一目录下,现要将Stu.py打包发布在此目录下,所发布的文件图标采用Stu.ico,需要使用的命令是_____________。
(pyinstaller –I Stu.ico –F Stu.py)第二章一、判断题1、已知 x = 3,那么赋值语句 x = 'abcedfg' 是无法正常执行的。
(错)2、Python变量使用前必须先声明,并且一旦声明就不能再当前作用域内改变其类型。
(错)3、Python采用的是基于值得自动内存管理方式。

《 Python 程序设计》习题与参考答案 第 1 章 基础知识 1.1 简单说明如何选择正确的 Python 版本。 答: 在选择 Python 的时候,一定要先考虑清楚自己学习 Python 的目的是什么,打算做哪 方面的开发,有哪些扩展库可用,这些扩展库最高支持哪个版本的 Python ,是 Python 2.x 还是 Python 3.x ,最高支持到 Python 2.7.6 还是 Python 2.7.9 。这些问题都确定以后,再做出 自己的选择,这样才能事半功倍,而不至于把大量时间浪费在 Python 的反复安装和卸载 上。同时还应该注意,当更新的 Python 版本推出之后,不要急于更新,而是应该等确定自 己所必须使用的扩展库也推出了较新版本之后再进行更新。
尽管如此, Python 3 毕竟是大势所趋,如果您暂时还没想到要做什么行业领域的应用 开发,或者仅仅是为了尝试一种新的、好玩的语言,那么请毫不犹豫地选择 Python 3.x 系 列的最高版本(目前是 Python 3.4.3 )。
1.2 为什么说 Python 采用的是基于值的内存管理模式? 答: Python 采用的是基于值的内存管理方式,如果为不同变量赋值相同值,则在内存中只 有一份该值,多个变量指向同一块内存地址,例如下面的代码。
>>> x = 3 >>> id(x) 10417624 >>> y = 3 >>> id(y) 10417624 >>> y = 5 >>> id(y) 10417600 >>> id(x)
10417624 1.3 在 Python 中导入模块中的对象有哪几种方式? 答:常用的有三种方式,分别为 import 模块名 [as 别名 ] from 模块名 import 对象名 [ as 别名 ] from math import * 1.4 使用 pip 命令安装 numpy 、 scipy 模块。 答:在命令提示符环境下执行下面的命令: pip install numpy pip install scipy 1.5 编写程序,用户输入一个三位以上的整数,输出其百位以上的数字。例如用户输入 1234,则程序输出 12。(提示:使用整除运算。)
python习题答案Python习题答案Python作为一门简单易学且功能强大的编程语言,受到了越来越多的关注和应用。
无论是初学者还是有经验的开发者,都会遇到一些难题和习题。
本文将给出一些Python习题的答案,帮助读者更好地理解和掌握Python编程。
1. 编写一个程序,计算并输出1到100之间所有偶数的和。
答案:```pythonsum = 0for i in range(2, 101, 2):sum += iprint("1到100之间所有偶数的和为:", sum)```2. 编写一个程序,判断一个数是否为素数。
答案:```pythondef is_prime(n):if n <= 1:return Falsefor i in range(2, int(n**0.5) + 1):if n % i == 0:return Falsereturn Truenum = int(input("请输入一个整数:"))if is_prime(num):print(num, "是素数")else:print(num, "不是素数")```3. 编写一个程序,找出一个字符串中出现次数最多的字符及其出现次数。
答案:```pythondef max_occurrences(s):char_dict = {}for char in s:if char in char_dict:char_dict[char] += 1else:char_dict[char] = 1max_count = 0max_char = ''for char, count in char_dict.items():if count > max_count:max_count = countmax_char = charreturn max_char, max_countstring = input("请输入一个字符串:")char, count = max_occurrences(string)print("出现次数最多的字符是:", char)print("出现次数为:", count)```4. 编写一个程序,将一个列表中的元素按照从大到小的顺序排列。
Python程序设计基础习题答案与分析程昱第1章基础知识1.1简单说明如何选择正确的Python版本。
答:在选择Python的时候,一定要先考虑清楚自己学习Python的目的是什么,打算做哪方面的开发,有哪些扩展库可用,这些扩展库最高支持哪个版本的Python,是Python2.x还是Python3.x,最高支持到Python2.7.6还是Python2.7.9。
这些问题都确定以后,再做出自己的选择,这样才能事半功倍,而不至于把大量时间浪费在Python的反复安装和卸载上。
同时还应该注意,当更新的Python版本推出之后,不要急于更新,而是应该等确定自己所必须使用的扩展库也推出了较新版本之后再进行更新。
尽管如此,Python3毕竟是大势所趋,如果您暂时还没想到要做什么行业领域的应用开发,或者仅仅是为了尝试一种新的、好玩的语言,那么请毫不犹豫地选择Python3.x系列的最高版本(目前是Python3.4.3)。
1.2为什么说Python采用的是基于值的内存管理模式?Python采用的是基于值的内存管理方式,如果为不同变量赋值相同值,则在内存中只有一份该值,多个变量指向同一块内存地址,例如下面的代码。
>>>x=3>>>id(x)10417624>>>y=3>>>id(y)10417624>>>y=5>>>id(y)10417600>>>id(x)10417624>>>x=[1,2,3,1,1,2]>>>id(x[0])==id(x[3])==id(x[4])True1.3解释Python中的运算符“/”和“//”的区别。
答:在Python2.x中,“/”为普通除法,当两个数值对象进行除法运算时,最终结果的精度与操作数中精度最高的一致;在Python3.x中,“/”为真除法,与除法的数学含义一致。
Python 程序设计智慧树知到课后章节答案2023年下四川师范大学四川师范大学第一章测试1.python软件安装过程中,“Customize installation”指用户可以自定义安装,选择安装路径。
()答案:对2.python的第三方库即标准库。
()答案:错3.python是一种()类型的编程语言。
答案:解释4.Python语句print("中国,你好!")的输出为()。
答案:中国,你好!5.Python第三方库的常见安装方法有()。
文件安装;pip安装;自定义安装第二章测试1.turtle模块是一个直观有趣的图形绘制函数库,是Python 的标准库之一。
()答案:对2.在turtle坐标体系中,(0,0)坐标位于窗口的左上角。
()答案:错3.下面对turtle库最适合的描述是()。
答案:绘图库4.turtle库中将画笔移动x像素的语句是()。
答案:turtle.forward(x)5.下面属于turtle的全局控制函数的是()。
invisible();reset();clear()第三章测试1.使用turtle绘制图形,必须使用setup函数设置主窗体的大小和位置。
答案:错2.算法是为解决问题的计算部分而采取的方法与步骤,是程序设计的精髓。
()答案:对3.以下不是IPO模式的是()。
答案:program4.python的数据输入来源包括()。
答案:内部参数输入;控制台输入;文件输入;网络输入5.绘制图形中,涉及相同重复的动作,采用循环结构可以让程序结构更简洁、明了。
答案:对第四章测试1.以下选项中,结果为False的是()答案:False != 02.当成绩不小于60分时显示结果“及格”,程序中实现该功能应该使用()答案:单分支结构3.关于Python的分支结构,以下选项中描述错误的是()答案:分支结构可以向已经执行过的语句部分跳转4.下列哪些选项可以作为分支结构的条件表达式?()答案:1==1;a in [1,3,5];x>y or y<100;x+55.条件表达式的结果只有两个值True和False()答案:对6.多分支结构中可以有多于一个分支所包含的语句块被执行()答案:错第五章测试1.有以下程序片断:<br>num=0<br>str="stargazers"<br>for ch instr:<br>if(ch=='s') or (ch=='z'):<br>num+=1<br>print(num)<br>运行结果为()答案:32.关于Python循环结构,以下选项中描述错误的是()答案:每个continue语句只有能力结束当前层的循环的运行。
python基础教程课后答案Python基础教程第2版Python基础教程课后答案Python基础教程第2版Python是一种热门的编程语言,因其简洁易学而备受欢迎。
本文将为你提供Python基础教程第2版的课后答案,帮助你巩固所学知识。
第一章:起步1. Python是一种什么类型的语言?答:Python是一种高级、解释型的通用编程语言。
2. 为什么选择Python作为你的编程语言?答:Python具有简洁易学的语法,广泛的应用领域,丰富的第三方库支持,以及活跃的社区。
3. 请给出一个Python解释器的例子。
答:Python解释器的例子有CPython、Jython、IronPython等。
第二章:基础知识1. 如何使用print函数输出内容?答:使用print函数并在括号内引用要输出的内容,如print("Hello, World!")。
2. Python中的注释如何表示?答:可以使用#开头表示单行注释,或者使用""" """将多行内容注释起来。
3. 如何为变量赋值?答:使用等号将值赋给变量,如x = 10。
4. 如何使用input函数接收用户输入?答:使用input函数,并将输入的内容赋给一个变量,如name = input("请输入您的名字:")。
5. Python中的变量名有什么规则?答:变量名可以包含字母、数字和下划线,但不可以以数字开头。
变量名区分大小写。
6. 请写一个简单的条件语句的例子。
答:如下所示:x = 10if x > 5:print("x大于5")else:print("x小于等于5")第三章:控制流1. 请列举Python中的三种循环结构。
答:Python中的循环结构有for循环、while循环和嵌套循环。
2. 如何使用for循环遍历一个列表?答:可以使用for循环和in关键字遍历一个列表,如:fruits = ["apple", "banana", "orange"]for fruit in fruits:print(fruit)3. 如何使用while循环实现计数器?答:可以使用while循环和计数器变量实现计数功能,如:count = 0while count < 5:print(count)count += 14. 请写一个简单的break语句的例子。
Solutions - Chapter 16
16-2: Sitka-Death Valley Comparison
The temperature scales on the Sitka and Death Valley graphs reflect the different ranges of the data. To accurately compare the temperature range in Sitka to that of Death Valley, you need identical scales on the y-axis. Change the settings for the y-axis on one or both of the charts in Figures 16-5 and 16-6, and make a direct comparison between temperature ranges in Sitka and Death Valley (or any two places you want to compare). You can also try plotting the two data sets on the same chart.
The pyplot function ylim() allows you to set the limits of just the
y-axis. If you ever need to specify the limits of the x-axis, there’s a corresponding xlim() function as well.
Output:
Using the same limits for the ylim() function with the Death Valley data results in a chart that has the same scale:
There are a number of ways you can approach plotting both data sets on the same chart. In the following solution, we put the code for reading the csv file into a function. We then call it once to grab the highs and lows for Sitka before making the chart, and then call the function a second time to add Death Valley’s data to the existing plot. The colors have been adjusted slightly to make each location’s data distinct.
16-3: Rainfall
Choose any location you’re interested in, and make a visualization that plots its rainfall. Start by focusing on one month’s data, and then once your code is working, run it for a full year’s data.
Note: You can find the data file for this example here.
Output:
16-4: Explore
Generate a few more visualizations that examine any other weather aspect you’re interested in for any locations you’re curious about.
I live in a rainforest, so I was interested in playing with the rainfall data.
I calculated the cumulative rainfall for the year, and plotted that over the daily rainfall. Even after living in this rain, I’m surprised to see how much we get.
Output:。