Interference-free determination of indole-3-acetic acid using second-order calibration with EEM
- 格式:pdf
- 大小:3.03 MB
- 文档页数:6
CD-ROM3050B - 1Revision 2December 1996METHOD 3050BACID DIGESTION OF SEDIMENTS, SLUDGES, AND SOILS1.0 SCOPE AND APPLICATION1.1 This method has been written to provide two separate digestion procedures, one forthe preparation of sediments, sludges, and soil samples for analysis by flame atomic absorption spectrometry (FLAA) or inductively coupled plasma atomic emission spectrometry (ICP-AES) and one for the preparation of sediments, sludges, and soil samples for analysis of samples by Graphite Furnace AA (GFAA) or inductively coupled plasma mass spectrometry (ICP-MS). The extracts from these two procedures are not interchangeable and should only be used with the analytical determinations outlined in this section. Samples prepared by this method may be analyzed by ICP-AES or GFAA for all the listed metals as long as the detecion limits are adequate for the required end-use of the data. Alternative determinative techniques may be used if they are scientifically valid and the QC criteria of the method, including those dealing with interferences, can be achieved.Other elements and matrices may be analyzed by this method if performance is demonstrated for the analytes of interest, in the matrices of interest, at the concentration levels of interest (See Section 8.0). The recommended determinative techniques for each element are listed below:FLAA/ICP-AES GFAA/ICP-MS Aluminum Magnesium Arsenic Antimony Manganese Beryllium Barium Molybdenum Cadmium Beryllium Nickel Chromium Cadmium Potassium Cobalt Calcium Silver Iron Chromium Sodium LeadCobalt Thallium Molybdenum Copper Vanadium Selenium Iron ZincThalliumLeadVanadium1.2This method is not a total digestion technique for most samples. It is a very strongacid digestion that will dissolve almost all elements that could become “environmentally available.”By design, elements bound in silicate structures are not normally dissolved by this procedure as they are not usually mobile in the environment. If absolute total digestion is required use Method 3052.2.0 SUMMARY OF METHOD2.1For the digestion of samples, a representative 1-2 gram (wet weight) or 1 gram (dryweight) sample is digested with repeated additions of nitric acid (HNO ) and hydrogen peroxide 3(H O ).22 2.2For GFAA or ICP-MS analysis, the resultant digestate is reduced in volume whileheating and then diluted to a final volume of 100 mL.2.3For ICP-AES or FLAA analyses, hydrochloric acid (HCl) is added to the initialdigestate and the sample is refluxed. In an optional step to increase the solubility of some metals (see Section 7.3.1: NOTE), this digestate is filtered and the filter paper and residues are rinsed, firstwith hot HCl and then hot reagent water. Filter paper and residue are returned to the digestion flask, refluxed with additional HCl and then filtered again. The digestate is then diluted to a final volume of 100 mL.2.4If required, a separate sample aliquot shall be dried for a total percent solids determination.3.0 INTERFERENCES3.1 Sludge samples can contain diverse matrix types, each of which may present its own analytical challenge. Spiked samples and any relevant standard reference material should be processed in accordance with the quality control requirements given in Sec. 8.0 to aid in determining whether Method 3050B is applicable to a given waste.4.0 APPARATUS AND MATERIALS4.1 Digestion Vessels - 250-mL.4.2 Vapor recovery device (e.g., ribbed watch glasses, appropriate refluxing device, appropriate solvent handling system).4.3 Drying ovens - able to maintain 30E C + 4E C.4.4 Temperature measurement device capable of measuring to at least 125E C with suitable precision and accuracy (e.g., thermometer, IR sensor, thermocouple, thermister, etc.)4.5 Filter paper - Whatman No. 41 or equivalent.4.6 Centrifuge and centrifuge tubes.4.7Analytical balance - capable of accurate weighings to 0.01 g.4.8Heating source - Adjustable and able to maintain a temperature of 90-95E C. (e.g., hot plate, block digestor, microwave, etc.)4.9Funnel or equivalent.4.10Graduated cylinder or equivalent volume measuring device.4.11Volumetric Flasks - 100-mL.5.0 REAGENTS5.1 Reagent grade chemicals shall be used in all tests. Unless otherwise indicated, it is intended that all reagents shall conform to the specifications of the Committee on Analytical Reagents of the American Chemical Society, where such specifications are available. Other grades may be used, provided it is first ascertained that the reagent is of sufficiently high purity to permit its use without lessening the accuracy of the determination. If the purity of a reagent is questionable, analyze the reagent to determine the level of impurities. The reagent blank must be less than the MDL in order to be used.CD-ROM3050B - 2Revision 2December 1996CD-ROM 3050B - 3Revision 2December 19965.2Reagent Water. Reagent water will be interference free. All references to water inthe method refer to reagent water unless otherwise specified. Refer to Chapter One for a definition of reagent water.5.3 Nitric acid (concentrated), HNO . Acid should be analyzed to determine level of3impurities. If method blank is < MDL, the acid can be used.5.4 Hydrochloric acid (concentrated), HCl. Acid should be analyzed to determine levelof impurities. If method blank is < MDL, the acid can be used.5.5 Hydrogen peroxide (30%), H O . Oxidant should be analyzed to determine level of22impurities. If method blank is < MDL, the peroxide can be used.6.0 SAMPLE COLLECTION, PRESERVATION, AND HANDLING6.1 All samples must have been collected using a sampling plan that addresses theconsiderations discussed in Chapter Nine of this manual.6.2 All sample containers must be demonstrated to be free of contamination at or belowthe reporting limit. Plastic and glass containers are both suitable. See Chapter Three, Section 3.1.3,for further information.6.3Nonaqueous samples should be refrigerated upon receipt and analyzed as soon aspossible.6.4It can be difficult to obtain a representative sample with wet or damp materials. Wetsamples may be dried, crushed, and ground to reduce subsample variability as long as drying does not affect the extraction of the analytes of interest in the sample. 7.0 PROCEDURE7.1 Mix the sample thoroughly to achieve homogeneity and sieve, if appropriate andnecessary, using a USS #10 sieve. All equipment used for homogenization should be cleaned according to the guidance in Sec. 6.0 to minimize the potential of cross-contamination. For each digestion procedure, weigh to the nearest 0.01 g and transfer a 1-2 g sample (wet weight) or 1 g sample (dry weight) to a digestion vessel. For samples with high liquid content, a larger sample size may be used as long as digestion is completed.NOTE: All steps requiring the use of acids should be conducted under a fume hood by properly trained personnel using appropriate laboratory safety equipment. The use of an acid vapor scrubber system for waste minimization is encouraged.7.2 For the digestion of samples for analysis by GFAA or ICP-MS, add 10 mL of 1:1HNO , mix the slurry, and cover with a watch glass or vapor recovery device. Heat the sample to 395E C ± 5E C and reflux for 10 to 15 minutes without boiling. Allow the sample to cool, add 5 mL of concentrated HNO , replace the cover, and reflux for 30 minutes. If brown fumes are generated,3indicating oxidation of the sample by HNO , repeat this step (addition of 5 mL of conc. HNO ) over 3 3and over until no brown fumes are given off by the sample indicating the complete reaction with HNO . Using a ribbed watch glass or vapor recovery system, either allow the solution to evaporate 3to approximately 5 mL without boiling or heat at 95E C ± 5E C without boiling for two hours. Maintain a covering of solution over the bottom of the vessel at all times.CD-ROM3050B - 4Revision 2December 1996samples for analysis by GFAA or ICP-MS by adding 10 mL of 1:1 HNO , mixing the slurry and 3then covering with a vapor recovery device. Heat the sample to 95E C ± 5E C and reflux for 5 minutes at 95E C ± 5E C without boiling. Allow the sample to cool for 5 minutes, add 5 mL of concentrated HNO , heat the sample to 95E C ± 5E C and reflux for 5 minutes at 95E C ±35E C. If brown fumes are generated, indicating oxidation of the sample by HNO , repeat this 3step (addition of 5 mL concentrated HNO ) until no brown fumes are given off by the sample 3indicating the complete reaction with HNO . Using a vapor recovery system, heat the sample 3to 95E C ± 5E C and reflux for 10 minutes at 95E C ± 5E C without boiling.7.2.1 After the step in Section 7.2 has been completed and the sample has cooled,add 2 mL of water and 3 mL of 30% H O . Cover the vessel with a watch glass or vapor 22recovery device and return the covered vessel to the heat source for warming and to start the peroxide reaction. Care must be taken to ensure that losses do not occur due to excessively vigorous effervescence. Heat until effervescence subsides and cool the vessel.NOTE: Alternatively, for direct energy coupled devices: After the Sec. 7.2 “NOTE”step has been completed and the sample has cooled for 5 minutes, add slowly 10 mL of 30% H O . Care must be taken to ensure that losses do not occur due to 22excessive vigorous effervesence. Go to Section 7.2.3.7.2.2 Continue to add 30% H O in 1-mL aliquots with warming until the22effervescence is minimal or until the general sample appearance is unchanged.NOTE: Do not add more than a total of 10 mL 30% H O .227.2.3 Cover the sample with a ribbed watch glass or vapor recovery device andcontinue heating the acid-peroxide digestate until the volume has been reduced to approximately 5 mL or heat at 95E C ± 5E C without boiling for two hours. Maintain a covering of solution over the bottom of the vessel at all times.NOTE: Alternatively, for direct energy coupled devices: Heat the acid-peroxide digestate to 95E C ± 5E C in 6 minutes and remain at 95E C ± 5E C without boiling for 10 minutes.7.2.4After cooling, dilute to 100 mL with water. Particulates in the digestate shouldthen be removed by filtration, by centrifugation, or by allowing the sample to settle. The sample is now ready for analysis by GFAA or ICP-MS.7.2.4.1Filtration - Filter through Whatman No. 41 filter paper (orequivalent).7.2.4.2 Centrifugation - Centrifugation at 2,000-3,000 rpm for10 minutes is usually sufficient to clear the supernatant.7.2.4.3 The diluted digestate solution contains approximately 5% (v/v)HNO . For analysis, withdraw aliquots of appropriate volume and add any required 3reagent or matrix modifier.7.3For the analysis of samples for FLAA or ICP-AES, add 10 mL conc. HCl to the sampledigest from 7.2.3 and cover with a watch glass or vapor recovery device. Place the sample on/in the heating source and reflux at 95C ± 5E C for 15 minutes.oCD-ROM3050B - 5Revision 2December 1996samples for analysis by FLAA and ICP-AES by adding 5 mL HCl and 10 mL H O to the2sample digest from 7.2.3 and heat the sample to 95C ± 5E C, Reflux at 95C ± 5E C without o o boiling for 5 minutes.7.4Filter the digestate through Whatman No. 41 filter paper (or equivalent) and collectfiltrate in a 100-mL volumetric flask. Make to volume and analyze by FLAA or ICP-AES.NOTE: Section 7.5 may be used to improve the solubilities and recoveries of antimony,barium, lead, and silver when necessary. These steps are optional and are not required on a routine basis.7.5Add 2.5 mL conc. HNO and 10 mL conc. HCl to a 1-2 g sample (wet weight) or 1 g3sample (dry weight) and cover with a watchglass or vapor recovery device. Place the sample on/in the heating source and reflux for 15 minutes.7.5.1Filter the digestate through Whatman No. 41 filter paper (or equivalent) andcollect filtrate in a 100-mL volumetric flask. Wash the filter paper, while still in the funnel,with no more than 5 mL of hot (~95E C) HCl, then with 20 mL of hot (~95E C) reagent water.Collect washings in the same 100-mL volumetric flask.7.5.2Remove the filter and residue from the funnel, and place them back in thevessel. Add 5 mL of conc. HCl, place the vessel back on the heating source, and heat at 95E C ± 5E C until the filter paper dissolves. Remove the vessel from the heating source and wash the cover and sides with reagent water. Filter the residue and collect the filtrate in the same 100-mL volumetric flask. Allow filtrate to cool, then dilute to volume.NOTE: High concentrations of metal salts with temperature-sensitive solubilities can result in the formation of precipitates upon cooling of primary and/or secondary filtrates. If precipitation occurs in the flask upon cooling, do not dilute to volume.7.5.3If a precipitate forms on the bottom of a flask, add up to 10 mL ofconcentrated HCl to dissolve the precipitate. After precipitate is dissolved, dilute to volume with reagent water. Analyze by FLAA or ICP-AES.7.6Calculations7.6.1 The concentrations determined are to be reported on the basis of the actualweight of the sample. If a dry weight analysis is desired, then the percent solids of the sample must also be provided.7.6.2 If percent solids is desired, a separate determination of percent solids mustbe performed on a homogeneous aliquot of the sample.8.0 QUALITY CONTROL8.1All quality control measures described in Chapter One should be followed.8.2 For each batch of samples processed, a method blank should be carried throughoutthe entire sample preparation and analytical process according to the frequency described in Chapter One. These blanks will be useful in determining if samples are being contaminated. Refer to Chapter One for the proper protocol when analyzing method blanks.8.3 Spiked duplicate samples should be processed on a routine basis and whenever a new sample matrix is being analyzed. Spiked duplicate samples will be used to determine precision and bias. The criteria of the determinative method will dictate frequency, but 5% (one per batch) is recommended or whenever a new sample matrix is being analyzed. Refer to Chapter One for the proper protocol when analyzing spiked replicates.8.4Limitations for the FLAA and ICP-AES optional digestion procedure. Analysts should be aware that the upper linear range for silver, barium, lead, and antimony may be exceeded with some samples. If there is a reasonable possibility that this range may be exceeded, or if a sample’s analytical result exceeds this upper limit, a smaller sample size should be taken through the entire procedure and re-analyzed to determine if the linear range has been exceeded. The approximate linear upper ranges for a 2 gram sample size:Ag 2,000 mg/kgAs1,000,000 mg/kgBa 2,500 mg/kgBe 1,000,000 mg/kgCd 1,000,000 mg/kgCo 1,000,000 mg/kgCr 1,000,000 mg/kgCu 1,000,000 mg/kgMo1,000,000 mg/kgNi 1,000,000 mg/kgPb 200,000 mg/kgSb 200,000 mg/kgSe 1,000,000 mg/kgTl 1,000,000 mg/kgV 1,000,000 mg/kgZn 1,000,000 mg/kgNOTE: These ranges will vary with sample matrix, molecular form, and size.9.0METHOD PERFORMANCE9.1In a single laboratory, the recoveries of the three matrices presented in Table 2 were obtained using the digestion procedure outlined for samples prior to analysis by FLAA and ICP-AES. The spiked samples were analyzed in duplicate. Tables 3-5 represents results of analysis of NIST Standard Reference Materials that were obtained using both atmospheric pressure microwave digestion techniques and hot-plate digestion procedures.10.0REFERENCES1.Rohrbough, W.G.; et al. Reagent Chemicals, American Chemical Society Specifications, 7th ed.; American Chemical Society: Washington, DC, 1986.2.1985 Annual Book of ASTM Standards, Vol. 11.01; "Standard Specification for Reagent Water"; ASTM: Philadelphia, PA, 1985; D1193-77.3.Edgell, K.; USEPA Method Study 37 - SW-846 Method 3050 Acid Digestion of Sediments, Sludges, and Soils. EPA Contract No. 68-03-3254, November 1988.CD-ROM3050B - 6Revision 2December 19964.Kimbrough, David E., and Wakakuwa, Janice R. Acid Digestion for Sediments, Sludges, Soils, and Solid Wastes. A Proposed Alternative to EPA SW 846 Method 3050, Environmental Science and Technology, Vol. 23, Page 898, July 1989.5.Kimbrough, David E., and Wakakuwa, Janice R. Report of an Interlaboratory Study Comparing EPA SW 846 Method 3050 and an Alternative Method from the California Department of Health Services, Fifth Annual Waste Testing and Quality Assurance Symposium, Volume I, July 1989. Reprinted in Solid Waste Testing and Quality Assurance: Third Volume, ASTM STP 1075, Page 231, C.E. Tatsch, Ed., American Society for Testing and Materials, Philadelphia, 1991.6.Kimbrough, David E., and Wakakuwa, Janice R. A Study of the Linear Ranges of Several Acid Digestion Procedures, Environmental Science and Technology, Vol. 26, Page 173, January 1992. Presented Sixth Annual Waste Testing and Quality Assurance Symposium, July 1990.7.Kimbrough, David E., and Wakakuwa, Janice R. A Study of the Linear Ranges of Several Acid Digestion Procedures, Sixth Annual Waste Testing and Quality Assurance Symposium, Reprinted in Solid Waste Testing and Quality Assurance: Fourth Volume, ASTM STP 1076, Ed., American Society for Testing and Materials, Philadelphia, 1992.8.NIST published leachable concentrations. Found in addendum to certificate of analysis for SRMs 2709, 2710, 2711 - August 23, 1993.9.Kingston, H.M. Haswell, S.J. ed., Microwave Enhanced Chemistry, Professional Reference Book Series, American Chemical Society, Washington, D.C., Chapter 3, 1997.CD-ROM3050B - 7Revision 2December 1996CD-ROM 3050B - 8Revision 2December 1996TABLE 1STANDARD RECOVERY (%) COMPARISON FORMETHODS 3050A AND 3050B aAnalyte METHOD 3050A METHOD 3050B w/optionaaAg 9.598 As 86 102 Ba 97 103 Be 96 102 Cd 10199 Co 99105 Cr 9894 Cu 8794 Mo 9796 Ni 9892 Pb 9795 Sb 8788 Se 9491 Tl 9696 V 93103 Zn9995All values are percent recovery. Samples: 4 mL of 100 mg/mL multistandard; n = 3.aTABLE 2PERCENT RECOVERY COMPARISON FOR METHODS 3050A AND 3050BPercent Recovery a,cAnalyte Sample 4435Sample 4766Sample HJ Average 3050A3050B3050A3050B3050A3050B3050A3050B Ag9.8103158956932795 As7010280958310277100 Ba85947895b b8194 Be941021089899949997 Cd9288919595979394 Co9094879589938994 Cr90958994721018397 Cu81888587701067794 Mo79928398871038398 Ni889393100871019298 Pb8292809177918191 Sb2884237746763279 Se8489819699968594 Tl8887699566677483 V8497869690888793 Zn961067875b b8799a - Samples: 4 mL of 100 mg/mL multi-standard in 2 g of sample. Each value is percent recovery and is the average of duplicate spikes.b - Unable to accurately quantitate due to high background values.c - Method 3050B using optional section.CD-ROM3050B - 9Revision 2December 1996CD-ROM 3050B - 12Revision 2December 1996METHOD 3050BACID DIGESTION OF SEDIMENTS, SLUDGES, AND SOILS。

Independence is a concept that holds great significance in both individual and collective contexts. It represents the freedom to make decisions and take actions without influence or interference from external sources. The concept of independence is deeply ingrained in human society and has played a crucial role in shaping history, culture, and personal development. Whether it is a nation fighting for sovereignty or an individual seeking autonomy, independence is a fundamental value that carries immense significance.In the realm of nations and states, independence is a cornerstone of political identity and governance. The struggle for independence has been a driving force behind numerous revolutions, wars, and movements throughout history. Independence represents the right of a nation to govern itself, free from the rule of a foreign power. This concept has been a catalyst for social and political change, leading to the formation of new nations and the overthrow of oppressive regimes. The significance of independence in this context lies in the pursuit of self-determination and the establishment of a government that reflects the will of its people.On an individual level, independence holds a different but equally important significance. Personal independence is the ability to think, act, and make choices without undue influence or control from others. It is a fundamental aspect of personal autonomy and self-reliance. Cultivating independence allows individuals to develop their own identities, pursue their goals, and navigate life on their own terms. The significance of independence forindividuals lies in the empowerment and freedom it provides, enabling them to assert their own agency and live according to their values and beliefs.Independence also plays a crucial role in shaping relationships and interactions between individuals and groups. For example, in partnerships and collaborations, the ability to maintain independence while working together is essential for fostering mutual respect and trust. Balancing independence and interdependence in relationships allows people to support each other while also maintaining their own autonomy and agency. In a broader societal context, the recognition and protection of individual and collective independence are essential for promoting diversity, tolerance, and equality.Furthermore, independence is closely tied to economic prosperity and development. The ability for individuals and communities to pursue economic opportunities and manage their resources independently is fundamental for sustainable growth and resilience. Economic independence allows people to create wealth, provide for themselves and their families, and contribute to the prosperity of their communities. The significance of economic independence lies in its capacity to foster innovation, entrepreneurship, and self-sufficiency, ultimately driving progress and prosperity on both local and global scales.In conclusion, independence is a concept of great significance that extends beyond political sovereignty to encompass personal autonomy, relationships, and societal development. The pursuit and preservation of independence are essential for promoting freedom, self-determination, and prosperity. Whether itis a nation seeking liberation, an individual striving for self-reliance, or a community pursuing economic empowerment, the significance of independence lies in its ability to engender progress, resilience, and the fulfillment of human potential. It is a foundational value that underpins the fabric of society and continues to shape the course of human history.。
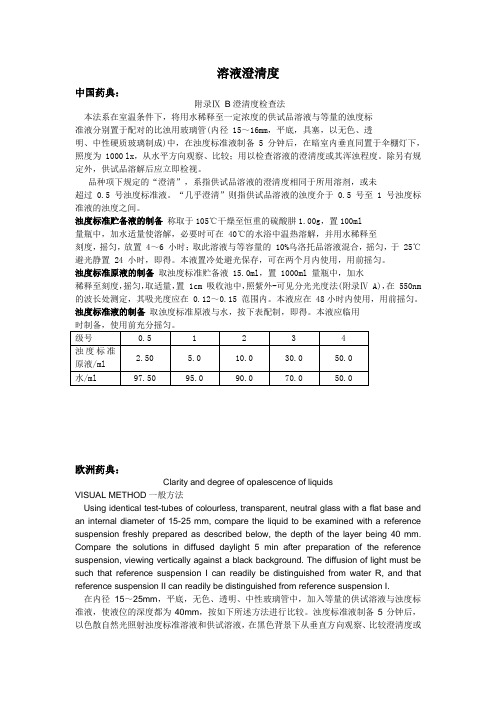
溶液澄清度中国药典:附录ⅨB澄清度检查法本法系在室温条件下,将用水稀释至一定浓度的供试品溶液与等量的浊度标准液分别置于配对的比浊用玻璃管(内径 15~16mm,平底,具塞,以无色、透明、中性硬质玻璃制成)中,在浊度标准液制备 5 分钟后,在暗室内垂直同置于伞棚灯下,照度为 1000 lx,从水平方向观察、比较;用以检查溶液的澄清度或其浑浊程度。
除另有规定外,供试品溶解后应立即检视。
品种项下规定的“澄清”,系指供试品溶液的澄清度相同于所用溶剂,或未超过 0.5 号浊度标准液。
“几乎澄清”则指供试品溶液的浊度介于 0.5 号至 1 号浊度标准液的浊度之间。
浊度标准贮备液的制备称取于105℃干燥至恒重的硫酸肼1.00g,置100ml量瓶中,加水适量使溶解,必要时可在 40℃的水浴中温热溶解,并用水稀释至刻度,摇匀,放置 4~6 小时;取此溶液与等容量的 10%乌洛托品溶液混合,摇匀,于 25℃避光静置 24 小时,即得。
本液置冷处避光保存,可在两个月内使用,用前摇匀。
浊度标准原液的制备取浊度标准贮备液 15.0ml,置 1000ml 量瓶中,加水稀释至刻度,摇匀,取适量,置 1cm 吸收池中,照紫外-可见分光光度法(附录Ⅳ A),在 550nm 的波长处测定,其吸光度应在 0.12~0.15 范围内。
本液应在 48小时内使用,用前摇匀。
浊度标准液的制备取浊度标准原液与水,按下表配制,即得。
本液应临用时制备,使用前充分摇匀。
欧洲药典:Clarity and degree of opalescence of liquidsVISUAL METHOD一般方法Using identical test-tubes of colourless, transparent, neutral glass with a flat base and an internal diameter of 15-25 mm, compare the liquid to be examined with a reference suspension freshly prepared as described below, the depth of the layer being 40 mm. Compare the solutions in diffused daylight 5 min after preparation of the reference suspension, viewing vertically against a black background. The diffusion of light must be such that reference suspension I can readily be distinguished from water R, and that reference suspension II can readily be distinguished from reference suspension I.在内径15~25mm,平底,无色、透明、中性玻璃管中,加入等量的供试溶液与浊度标准液,使液位的深度都为40mm,按如下所述方法进行比较。

Product SpecificationsThermo Scientific Dionex IonPac AS14Anion-Exchange ColumnThe Thermo Scientific ™ Dionex ™ IonPac ™ AS14 anion-exchange column is designed for the fast analysis of inorganic anions, including fluoride, acetate, chloride, nitrite, bromide, nitrate,phosphate, and sulfate. The Dionex IonPac AS14 column is suited for applications performed using the Dionex IonPac AS4A-SC and Dionex IonPac AS12A columns with the advantages of improved peak resolution and retention of fluoride. Solvent compatibility permits easy column clean-up after the analysis of complex matrices. The Dionex IonPac AS14A column can also be used for the fast, isocratic separation of the common inorganic anions. Refer to the Dionex IonPac AS14A column Product Specifications for more information.C H R O M A T O G R A P H YDetermination of Inorganic Anions in Diverse Sample Matrices• Source water and drinking water • Municipal and industrial wastewater • Industrial cooling water • Power plant waters• Hazardous waste extracts and dump site leachates • Acid rain• I norganic anions in foods and beverages • Anionic counterions in pharmaceutical preparations and synthetic peptides • Polymers such as polyols and polysulfonates • Kraft liquorsSuperior Chromatographic Performance• Universal column for inorganic anions. Designed to be used in Dionex IonPac AS4A, Dionex IonPac AS4A-SC, and Dionex IonPac AS12A column applications with equivalent linearity and precision.• Fast isocratic separation of fluoride, chloride, nitrite, bromide, nitrate, phosphate, and sulfate using a simple carbonate/bicarbo- nate eluent. Retains fluoride out of the water dip, free of interference from organic acids, with elution of sulfate in 13 min.• M eets or exceeds requirements of U.S. EPA Method 300.0 (A).• Superior retention and quantification of fluoride, glycolate, acetate, and formate.• Sodium tetraborate gradient optimizes difficult separations.• Solvent compatible. Solvent samples for determining contaminating anions. Use organic solvents to enhance analytesolubility, modify column selectivity, or for effective column clean-up.• Available in 4 mm or 2 mm formats. Use the 2 mm microbore column for economical operation.MinutesIsocratic Separation of Inorganic Anions onan Dionex IonPac AS14 Column in Less than 13 Minutes2High Efficiency Particle StructureThe Dionex IonPac AS14 column packing is a unique structure composed of a highlycrosslinked core and an anion-exchange layer grafted to the surface, as shown in Figure 1. The substrate for the Dionex IonPac AS14 column is a 9 μm diameter macroporous resin bead consisting of ethylvinylbenzene crosslinked with 55% divinylbenzene. The anion-exchange layer is functionalized with quaternary ammonium groups. The anion- exchange layer has a controlled thickness resulting in excellent mass transfercharacteristics and consequently very high efficiency peaks.Unique Selectivity and Increased CapacityThe Dionex IonPac AS14 column has a unique selectivity and increased capacity compared to the Dionex IonPac AS4A column. As shown in Figure 2, fluoride is well resolved from the system void and free from interference from acetate and formate. These features make the Dionex IonPac AS14 column ideal for routine inorganic anion determinations. The increased capacity of the Dionex IonPac AS14 column allows the injection of complex matrices or injection of up to 100 μL of sample, as shown in Figure 3.Figure 1. Structure of an Dionex IonPac AS14 column packing particle.Figure 2. Isocratic separation of inorganic anions on an Dionex IonPac AS14 column in less than 13 minutes.Figure 3. Determination of trace level anions in high-purity water using the Dionex IonPac AS14 column with a large loop injection.Column: Dionex IonPac AG14,Dionex IonPac AS14, 4 mm Eluent: 3.5 mM Sodium carbonate1.0 mM Sodium bicarbonate Flow Rate: 1.2 mL/min Inj. Volume: 10 µLDetection: Suppressed conductivity, Thermo Scientific ™ Dionex ™ ASRS ™-ULTRA AnionSelf-Regenerating suppressor, 4 mm, AutoSuppress ion ™, recycle mode Peaks: 1. Fluoride 5 mg/L (ppm) 2. Acetate 20 3. Chloride 10 4. Nitrite 15 5. Bromide 25 6. Nitrate 25 7. Phosphate 408. Sulfate3010µS0MinutesColumn: Dionex IonPac AG14,Dionex IonPac AS14, 4 mm Eluent: 3.5 mM Sodium carbonate1.0 mM Sodium bicarbonate Flow Rate: 1.2 mL/min Inj. Volume: 100 µLDetection: Suppressed conductivity,Dionex ASRS-ULTRA suppressor, 4 mm, Auto Suppression, external water mode Peaks: 1. Fluoride 50 µg/L (ppb) 2. Chloride 70 3. Nitrite 120 4. Bromide 250 5. Nitrate 250 6. Phosphate 8007. Sulfate25000.5µS246Minutes810123467512143Column: A: Dionex IonPac AG4A-SC,Dionex IonPac AS4A-SC, 4 mm B: Dionex IonPac AG14, Dionex IonPac AS14, 4 mm Eluent: A: 1.8 mM Sodium carbonate 1.7 mM Sodium bicarbonate B: 4.8 mM Sodium carbonate 0.6 mM Sodium bicarbonate Flow Rate: A: 2 mL/min B: 1.5 mL/min Inj. Volume: 10 µL Detection: Suppressed conductivity, Dionex ASRS-ULTRA suppressor, 4 mm, AutoSuppression, recycle mode Peaks: 1. Fluoride 5 mg/L (ppm) 2. Chloride 10 3. Nitrite 15 4. Bromide 25 5. Nitrate 25 6. Phosphate 407. Sulfate3010µS 014µS111222333Minutes444555666777A Dionex IonPac AS4A-SC columnB Dionex IonPac AS14 column89Column: Dionex IonPac AG14, Dionex IonPac AS14, 4 mm Eluent: 3.5 mM Sodium carbonate 1.0 mM Sodium bicarbonate Flow Rate: 1.2 mL/min Inj. Volume: 10 µL Detection: Suppressed conductivity, Dionex ASRS-ULTRA, suppressor, 4 mm, AutoSuppression, recycle mode Sample: Drinking water from Milpitas, CA Peaks: 1. Fluoride0.03 mg/L (ppm) 2. Bicarbonate 30 3. Chloride 3.1 4. Nitrate 0.15 5. Phosphate 0.046. Sulfate 4.413420.5µS0246Minutes810121456Ideal for the Determination ofInorganic Anions in Drinking Water and WastewaterThe Dionex IonPac AS14 column is the ideal column for compliance monitoring of drinking water and waste water. The Dionex IonPac AS14 column meets or exceeds therequirements of U.S. EPA Method 300.0 (A). As shown in Figure 4, fluoride is easily separated from the system void and can be determined even at very low concentrations. The Dionex IonPac AS14 column has significantly improved retention of fluoride compared to the Dionex IonPac AS4A column, as illustrated in Figure 5.Figure 4. The Dionex IonPac AS14 column is ideal for interference-free determinationof inorganic anions, including fluoride, in drinking water.Figure 5. Fast isocratic elution of inorganic anions. The increased capacity and unique selectivity of the Dionex IonPac AS14 column allows the retention of fluoride out of the water dip while eluting sulfate in less than 9 minutes.4Column: Dionex IonPac AG14,Dionex IonPac AS14, 4 mm Eluent: 3.5 mM Sodium carbonate0.8 mM Sodium bicarbonate Flow Rate: 1.2 mL/min Inj. Volume: 10 µLDetection: Suppressed conductivity,Dionex ASRS-ULTRA suppressor, 4 mm, AutoSuppression, recycle modePeaks: 1. Chloride0.3 mg/L (ppm) 2. Sulfate 0.93. Trifluoroacetic acid 6.505123101520Minutes0.4µSColumn: Dionex IonPac AG14,Dionex IonPac AS14, 4 mmEluent: 2 mM Sodium tetraborate for 6 min; 10 min gradient to17.5 mM Sodium tetraborate Flow Rate: 1.5 mL/min Inj. Volume: 25 µLDetection: Suppressed conductivity,Dionex ASRS-ULTRA suppressor, 4 mm, AutoSuppression, external water mode Peaks: 1. Fluoride 5 mg/L (ppm) 2. Glycolate 10 3. Acetate 20 4. Formate 10 5. Chloride 3 6. Nitrite 10 7. Bromide 10 8. Nitrate 10 9. Phosphate 1510. Sulfate1512µS022345678910146Minutes81012141618Determination of InorganicAcids and Low Molecular Weight Organic AcidsLow molecular weight organic acids and mono- and divalent inorganic anionscommonly encountered in the chemical and power industries can be determined in a single run. Figure 6 illustrates the separation of weakly retained anions such as fluoride, glycolate, acetate, and formate on the Dionex IonPac AS14 column by using a sodium tetraborate gradient.The Dionex IonPac AS14 column can be used to evaluate the mass balance of drugs and synthetic peptide preparations. Figure 7 illustrates the use of the Dionex IonPac AS14 column to determine the anionic counterion amount and type.Solvent Compatible PackingSince the Dionex IonPac AS14 column is 100% HPLC solvent compatible, organic solvents can be used for efficient column clean-up or to enhance sample solubility. Users save time and money by eliminating time consuming sample preparation steps. This feature allows complex matrices to be analyzed with minimal sample preparation and extends the utility of the column to new applications requiring solvents. Adding organic solvents to the eluent modifies columnselectivity and enables the elution of nonpolar analytes or contaminants from the column.Economical Microbore OperationThe Dionex IonPac AS14 column is available in the 2 mm format to provide the advantages of reduced operating costs with microbore operation.• Higher mass sensitivity compared to 4 mm separations. Ideal for limited sample volumes.• Reduced mobile phase consumption (3–4 times).• 4 mm applications can be directly transferred to the 2 mm format.Figure 6. Sodium tetraborate gradient separation of anions using the Dionex IonPac AS14 column.Figure 7. Determination of anionic counterions present in a gel permeation purified peptide.SPECIFICATIONSDimensions Analytical 2 × 250 mm and 4 × 250 mm Guard2 × 50 mm and 4 × 50 mm Maximum Operating Pressure 27.6 MPa (4000 psi)Mobile Phase Compatibility pH 2–12; 0–100% HPLC solventsSubstrate Characteristics Bead Diameter (µm) 9Pore Size Å 100Cross-Linking (%DVB)55Ion-Exchange Functional Group Surface-functionalized alkyl quaternary ammonium ion Functional Group Characteristics Medium-high hydrophobicCapacity 16 µeq (2 × 250 mm column)65 µeq(4 × 250 mm column)Column Construction PEEK with 10–32 threaded ferrule-style end fittings.All components are nonmetallic.Ordering InformationFor more information or to place an order, contact the Thermo Scientific Dionex Products office nearest you or your local distributor. Phone numbers and addresses for worldwide subsidiaries can be found in the About Us section of .For optimum ease-of-use and economy, the Dionex IonPac AS14 column should be used with the Thermo Scientific ™ Dionex ™ AERS 500 suppressor. The Dionex IonPac AS14 column offers improved performance for Dionex IonPac AS4A, Dionex IonPac AS4A-SC, and Dionex IonPac AS12A column applications.When performing sodium tetraborate gradient anion-exchange applications on the Dionex IonPac AS14 column, a Dionex IonPac ATC column should be installed between the gradient pump and the injection valve to remove anionic contaminants from the eluent.For concentrator work, use the Dionex IonPac AG14 guard column; Ultratrace Anion Concentrator Columns (Dionex IonPac UTAC-ULP1, UTAC-XLP1, UTAC-ULP2, or UTAC-XLP2 columns) or Trace Anion Concentrator Column (Dionex IonPac TAC-ULP1 column) when a single piston pump such as the Thermo Scientific Dionex AXP Auxiliary Pump (pulse damper required) is used for sample delivery. In addition to the concentrator columns listed above, use the Dionex IonPac UTAC-LP1, Dionex IonPac UTAC-LP2, or Dionex IonPac TAC-LP1 column when the sample is delivered using a syringe or alow-pressure autosampler, such as the Thermo Scientific Dionex AS-DV Autosampler.PS71397-EN 1014MAfrica +43 1 333 50 34 0Australia +61 3 9757 4300Austria +43 810 282 206Belgium +32 53 73 42 41Brazil +55 11 3731 5140Canada +1 800 530 8447China 800 810 5118 (free call domestic)400 650 5118Denmark +45 70 23 62 60Europe-Other +43 1 333 50 34 0Finland +358 9 3291 0200France +33 1 60 92 48 00Germany +49 6103 408 1014India +91 22 6742 9494Italy +39 02 950 591 Japan +81 6 6885 1213Korea +82 2 3420 8600Latin America +1 561 688 8700Middle East +43 1 333 50 34 0Netherlands +31 76 579 55 55 New Zealand +64 9 980 6700 Norway +46 8 556 468 00Russia/CIS +43 1 333 50 34 0Singapore +65 6289 1190Sweden +46 8 556 468 00 Switzerland +41 61 716 77 00Taiwan +886 2 8751 6655UK/Ireland +44 1442 233555USA +1 800 532 4752/chromatography©2014 Thermo Fisher Scientific Inc. All rights reserved. ISO is a trademark of the International Standards Organization.All other trademarks are the property of Thermo Fisher Scientific and its subsidiaries. Specifications, terms and pricing are subject to change. Not all products are available in all countries. Please consult your local sales representative for details.Thermo Fisher Scientific, Sunnyvale, CA USA is ISO 9001:2008 Certified.Dionex IonPac AS14 ColumnsPart NumberDionex IonPac AS14 Analytical Column (4 × 250 mm) 046124Dionex IonPac AG14 Guard Column (4 × 50 mm) 046134Dionex IonPac AS14 Analytical Column (2 × 250 mm) 046129Dionex IonPac AG14 Guard Column (2 × 50 mm) 046138Trace Anion Concentrator ColumnsPart NumberDionex IonPac TAC-2 Trace Anion Concentrator (3 × 35 mm) 043101Dionex IonPac TAC-LP1 Trace Anion Concentrator (4 × 35 mm)046026Dionex IonSwift MAC-100 Monolith Anion Concentrator (0.5 × 80 mm) (for use with Capillary IC) 074702Dionex IonPac TAC-LP1 Trace Anion Concentrator (4 × 35 mm) 046026Dionex IonPac TAC-ULP1 Trace Anion Concentrator (5 × 23 mm)061400Dionex IonPac UTAC-LP1 Ultra Trace Anion Concentrator Low-Pressure (4 × 35 mm) 063079Dionex IonPac UTAC-ULP1 Ultra Trace Anion Concentrator Ultra Low-Pressure (5 × 23 mm) 063475Dionex IonPac UTAC-XLP1 Ultra Trace Anion Concentrator Extremely Low-Pressure (6 × 16 mm) 063459Dionex IonPac UTAC-LP2 Ultra Trace Anion Concentrator Low-Pressure (4 × 35 mm) 079917Dionex IonPac UTAC-ULP2 Ultra Trace Anion Concentrator Ultra Low-Pressure (5 × 23 mm) 079918Dionex IonPac UTAC-XLP2 Ultra Trace Anion Concentrator Extremely Low-Pressure (6 × 16 mm) 072781Anion Trap ColumnsPart NumberDionex IonPac ATC-3 Anion Trap Column (9 × 24 mm) (for use with 4 mm columns) 059660Dionex IonPac ATC-3 Anion Trap Column (4 × 35 mm) (for use with 2 mm columns)079932Product Specifications。
iatrochemistry 医疗化学ice calorimeter 冰量热器ice color 冰染料ice point 冰点iceland spar 冰洲石ichthyol soap 鱼石脂皂ideal elasticity 完全弹性ideal fluid 理想铃ideal gas 完美气体ideal solution 完美溶液identification 证实iditol 艾杜醇idonic acid 艾杜糖酸idose 艾杜糖igneous rock 火成岩ignitability 可燃性igniter 点火器ignition 点火ignition delay 点火延迟ignition loss 灼烧损失ignition point 着火点ignition residue 灼烧残渣ignition temperature 着火点ignition test 灼热试验ilang ilang oil 衣兰油illuminating gas 照螟illuminating oil 灯油illumination 照明illuminometer 照度计ilmenite 钛铁矿image processing 图象处理imbibition 吸液imidazole 咪唑imide 亚胺imido acid 亚氨酸imino base 亚氨碱iminodiacetic acid 亚氨乙酸imipramine 丙咪嗪imitation leather 人造革immersion 浸润immersion electrode 浸液电极immersion method 液浸法immersion plating 浸镀immersion refractometer 浸没折射率计immiscible 不相混的immiscible solutions 不溶混溶液immobilized enzyme 固定化酶immunity 免疫性immunization 免疫法immunoglobulin 免疫球蛋白immunomodulator 免疫第剂immunoregulatory drug 免疫第剂impact 冲击impact elasticity 冲化性impact grinder 冲慧碎机impact resistance 冲还力impact screen 冲桓impact strength 冲豢度impact test 冲辉验impedance 全电阻impenetrability 不可渗透性imperfect combustion 不完全燃烧imperfect fungi 不完全菌imperfect gas 非理想气体imperial red 朱红色impermeability 不渗透性impervious carbon 不渗透性碳implicit function 隐函数implosion 内爆impregnant 浸渍剂impregnation 浸渍impregnation machine 浸渍机improved wood 改性木材impulsive force 冲沪impurity 杂质impurity conduction 杂质传导impurity level 杂质能级inactivation 钝化inactive filler 非活性填充剂incandescence 白炽incendiary agent 燃烧剂incineration 焚化inclination 倾斜inclined retort 斜式甑inclusion 夹杂物inclusion compound 包含化合物inclusion polymerization 笼形包合incommensurate structure 不相称结构incompatibility 不相容性incomplete combustion 不完全燃烧incomplete reaction 不完全反应incompressibility 不可压缩性incompressible fluid 不可压缩铃incongruent melting 异成分熔融incubation 孵化incubator 孵化箱indamine 吲达胺indanthrene 阴丹士林indanthrene dye 阴丹士林染料indazole 吲唑indene 茚independent component 独立组分independent migration law 独立迁移定律index of unsaturation 不饱和指数india paper 印度纸india rubber 橡胶indian red 印度红indican 尿蓝母indicating instrument 指示仪表indicator 指示剂indicator current 指示电流indicator error 指示剂误差indifferent electrolyte 协助电解物indigo 靛indigo blue 靛蓝indigo carmine 蓝胭脂红indigo vat 靛蓝瓮indigoid dye 靛类染料indigosol dye 印地科素染料indigotin 靛蓝indirect analysis 间接分析indirect arc furnace 间接电弧炉indirect determination 间接测定indirect fertilizer 间接肥料indirect oxidation 间接氧化indirect reduction 间接还原indirect substitution 间接取代indispensable amino acid 必需氨基酸indispensable fatty acid 必需脂肪酸indium 铟indium chloride 氯化铟indium hydroxide 氢氧化铟indium nitrate 硝酸铟indium oxide 氧化铟indium sulfate 硫酸铟indium sulfide 硫化铟indogen 靛元基indogenide 靛元化物indole 吲哚indoleacetic acid 吲哚乙酸indolebutyric acid 吲哚丁酸indoline 二氢吲哚indolylacetic acid 吲哚乙酸indophenine 靛吩咛indophenol 靛酚indoxyl 吲羟indoxylic acid 吲羟酸induced electromotive force 感应电动势induced precipitation 诱导沉淀induced reaction 辐射化学反应inducible enzyme 诱导酶inductance 感应系数induction 感应induction coil 感应线圈induction furnace 感应电炉induction heating 感应加热induction period 诱导期induction period of polymerization 聚合反应诱导期inductive effect 感应效应inductor 诱导物indulines 引杜林industrial alcohol 工业用酒精industrial analysis 工业分析industrial chemistry 工业化学industrial gasoline 工业汽油industrial solvent 工业溶剂industrial water 工业用水industrialization 工业化ineffectiveness 无效inelastic scattering 非弹性散射inelasticity 非弹性inert atmosphere 惰性气氛inert filler 惰性填料inert gas 惰性气体inertia 惯性inertial system 惯性系infiltration 渗透infinite dilution 无限稀释inflammability 易燃性inflammation 点火inflation 膨胀information processing 信息处理information retrieval 信息检索information theory 信息论infrared absorption spectrum 红外吸收光谱infrared dichroism 红外二向色性infrared lamp 红外线灯infrared photography 红外线摄影infrared radiation 红外线infrared rays 红外线infrared spectrophotometry 红外分光光度法infrared spectroscopic analysis 红外线分光分析infrared spectrum 红外光谱infrared transmitting glass 透红外线玻璃infrared transparent material 透红外线材料infusion 浸剂infusorial earth 硅藻土ingrain color 显色染料ingredient 拼份inhibition 抑制inhibition of reaction 反应抑制inhibitor 抑制剂initial boiling point 初镏点initial charge 首次充电initial condition 初条件initial product 最初产品initial set 初凝initial value problem 初值问题initiation 开始initiation reaction 引发反应initiator 引发剂injection 喷射injection condenser 喷射冷凝器injection molding 注入成型injector 喷射器ink 墨水ink blue 墨水蓝inner anhydride 内无水物inner complex salt 内络盐inner flame 内焰inner quantum number 内量子数inner salt 内盐inner shell electron 内壳层电子inner shell excitation 内壳电离inner shell ionization 内壳电离inoculation 接种inorganic 无机的inorganic acid 无机酸inorganic analysis 无机分析inorganic base 无机碱inorganic chemistry 无机化学inorganic compound 无机化合物inorganic ferment 无机酶inorganic indicator 无机指示剂inorganic peroxide 无机过氧化物inorganic pigment 无机颜料inorganic polymer 无机高分子inorganic precipitant 无机沉淀剂inorganic substance 无机物inosine 肌苷inosinic acid 肌苷酸inosite 肌醇inositol 肌醇inoxidability 不可氧化性inoxidizability 不可氧化性input 输入insecticide 杀虫剂insertion 插入insolubility 不溶性insoluble anode 不溶性阳极insoluble azo dye 不溶性偶氮染料insoluble matter 不溶解物质insoluble residue 不溶残渣inspection 检查inspissation 浓缩instability 不稳定instability constant 不安定常数instant adhesives 瞬间粘着剂instantaneous exposure 快速曝光instantaneous load 瞬时负荷instrument 仪器仪表instrument oil 仪泼油instrumental analysis 仪浦析instrumental error 仪企差instrumentation 仪表装置insulating brick 隔热砖insulating fire brick 隔热耐火砖insulating oil 绝缘油insulating paper 绝缘纸insulating power 绝缘能力insulating varnish 绝缘清漆insulation 绝缘insulation resistance 绝缘电阻insulator 绝缘体insulin 胰岛素insulinase 胰岛素酶integral 积分integral procedure decomposition temperature 积分过程分解温度integrated circuit 集成电路integrated intensity of reflection 反射累积强度integrating ionization chamber 积分电离室integrating wattmeter 累计瓦特计intensity factor 强度因子intensity of spectral lines 谱线强度intensive property 示强性intensive variable 示强变量interaction 相互酌interatomic distance 原子间距intercalation compound 夹层复合物interchange of heat 热交换interchangeability 互换性intercooler 中间冷却器intercrystalline corrosion 晶间侵蚀interdiffusion 相互扩散interesterification 相互酯化interface 界面interface chemistry 界面化学interface mixing 界面混合interface reaction 界面反应interface resistance 界面抗阻interfacial energy 界面能interfacial film 表面层interfacial free energy 界面自由能interfacial phenomenon 界面现象interfacial polycondensation 界面缩聚interfacial potential 界面位能interfacial tension 界面张力interference 干涉interference filter 干涉滤光片interference fringe 干涉条纹interference spectrometer 干涉光谱仪interfering line 干扰线interfering substance 干扰物质interferometer 干涉仪interferometric analysis 干扰分析interferon 干扰素interfibrillar substance 纤维间质interlayer 间层intermediary metabolism 中间代谢intermediate 中间体intermediate compound 中间化合物intermediate reaction 中间反应intermedin 中叶激素intermetallic compound 金属间化合物intermicellar reaction 胶束间反应intermixture 混合物intermolecular condensation 分子间缩合intermolecular forces 分子间力intermolecular rearrangement 分子间重排internal compensation 内消旋internal conversion 内转换intern(转载自第一范文网,请保留此标记。

维也纳条约法公约中英文版————————————————————————————————作者:————————————————————————————————日期:2Vienna Convention on the Law of Treaties 1969维也纳条约法公约The States Parties to the present Convention,本公约各当事国,Considering the fundamental role of treaties in the history of international relations,鉴于条约在国际关系历史上之基本地位,Recognizing the ever-increasing importance of treaties as a source of international law and as a means of developing peaceful cooperation among nations, whatever their constitutional and social systems,承认条约为国际法渊源之一,且为各国间不分宪法及社会制度发展和平合作之工具,其重要性日益增加,Noting that the principles of free consent and of good faith and the pacta sunt servanda rule are universally recognized,鉴悉自由同意与善意之原则以及条约必须遵守规则及举世所承认,Affirming that disputes concerning treaties, like other international disputes, should be settled by peaceful means and in conformity with the principles of justice and international law,确认凡关于条约之争端与其他国际争端同,皆应以和平方法且依正义及国际法之原则解决之,Recalling the determination of the peoples of the United Nations to establish conditions under which justice and respect for the obligations arising from treaties can be maintained,念及联合国人民同兹决心创造适当环境俾克维持正义及尊重由条约而起之义务,Having in mind the principles of international law embodied in the Charter of the United Nations, such as the principles of the equal rights and self-determination of peoples, of the sovereign equality and independence of all States, of non-interference in the domestic affairs of States, of the prohibition of the threat or use of force and of universal respect for, and observance of, human rights and fundamental freedoms for all,鉴及联合国宪章所载之国际法原则,诸如人民平等权利及自决,所有国家主权平等及独立,不干涉各国内政,禁止使用威胁或武力以及普遍尊重与遵守全体人类之人权及基本自由等原则。
Vienna Convention on the Law of Treaties 1969xx条约法公约The States Parties to the present Convention,本公约各当事国,Considering the fundamental role of treaties in the history of international relations,鉴于条约在国际关系历史上之基本地位,Recognizing the ever-increasing importance of treaties as a source of international law and as a means of developing peaceful cooperation among nations, whatever their constitutional and social systems, 承认条约为国际法渊源之一,且为各国间不分宪法及社会制度发展和平合作之工具,其重要性日益增加,Noting that the principles of free consent and of good faith and the pacta sunt servanda rule are universally recognized,鉴悉自由同意与善意之原则以及条约必须遵守规则及举世所承认,Affirming that disputes concerning treaties, like other international disputes, should be settled by peaceful means and in conformity with the principles of justice and international law,确认凡关于条约之争端与其他国际争端同,皆应以和平方法且依正义及国际法之原则解决之,Recalling the determination of the peoples of the United Nations to establish conditions under which justice and respect for the obligations arising from treaties can be maintained,念及联合国人民xx决心创造适当环境俾克维持正义及尊重由条约而起之义务,Having in mind the principles of international law embodied in the Charter of the United Nations, such as the principles of the equal rights and self-determination of peoples, of the sovereign equality and independence of all States, of non-interference in the domestic affairs of States, of the prohibition of the threat or use of force and of universal respect for, and observance of, human rights and fundamental freedoms for all,鉴及联合国宪章所载之国际法原则,xx人民平等权利及自决,所有国家主权平等及独立,不干涉各国内政,禁止使用威胁或武力以及普遍尊重与遵守全体人类之人权及基本自由等原则。
IntroductionTitanium (Ti) alloys are well-known superalloys due to their high strength-to-weight ratio, excellent mechanical properties, corrosion and hightemperature resistance and biocompatibility. They are widely applied in various industries and application areas, such as biomedical, aerospace, marine and automotive industries, and in 3D-printing for implant manufacturing, with Ti-6Al-4V (also called TC4 or Ti64) being one of the most important titanium alloys. It is known that the chemical composition of alloys can influence their properties and grades. The concentrations of both the additive and impurityelements in the alloy need to be strictly controlled to ensure the material’s quality. For example, Al, V, Fe, Sn, and Cu in a Ti alloy can enhance high-temperature creep resistance, while Y and Pd can improve corrosion resistance and thermal stability.1-2 Therefore, accurate elemental analysis of Ti alloys is important in terms of metallurgy and product quality.In current national standards (e.g., ASTM E2371-13, China National Standard GB/T 4698 and industry standard HB 7716.13), inductively coupled plasma optical emission spectroscopy (ICP-OES) is the specified technique for the determination of elements in the concentration range from percent to ppm in alloys due to its advantages of high matrix tolerance, wide linear range and multi-element analysis capabilities.3-5Determination of Major and Trace Elements in Titanium Alloys Using the Avio Max 550 ICP-OESA P P L I C A T I O N N O T EAUTHOR Shuli ChengPerkinElmer Shanghai, ChinaICP-Optical Emission SpectroscopyAccording to the test standard method ASTM E2371, most types of Ti alloys can be dissolved in two acid mixtures: HF-HNO 3 or HCl-HF-HNO 3, where HCl is needed especially for alloys containing Mo, Pd and Ru. To compare the effectiveness of the digestion, the samples were digested with two acid mixtures: HF+HNO 3 (5:1) and HCl+HF+HNO 3 (2:3:1).Approximately 0.5 g of Ti64 alloy samples were weighed and placed into DigiTUBE ® digestion tubes, followed by deionized (DI) water and acids, as shown in Table 2. Due to the strong reactivity, all acids should be added dropwise. The DigiTUBEs were then gently heated in the Sample Preparation Block (PerkinElmer, Shelton, Connecticut, USA), until the samples were completely dissolved, according to the program in Table 3. The samplesolutions were cooled to room temperature and diluted to 100 mL with deionized water in a polypropylene volumetric flask. In addition, 1 g of pure Ti metal was digested with HF and HNO 3 and diluted to 50 mL. This solution contains 2.0 g/L of Ti for preparing matrix-matched standard solution.However, one of the challenges of analyzing Ti alloys with ICP-OES is spectral interference caused by matrix elements: Ti, Al, V and Fe. In this application, the major and trace elements in Ti64 alloy samples were analyzed with the PerkinElmer Avio ® 550 Max fully simultaneous ICP-OES, demonstrating its excellent capability of accurate measurement of complex matrix samples.ExperimentalSample PreparationSamples consisted for NIST 173c Titanium Alloy UNS R56400 (National Institute of Standards and Technology, Bethesda, Maryland, USA) and an unknown Ti64 powder. NIST 173c was used for method development and accuracy validation; thecertified values are listed in Table 1.Calibration Standards PreparationAll the calibration standard solutions were prepared PerkinElmer single- and multi-element standard solutions, as well as theprepared 2.0 g/L Ti stock. The calibration standards were matrix-matched to the approximate levels of the major elements and contained 4500 ppm Ti, along with the analyte concentrations in Table 4, which were selected to match the expected concentrations in the Ti alloys.InstrumentationAll analyses were performed with the Avio 550 Max fullysimultaneous ICP-OES (PerkinElmer), which features a unique echelle optic and segmented-array charge coupled devicedetector (SCD)6, providing high-speed analysis and simultaneous measurements of all elements. The instrument’s proprietary Universal Data Acquisition (UDA)7 technology allows collection of all the spectral data for every sample in a single run, which provides flexibility of wavelength selection of all elements and simplifies method development. Plus, the combination of Flat Plate™ plasma technology 8 with vertical torch design enables the Avio to handle high matrix samples without large dilutions. And last, but certainly not least, the instrument’s dual plasma view 9 capability allows the measurement of major and minor elements in one method by setting the radial view for the determination of major elements, while axial view is used for minor elements due to its higher sensitivity.An HF-resistant nebulizer and spray chamber were used. Theinstrument's operating parameters, the wavelengths, plasma view, and background correction are listed in Tables 5 and 6. All data processing was done with Syngistix™ for ICP software.Results and DiscussionWhen analyzing metal samples, higher dilution is generally used to decrease matrix effects and spectral interferences. However, dilution also decreases the analyte concentration, which may make measurements of low-level analytes more difficult. In this work, the Ti alloy samples were diluted 200 times for analysis of all elements, from ppm to percent levels.200ppm V4500ppm Ti10ppm F e1ppm P d1ppm R u(a)(b)Figure 1. Spectra showing interferences of (a) 200 ppm V and 4500 ppm Ti on 1 ppm Pd 340.450 and (b) 10 ppm Fe on 1 ppm Ru 240.272.No MSFNo MSFMSF MSF(a)(b)Figure 2. Spectra of (a) Pd and (b) Ru spiked at 0.1 ppm in NIST CRM 173C, with (pink) and without (blue) MSF applied.To deal with spectral interferences caused by major elements, the Multicomponent Spectral Fitting (MSF) capability (includedin Syngistix software 10) was applied to Ru and Pd. Figure 1 shows the overlayed spectra of 1 ppm of Pd and Ru and the matrix elements: 4500 ppm Ti, 200 ppm V and 10 ppm Fe. By applying MSF, as shown in Figure 2, the spectral interferences were effectively removed, yielding an interference-free spectrum (pink), allowing accurate determination of Pd and Ru at very low concentration levels (0.1 mg/L).Excellent calibrations were obtained, with regression coefficients greater than 0.999 for all elements. The method detection limits (MDLs) were determined by analyzing 10 replicates of the 4500 mg/L Ti matrix blank solution. Figure 3 shows the reporting limits (LOR) in sample calculated as 3*MDL. The LORs are far below the lower limits specified on ASTM E2371-13, demonstrating the excellent sensitivity of theAccuracyTo verify the accuracy of the results, NIST CRM 173C wasprepared with both acid mixtures and analyzed. The results from the two digestion acid mixtures are compared in Figure 4 and show that all the elements were within ± 10% of the certified values, demonstrating that both acid mixtures are suited for the that the Avio 550 Max system is capable of measuring elements at low levels by using MSF to correct for spectral interferences.Figure 4. Recoveries for the certified elements in CRM 173c sample digested with Figure 5. Recoveries for the spiked elements in NIST 173c sample.ConclusionThe results presented here demonstrate the ability of Avio 550 Max fully simultaneous ICP-OES to analyze challenging Ti alloy samples. The Flat Plate plasma technology, vertical torch design and dual view enable the Avio 550 Max to perform this analysis and obtain excellent recoveries from a wide concentration range. Multicomponent Spectral Fitting (MSF) was successfully applied for spectral interference correction, ensuring accurate results for all elements with excellent recoveries.Figure 3. LOR of analytes in Ti alloy measured (blue) and specified in LOR measured LOR specified in ASTM 2371References1. Matthew J. Donachie, Jr., Titanium, a Technical Guide, 2000.2. https:///3. A STM E2371-13, Standard Test Method for Analysis of Titanium and Titanium Alloys by Direct Current Plasma and Inductively Coupled Plasma Atomic Emission Spectrometry.4. G B/T 4698-2019, Methods for chemical analysis of titanium sponge, titanium and titanium alloys.5. H B 7716 -2002, Spectrometric analysis of titanium alloys.6. “Avio 550/560 Max ICP-OES Optical System and SCD Detector”, Technical Note, PerkinElmer, 2020.7. “Universal Data Acquisition in Syngistix Software for Avio 550/560 Max ICP-OES”, Technical Note, PerkinElmer, 2020.8. “Flat Plate Plasma Technology on the Avio Max Series ICP-OES”, Technical Note, PerkinElmer, 2020.9. “Vertical Dual View on the Avio Max Series ICP-OES”, Technical Note, PerkinElmer, 2020.10. “Multicomponent Spectral Fitting”, Technical Note,PerkinElmer, 2017.Consumables UsedFor a complete listing of our global offices, visit /ContactUsCopyright ©2023, PerkinElmer U.S. LLC. All rights reserved. PerkinElmer ® is a registered trademark of PerkinElmer U.S. LLC. All other trademarks are the property of their respective owners.PerkinElmer U.S. LLC 710 Bridgeport Ave.Shelton, CT 06484-4794 USA (+1) 855-726-9377。
苏州市2023 ~2024学年第一学期期中调研试卷高三英语2023.11.07注意事项:1.本试卷满分150分。
考试时间120分钟。
2.答题前,务必将自己的学校、姓名、考试号等相关信息写在答题卡上规定的地方。
3.回答选择题时,选出每小题答案后,用铅笔把答题卡上对应题目的答案标号涂黑。
如需改动,用橡皮擦干净后,再选涂其他答案标号。
回答非选择题时,将答案写在答题卡上,写在本试卷上无效。
第一部分听力(共两节,满分30分)做题时,先将答案标在试卷上。
录音内容结束后,你将有两分钟的时间将试卷上的答案转涂到答题卡上。
第一节(共5小题; 每小题1.5分,满分7.5 分)听下面5段对话。
每段对话后有一个小题,从题中所给的A、B、C三个选项中选出最佳选项。
听完每段对话后,你都有10秒钟的时间来回答有关小题和阅读下一小题。
每段对话仅读一遍。
1. What does the woman need?A. Shorts.B.A sun hat.C. Sunglasses.2.How does the man want to trave1?A. By car.B. By train.C. By plane.3. When did the alarm go off?A. At 2:00.B. At 6:00.C. At 5:00.4. What is the woman doing?A. Preparing to leave.B. Calling a cab.C. Checking into a hotel.5. What is the conversation mainly about?A. Driving lessons.B. The weather.C. The man's work.第二节(共15小题; 每小题1.5分,满分22.5分)听下面5段对话或独白。
每段对话或独白后有几个小题,从题中所给的A、B、C三个选项中选出最佳选项。
高效液相色谱-电喷雾离子源-串联三重四极杆质谱法分析地表水中高氯酸盐谢永洪;杨坪;钱蜀;姚欢;谢振伟;万旭;葛军【摘要】建立了高效液相色谱-电喷雾离子源-串联三重四极杆质谱( HPLC-ESI-MS/MS)测定地表水中高氯酸盐的方法。
以Dionex IonPac AG20阴离子交换柱为分析柱,弱碱性的0.056%氨水/5 mmol/L乙酸氨为流动相,1.0 mL/min的流速,电喷雾负离子模式电离,MS/MS串联质谱为检测器,多反应监测( MRM)模式检测高氯酸盐。
方法检出限达0.043μg/L,线性范围为0.2~50μg/L,线性相关系数为0.9994,含量分别约为2、6、30μg/L的实际样品进样10次得到的相对标准偏差分别为2.47%、4.55%、0.49%,样品加标回收率在80%~109%,将该法与 US EPA method314.0进行比对,结果基本吻合。
%A method was developed for determination of perchlorate in surface water based on high performance liquid chromatography-electrospray ion source-tandem mass spectrometry ( HPLC-ESI-MS/MS) . The anion exchange column of Dionex IonPac AG20 was used as the analytical column with the weakly alkaline mobile phase of 0.056% ammonia/5 mmol/L Ammonium acetate and the flow rate of 1.0 mL/min.-ESI MS/MS was used as the detector and the perhclorate was detected under multiple reaction monitoring( MRM) mode. The detection limit of the developed method was 0.043 μg/L and the linear range was 0.2-50μg/L wit h the linear correlation coefficient of 0.999 4, the relative standard deviation for about 2, 6, 30 μg/L sample were 2.47%,4�55%, 0.49%, respectively. Content recovery percentages ranging from80% to 109% were obtained and the analysis results were of agreement with that analyzed by US EPA method314.0.【期刊名称】《中国环境监测》【年(卷),期】2014(000)001【总页数】5页(P164-168)【关键词】高效液相色谱-电喷雾离子源-串联三重四极杆质谱;高氯酸盐;地表水【作者】谢永洪;杨坪;钱蜀;姚欢;谢振伟;万旭;葛军【作者单位】四川省环境监测中心站,四川成都610041;四川省环境监测中心站,四川成都 610041;四川省环境监测中心站,四川成都 610041;四川省环境监测中心站,四川成都 610041;四川省环境监测中心站,四川成都 610041;四川省环境监测中心站,四川成都 610041;四川省环境监测中心站,四川成都 610041【正文语种】中文【中图分类】X832高氯酸盐被广泛用于军工、核电、纺织印染、电镀工作等领域[1],具有强稳定性、易溶于水等特点,且在大多数土壤和矿物质上的吸附性很弱,一旦进入水体会持续迁移,从而导致大范围的地表水源和地下水受到污染,需要十几年才能降解[2-3]。
IntroductionIndole-3-acetic acid (IAA, Fig. 1) is the most common, naturally occurring plant hormone of the auxin class, and it possesses high activity even at low concentrations in plants.1,2 IAA has many different effects, as all auxins do, such as inducing cell elongation and cell division which are essential for plant growth and development. On a larger scale, IAA serves as the signaling molecule necessary for development of plant organs and coordination of growth.2–4 IAA exists in many kinds of vegetables and fruits, but the intake of IAA from cooked vegetables is very low because IAA easily decomposes open exposure to UV-light, heat and oxygen. However, without cooking or drying, IAA exists in plants at a concentration of its natural content. According to Motojima ’s research, IAA as a natural metabolite of the amino acid tryptophan in mammals with the aid of monoamine oxidase,5 has no obvious effect onthe healthy organism, but can cause discomfort in mammals suffering from liver and kidney disease.6 The intake of IAAmay cause proximal tubular injury via hOAT1-mediated (human renal organic anion transporter 1) uptake in patients with kidney disease. Therefore, it is essential to quantitatively determine IAA in fruits and foodstuff to minimize injury to patients with progressive renal disease and to assure correct utilization of natural resources.Several analytical methods have been developed for the determination of IAA in these matrices, such as differentialpulse voltammetry (DPV),7 high performance liquid chromatography (HPLC),8 liquid chromatography-electrospray tandem mass spectrometry (LC-ESI-MS/MS),9,10 and hollow fiber-based liquid –liquid –liquid microextraction combined with high performance liquid chromatography-ultraviolet detection (HF-LLLME/HPLC-UV).11 However, these methods are usually accompanied by time-consuming and material-consumingprocedures and also are a cause of environmental pollution.Hence, a simple and practicable method is expected for the efficient and accurate determination of IAA in plants. In this work, IAA in coconut water (CW) and its product coconut milk (CM) were successfully determined by using excitation-emission fluorescence in combination with the second-order calibration method. Furthermore, in order to test the reproducibility of the proposed method, inter- and intra-day experiments were repeated within three days.Theory Trilinear component modelThe trilinear decomposition algorithm is suitable for three-2014 © The Japan Society for Analytical Chemistry†T o whom correspondence should be addressed.E-mail: hlwu@Interference-free Determination of Indole-3-Acetic Acid in Two Real Systems Using Second-order Calibration Method Coupled with Excitation-emission Matrix FluorescenceXiu-Fang Y AN , Hai-Long W U ,† Xiang-Dong Q ING , Yan-Mei S UN , and Ru-Qin Y UState Key Laboratory of Chemo/Biosensing and Chemometrics, College of Chemistry and Chemical Engineering, Hunan University, Changsha 410082, P . R. ChinaIn this work, a simple and practicable method that combines excitation-emission matrix (EEMs) fluorescence with a second-order calibration method based on parallel factor analysis-alternative least-squares (PARAFAC-ALS) algorithm was developed for the direct interference-free determination of indole-3-acetic acid (IAA) in two real systems, coconut water (CW) and coconut milk (CM). Although the excitation and emission profiles of IAA heavily overlapped with that of unknown interferents in the complex real systems, the actual contents and satisfactory recoveries were still obtained successfully. The contents of IAA in CW and CM were 10.8 ± 0.3 and 4.9 ± 0.2 μg mL –1, respectively, which were consistent with those reported by LC-MS/MS assays in the reference material. The average spike recoveries of IAA in the validation set based on CW and CM were 102.1 ± 3.2 and 98.0 ± 1.9%, respectively. In addition, routine experiments were performed for establishing the validity of the assay to internationally accepted criteria.Keywords IAA, EEMs, second-order calibration, PARAFAC-ALS(Received November 19, 2013; Accepted February 12, 2014; Published April 10, 2014)Fig. 1 Chemical structure formula of indole-3-acetic acid (IAA).way data sets (X ) that satisfy the trilinear structure, which could be constructed from several two-way data or directly produced by luminoscope or hyphenated instruments (such as EEMs, HPLC-DAD). The noted trilinear component model proposed by Harshman, Caroll and Chang is one of the most acceptable models in the field of chemometrics.12,13 The trilinear component model could be described as follows:x a b c e i I j ijk n Nin jn kn ijk=∑+===111(,...,;,...,k K =1,...,) (1)where x ijk is the (i , j , k )th element of X , and i , j , k represent three different modes of the three-way data array, respectively. In this work, x ijk is the fluorescence intensity of sample k at excitationwavelength i and emission wavelength j , N is the total numberof factors that can be detected in the system, which should be considered as the total number of detectable species, containingthe component(s) of interest and the background as well as the uncalibrated interferent(s). a in is the element (i , n ) of I × N matrix A , b jn is element (j , n ) of J × N matrix B , and c kn is the element of K × N matrix C , and e ijk is the residual element of an I × J × K three-way residual array E . In matrix form, the trilinear component model can be expressed as:X I ×JK = A (C B )T + E I ×JK , i = 1, 2,…, I (2a)X J ×KI = B (A C )T + E J ×KI , j = 1, 2,…, J (2b)X K ×IJ = C (B A )T + E K ×IJ , k = 1, 2,…, K (2c)where “ ” denotes the Khatri –Rao product.14PARAFAC-ALS algorithmThe parallel factor analysis-alternative least-squares (PARAFAC-ALS) algorithm is commonly carried out through an alternative least-squares (ALS) minimization scheme, which was originated from psychometrics and first proposed by Harshman under that name in 1970.12 At the same time, Carol and Chang studied it under the name of canonical decomposition (CANDECOMP).13 According to Eqs. (2a) – (2c), the general updates of the PARAFAC-ALS procedure can be repeated as follows:A = X I ×JK [(CB )T ]+, (3a)B = X J ×KI [(AC )T ]+, (3b)C = X K ×IJ [(B A )T ]+,(3c)where ‘+’ denotes the Moore –Penrose inverse. C is calculated by initializing A and B randomly by using Eq. (3c), then A and B are computed by Eqs. (3a) and (3b), respectively.15Figures of meritFigures of merit is of significant importance in developing and assessing the reliability of analytical methodologies, such as net analyte signal (NAS),16,17 selectivity (SEL), sensitivity (SEN),17the limit of detection (LOD), the limit of quantification (LOQ)18 and the root-mean-square error of prediction (RMSEP).19 The SEN and SEL for a particular analyte are presented as follows:16,17SEN = k {[(B T B )–1]nn [(C T C )–1]nn }–1/2, (4)SEL = {[(B T B )–1]nn [(C T C )–1]nn}–1/2, (5)where nn designates the (n , n ) element of a matrix, k is the total signal for component n at unit concentration and it represents a parameter for converting scores to concentrations. The LOD and LOQ are calculated as the Eqs. (6) and (7) according to the literature:18LOD = 3.3s (0) (6)LOQ = 10s (0)(7)where s (0) is the standard deviation in the concentrationestimated from three different background blank samples.The root-mean-square error of prediction can be described as:RMSEP /m Mact,m pred,m 1/2=−∑−=[{()}()]1112M c c (8)where M is the number of prediction samples, and c act,m and c pred,m are correspond to the actual added and predicted concentration of analytes of interest, respectively.Experimental Reagents and chemicalsIAA (>99%) was purchased from Aladdin Regent (Shanghai, China), stored and used as soon as received. All other chemicals used were of analytical grade and all of the solutions were prepared with ultra-pure grade water. Ultra-pure grade water with parameter of 18.20 M Ω cm –1 was prepared using a Milli-Q water purification system (Millipore, USA). Coconut water and coconut milk were purchased from local markets. A buffer solution of pH 5.6 was prepared by using sodium hydrogen phosphate and citric acid. IAA was weighed accurately 10.36 g, dissolved in 10.0 mL alcohol, then transferred to a 50.0-mL brown glass volumetric flask and diluted with ultrapure water to the mark to obtain a stock solution with a concentration of 207.2 μg mL –1. It was then wrapped in silver paper and stored in darkness at 4 C. A working solution of coconut water was prepared by diluting 5.0 mL fresh coconut water with ultrapure water to 250.0 mL, and was not subjected to any other pretreatment except filtering through a 0.45-μm cellulose membrane filter. The working solution of coconut milk was obtained by handling 5.0 mL coconut milk in the same manner as the coconut water samples.ApparatusAll measurements of the fluorescence signal were performed on a fluorescence spectrophotometer (F-7000, Hitachi, Japan) equipped with a continuous Xenon arc lamp and a computer. EEMs were record every 2.0 nm over the range of 202.0 – 330.0 and 250.0 – 450.0 nm for excitation and emission wavelengths, respectively. The excitation and emission slit widths were both 5.0 nm and the working voltage was 600 V . All computer programs were written in-house in the MATLAB environment, and all programs were run on an IBM compatible microcomputer.Experimental process A calibration set of seven samples (C01 – C07) was constructed with concentrations designed as an arithmetic progression in therange of 8.0 – 80.0 ng mL –1, within the linear range of IAA of 6.0 – 500.0 ng mL –1 and with a correlation coefficient of R 2 =0.997. Then one group of three actual samples of coconut water(CW01 – CW03, 1.0 mL CW working solution diluted to10.0 mL) and another coconut milk (CM01 – CM03, 0.9 mLCM working solution diluted to 10.0 mL) group were prepared, respectively. What is more, five validation samples based on these two actual systems (V A01 – V A05 for coconut water andVB01 – VB05 for coconut milk) were constructed, respectively.The validation samples were obtained by spiking IAA into the same amount of actual samples within the concentration of the calibration range by arithmetic progression. The concentrations of the calibration set are displayed in Table 1 and those for the other samples are shown in the columns 1, 2, 5, and 6 of Table 2.Results and DiscussionSpectra characteristics of IAA and two corresponding samples Figure 2 presents the spectra contour map of IAA (sample C04), CW (CW01) and CM (CM01) which had been substituted Rayleigh and Raman scattering as fitted value (described in the next section). As can be seen from Fig. 2, the location of thepeak only presents a slight difference, the maximum emission peak of IAA, CW and CM are located at 360.0, 350.0 and 334.0 nm, respectively. This shows that one or more interferents exist in these two actual systems and present seriously overlapped profiles with the spectra profile of IAA, which can be further verified in the next section. However, under this circumstance, without combining with the chemometric method, the traditional fluorescence method is not sufficient for directly quantifying the analytes of interest from these seriously overlapped and highly colinearity spectra. This could only be achieved with the aid of complex sample separation and extraction, which are both labor and resource intensive.Three-dimensional fluorescence spectra of IAA and the data processingThe first-order Rayleigh scattering that partly overlaps with the signals of IAA and the Raman scattering that even runs throughout it makes the data analysis rather difficult. When selecting a rectangular area without Rayleigh and Raman scattering, it will result in losing a great deal of information of the samples or even lead to erroneous results. So a method for dealing with this problem was taken.20 Figure 3 demonstrates one part of the data treatment procedure, and Fig. 3(a) presents the original three-dimensional spectra of the calibration sample C04. The spectra then can be seen as Fig. 3(b) after substituting the first-order and second-order Rayleigh scattering and Raman scattering as missing, and Fig. 3(c) corresponds to the three-dimensional spectra of C04 which had been handled by the interpolation method.20,21 All of the data obtained had been handled by the same data process by substituted Rayleigh andRaman scattering as fitted value using the interpolation method.Fig. 2 The excitation and emission spectra of indole-3-acetic acid (IAA), coconut water (CW) and coconut milk (CM). (a) illustrates the contour map of excitation-emission spectra of pure IAA, (b) and (c) correspond to the excitation-emission fluorescence spectra of CW and CM, respectively.Table 1 Concentrations of seven calibration samplesSample IAA/ng mL –1C01C02C03C04C05C06C078.020.032.044.056.068.080.0Table 2 Actual and validation samples and the results obtained from the PARAFAC-ALS algorithm Sample Spiked/ng mL –1Found/ng mL –1Recovery a ,%Sample Spiked/ng mL –1Found/ng mL –1Recovery b ,%V A01V A02V A03V A04V A05 8.026.044.062.080.0 29.6 48.6 66.2 87.8101.0 99.6103.7101.3106.7 99.2VB01VB02VB03VB04VB05 8.026.044.062.080.016.434.351.670.888.1 95.0 98.1 97.2100.0 99.1CW01CW02CW030.0 0.0 0.022.0 21.9 21.021.6 ± 0.6CM01CM02CM030.0 0.0 0.08.3 9.2 8.88.8 ±0.5a. Recovery = (found concentration – basic concentration(CW))/spiked concentration × 100%.b. Recovery = (found concentration – basic concentration(CM))/spiked concentration × 100%.In second-order calibration, estimation of the number of components is of great importance. In this work, the number of components N = 4 was obtained from the core consistency diagnostic.22While considering that 1) the presence of noise and interferents in the target systems may affect the rank estimation process, and 2) two different and complexactual Fig. 3 Excitation-emission spectra of sample C04. (a) represents the original spectrum, (b) illustratesthe spectrum after removal of the Rayleigh and Raman scattering, and (c) shows the spectrum had beenhandled by the interpolation method.Fig. 4 Normalized resolved excitation and emission spectra and relative concentration profileobtained from the PARAFAC-ALS algorithm with N = 4. (a) Excitation spectra, (b) emission spectra,(c) relative concentration profile, (d) the relationship between the actual concentration and the resolvedrelative value.systems were analyzed together. Finally, the number of components N = 4 was selected for the quantitative analysis of IAA in the two actual systems by using the PARAFAC-ALS algorithm. The normalized excitation and emission profiles, as well as the relative concentration information are clearly illustrated in Fig. 4. Although the excitation and emission spectra of these interferents seriously overlapped with the spectra of IAA, the quantitative analysis of IAA in these two actual systems was still achieved successfully due to the ‘second-order advantages’of the second-order calibration method.23–27Figures 4(a) and 4(b) show the resolved IAA excitation and emission spectral profiles and the corresponding actual spectra profiles of IAA acquired by normalization practical measured spectra. The resolved spectra of IAA (the blue line) dovetail extremely well with the actual spectra profile of IAA (the bright orange dotted line), both for the excitation and emission spectra. Figure 4(c) presents the relative concentration profile of IAA, background and interferents. The results should be acceptable for the uniqueness of the trilinear decomposition, the high consistency between the resolved and actual spectra fully guaranteed the uniqueness of the third mode, namely, the resolved concentration profile of IAA. Due to the ‘second-order advantages’ of second-order calibration based on the PARAFAC-ALS algorithm, the spectra profile of IAA can be resolved from the mixed spectra data, which contained unknown interferents and background. Figure 4(d) illustrates the relationship between the resolved concentration profile and the actual concentration. The contents of IAA in CW and CM located perfectly on the regression curve (LS line) within the range of calibration concentration, which suggests the content of the IAA in CW and CM has been correctly detected.The actual contents of IAA in real samplesRegression with the actual concentration and the resolved concentration profile of IAA in the calibration set achieved a calibration curve with correlative coefficient of R2 = 0.999, which indicated that the IAA possesses good linear correlation in the range of 8.0 – 80.0 ng mL–1. Table 2 summarizes the spiked concentration and the found concentration of IAA in CW and CM samples. The average contents of IAA in CW and CM were 21.6 ± 0.6 and 8.8 ± 0.5 ng mL–1, respectively, and when converted back to the actual contents of IAA in CW and CM, according to the dilution ratio, turned into 10.8 ± 0.3 and 4.9 ± 0.2 μg mL–1, respectively. In addition, the average recovery of the validation set based on CW was of 102.1 ±3.2%, and for CM was 98.0 ± 1.9%, which suggested that the results were quite reliable.Comparison of analytical resultsThe comparison of the results of the actual contents of IAA in CW obtained from different works following different analytical approaches was taken. In this work, the contents of IAA in CW of 10.8 ± 0.3 μg mL–1was quite similar to 0.122 μM (21.38 μg mL–1) obtained by the LC-MS/MS assay by Ma et al.,10the tiny difference falls within the acceptable range attributable to using different coconut materials. Due to the power of the ‘second-order advantages’of the second-order calibration method used in this work, the experiment has been simplified to a great extent. In this work, except for filtering through a 0.45-μm cellulose membrane filter for removing solids presented in CW and CM, no other pretreatments were adopted. However, for the LC-MS/MS method, the complex pretreatment process and the loss of analytes of interest during the chemical extraction and purification are inevitable. Furthermore, from the data demonstrated in Table 3, we can come to the conclusion that EEM is superior to LC-MS/MS for the determination of IAA in LOD and LOQ.Figures of meritIn order to evaluate the performance of the proposed method, figures of merit including SEL, SEN, LOD, LOQ and RMSEP, based on the second-order calibration algorithm PARAFAC have been studied, and the results are summarized in Table 3. Compared with the LC-MS/MS method mentioned above (in which the LOD value was 3.8 μM (220.8 ng mL–1)), the LOD was significantly lower in this work. Moreover, other satisfactory figures of merit were also acquired here, which indicated that the proposed method would be effective for quantifying analytes of interest even in the presence of other unknown and uncalibrated fluorescent components.Inter- and intra-assay accuracy and precisionIn order to test inter- and intra-assay accuracy and precision of the proposed method, inter- and intra-day experiments were carried out by assaying five replicates of each of the five concentrations of validation samples on two real systems (CW and CM) within three days. The results of average recovery ±standard deviation (SD) and relative standard deviation (RSD, %) are summarized in Table 4. The average RSDs of the validation set based on CM and CW were about 5.5 and 2.6%, respectively. All other values obtained were also well within internationally recognized acceptance criteria for assay validations, which indicated the proposed method possesses good reproducibility.Table 4 Results of inter- and intra- day experiments obtained from PARAFAC-ALSSampleAdded/ng mL–1Inter-day Intra-dayRecoveryaverage ± SD a, %RSD b,%Recoveryaverage ± SD a,%RSD b,% CW8.026.044.062.080.0105.7 ± 8.7103.4 ± 7.3100.2 ± 1.899.4 ± 4.799.5 ± 5.88.37.11.84.75.8104.2 ± 7.599.1 ± 5.4103.5 ± 5.8101.7 ± 5.8100.5 ± 3.37.25.45.65.73.3 CM8.026.044.062.080.096.7 ± 3.297.4 ± 1.096.5 ± 1.295.5 ± 2.891.6 ± 0.13.31.01.23.03.399.3 ± 1.4100.2 ± 1.899.3 ± 3.897.5 ± 4.293.8 ± 2.21.41.93.84.32.4a SDb RSD SD...=×100xTable 3 Figures of merit of determination of IAA using the PARAFAC-ALS algorithmSELSEN/mL ng–1LOD/ng mL–1LOQ/ng mL–1RMSEP/ng mL–1Method Ref.0.07NG a27.35NG0.79220.82.39669.21.53NG aEEMsLC-MS/MSThis work10 a. No given.ConclusionsIn this paper, the combination of excitation-emission fluorescence matrix with second-order calibration method based on the PARAFAC-ALS algorithm was developed and validated for the successful determination of IAA in two different real systems simultaneously. The proposed method was fully validated by studies on the average recoveries of validation sets based on real system samples, the reproducibility of the proposed method and figures of merit. The method used in this paper is quite simple, rapid, convenient, reliable and practical, and possesses high selectivity and capability for the determination of analytes of interest in different real samples. The proposed method provides an excellent alternative for the direct determination of IAA in complex actual systems, without the need for analytical separation.AcknowledgementsThe authors gratefully acknowledge financial support from the National Natural Science Foundation of China (Grant No. 21175041) and the National Basic Research Program (No. 2012CB910602) as well as the Foundation for Innovative Research Groups of NSFC (Grant No. 21221003). References1. M. P. De Mello, S. M. De Toledo, M. Haun, G. Cilento, andN. Duran, Biochemistry, 1980, 19, 5270.2. P. J. Davies, “The P lant Hormones: Their Nature,Occurrence, and Functions”, 2010, Plant Hormones, Springer Netherland, New York, 1.3. H. Tanaka, P. Dhonukshe, P. Brewer, and J. Friml, Cell.Mol. Life Sci., 2006, 63, 2738.4. S. Vanneste and J. Friml, Cell, 2009, 136, 1005.5. M. J. Sarrias, P. Cabré, E. Martínez, and F. Artigas, J.Neurochem., 1990, 54, 783.6. M. Motojima, A. Hosokawa, H. Yamato, T. Muraki, and T.Yoshioka, Br. J. Pharmacol., 2002, 135, 555.7. J. Bulícˇková, R. Sokolová, S. Giannarelli, and B. Muscatello,Electroanalysis, 2013, 25, 303.8. K. Hoenicke, T. J. Simat, H. Steinhart, H. J. Köhler, and A.Schwab, J. Agric. Food Chem., 2001, 49, 5494.9. A. Durgbanshi, V. Arbona, O. Pozo, O. Miersch, J. V.Sancho, and A. Gomez-Cadenas, J. Agric. Food Chem., 2005, 53, 8437.10. Z. Ma, L. Ge, A. S. Lee, J. W. H. Yong, S. N. Tan, and E. S.Ong, Anal. Chim. Acta, 2008, 610, 274.11. Y. Wu and B. Hu, J. Chromatogr. A, 2009, 1216, 7657.12. R. A. Harshman, UCLA Working P apers in P honetics,1970, 16, 1.13. J. D. Carroll and J.-J. Chang, Psychometrika, 1970, 35,283.14. C. G. Khatri and C. R. Rao, Sankhya, Ser. A, 1968, 30, 167.15. A.-L. Xia, H.-L. Wu, S.-H. Zhu, Q.-J. Han, Y. Zhang, andR.-Q. Yu, Anal. Sci., 2008, 24, 1171.16. A. Lorber, Anal. Chem., 1986, 58, 1167.17. C. Ho, G. Christian, and E. Davidson, Anal. Chem., 1980,52, 1071.18. R. Boqué, J. Ferré, N. K. M. Faber, and F. X. Rius, Anal.Chim. Acta, 2002, 451, 313.19. A. Lorber, K. Faber, and B. R. Kowalski, Anal. Chem.,1997, 69, 1620.20. M. Bahram, R. Bro, C. Stedmon, and A. Afkhami, J.Chemom., 2006, 20, 99.21. Y. Li, H.-L. Wu, Y.-J. Yu, S. Zhang, Y. Chen, D.-Z. Tu,C.-C. Nie, H. Xu, and R.-Q. Yu, Anal. Methods (UK), 2012,4, 3987.22. R. Bro and H. A. L. Kiers, J. Chemom., 2003, 17, 274.23. P. C. Damiani, A. J. Nepote, M. Bearzotti, and A. C.Olivieri, Anal. Chem., 2004, 76, 2789.24. E. Fuentes, M. E. Báez, M. Bravo, C. Cid, and F. Labra,Food Anal. Methods, 2012, 5, 1311.25. A.-L. Xia, H.-L. Wu, D.-M. Fang, Y.-J. Ding, L.-Q. Hu, andR.-Q. Yu, Anal. Sci., 2006, 22, 1189.26. H. L. Wu, M. Shibukawa, and K. Oguma, J. Chemom.,1998, 12, 1.27. D.-M. Fang, H.-L. Wu, Y.-J. Ding, L.-Q. Hu, A.-L. Xia, andR.-Q. Yu, Talanta, 2006, 70, 58.。