Microsoft Dynamics大数据分析方案
- 格式:pdf
- 大小:22.42 MB
- 文档页数:25
dynamics365基本概念Dynamics365基本概念概念1:Dynamics365是什么?•Dynamics365是由Microsoft开发的一套集成的企业解决方案,旨在帮助企业提高运营效率和客户关系管理。
•它整合了一系列应用程序,包括销售、客户服务、市场营销和人力资源管理等,以帮助企业实现数字化转型。
概念2:Dynamics365的核心组件•Dynamics365由多个核心组件组成,每个组件适用于不同的业务功能:–销售:用于管理销售流程、跟踪销售机会并提高客户满意度。
–客户服务:用于提供出色的客户服务和支持。
–市场营销:用于创建和执行市场营销活动,吸引和保持客户。
–人力资源管理:用于管理员工信息、招聘流程和绩效评估等。
概念3:Dynamics365的关键功能•Dynamics365具有一些关键功能,以帮助企业提高业务效率:–业务流程自动化:通过定义和自动化业务流程,提高团队的工作效率。
–数据分析和报告:利用内置的分析工具和仪表板,实时监控业务绩效并提供有关数据的洞察。
–移动应用程序:通过移动应用程序访问和管理Dynamics365,随时随地处理业务事务。
–云端部署和安全性:通过云计算技术,实现灵活部署和高级安全性。
概念4:Dynamics365的优势和用途•Dynamics365的优势和用途有很多:–统一视图:通过整合各个应用程序和功能,提供一致的数据视图,促进团队协作和决策。
–客户关系管理:提供全面的客户关系管理功能,跟踪销售过程并优化客户体验。
–效率提升:通过自动化和集成的业务流程,提高团队的工作效率并加速业务交付。
–数据驱动决策:通过数据分析和报告功能,获得有关业务绩效和趋势的洞察,支持决策制定。
–可扩展性和定制性:通过开放的API和扩展性框架,根据企业需求进行定制和扩展。
概念5:Dynamics365的实施和部署•Dynamics365的实施和部署通常包括以下步骤:1.确定需求:根据企业业务需求,确定实施Dynamics365的功能和配置要求。
Microsoft Dynamics® AXTracing Dynamics AX 2009 Role Center KPI’sSummary: This document explains how to trace the data displayed in a Role Center page KPI to its source in the Microsoft Dynamics AX online transaction processing (OLTP) database.Author:Catherine McDade, Support Escalation EngineerDate Published: January, 2010Table of ContentsIntroduction (3)Terminology (4)KPI walkthrough (9)Description of KPI example (9)Step-by-step (9)Appendix A: Useful links (31)IntroductionThe prominent place of key performance indicators (KPIs) in Microsoft Dynamics AX 2009 Role Center pages has prompted questions about where the KPI data is drawn from. This document explains how to trace the data displayed in a KPI to its source in the Microsoft Dynamics AX online transaction processing (OLTP) database.Microsoft Dynamics AX relies on SQL Server Analysis Services (SSAS) for its business intelligence processing. In the following sections, we define terms of importance for SSAS, and then provide an example of how to trace the data for a KPI on a Role Center page.TerminologyKey Performance Indicator (KPI)A Key Performance Indicator is a measurement for gauging business success, or, in other words, ameasure of business metrics against targets. For example, a Sales Amount KPI could show sales from the last quarter and display a green icon if you are at budget, yellow if you are within 5% of budget, and red if you are under 5% of budget.Online Analytical Processing (OLAP)OLAP systems (such as that supported by SSAS) aggregate and store data at various levels across various categories.FactsFacts are predominantly numeric measurements, such as price or quantity, and represent the key business metrics that you want to aggregate and analyze. Facts form the basis of calculations, and you often aggregate them for members of a dimension.DimensionsDimensions form the contexts for the facts, and define the aspects of a business by which the facts are aggregated. For example, Items could be a dimension, while Price and Quantity could be facts of that dimension.Data sourceA data source stores the connection information for an SSAS project and/or database. WithMicrosoft Dynamics AX, the project or OLAP database that you create has a data source that points to your Microsoft Dynamics AX OLTP database.Data source viewA data source view contains the logical model of the schema used by an SSAS database object.Data source views can filter, apply calculations, and create joins on objects in the data source. In the OLAP database that Microsoft Dynamics AX creates, most of the data source views are simply views of a specific table, though some views may include a SQL statement that contains filters, calculations, or joins.MeasuresA measure represents a column that contains quantifiable data, usually numeric, that can beaggregated. A measure is generally mapped to a column in a fact table. An example of a measure would be Sales Amount or Cost of Goods Sold (COGS).CubeCubes store summarized fact and dimension data in structures that are multidimensional (that is, containing more than the two dimensions found in spreadsheets and normal database tables).Dimensions define the structure of the cube, and measures provide the numeric values of interest to an end user.Microsoft Dynamics AX 2009 ships with the following 10 default cubes:∙Accounts Receivable∙Human Resources Management∙General Ledger∙Production∙Project Accounting∙Purchase∙Sales∙Customer Relationship Management∙Expense Management∙Accounts payableMultidimensional Expressions (MDX)MDX is a query language, analogous to Structured Query Language (SQL), that is used to retrieve multidimensional data from a cube.Business Intelligence Development Studio (BIDS)An integrated development environment (IDE) based on Microsoft Visual Studio 2005 or 2008 and used to create and modify business intelligence solutions. This is the tool that you use to view and/or modify your Dynamics AX OLAP project or database.ProjectIn BIDS, a project is a collection of objects that make up your OLAP database. BIDS stores the objects (cubes, dimensions, etc) as files in the file system. It is recommended that you create a project for your OLAP database so that when you are making changes you are not affecting the database until you deploy.Below is a screen shot of BIDS opened to a project, followed by two screen shots that label the various sections of the BIDS environment.Detail view of BIDS, left side:Detail view of BIDS, right side:KPI walkthroughDescription of KPI exampleThis section walks you through an example of how to determine the origin of KPI values. We will use screen shots as needed to illustrate procedures.Scenario: Your CEO views her Role Center and wants to know where the numbers for the Production Cost KPI are coming from.Step-by-step1.In the Microsoft Dynamics AX client, go to the User profiles form (Administration >Setup > User profiles). On the form find and select CEO in the Profile ID column andthen click the View Role Center button.2. For the Production KPIs click the Manage KPIs link.3. Click the edit button on Production cost (the pencil icon). It will tell you that this ispulling from the Production Cube and the Production Cost KPI.4. To look at the KPI open SQL Server Business Intelligence Development Studio (BIDS). Ifyou are running SQL Server 2005, BIDS can be found at Start > All Programs >Microsoft SQL Server 2005 > SQL Server Business Intelligence DevelopmentStudio. If you are running SQL Server 2008, BIDS can be found at Start > All Programs > Microsoft SQL Server 2008 > SQL Server Business Intelligence Development Studio.5. Open your OLAP database (File > Open > Analysis Services Database).6. On the Connect To Database form, select Connect to existing database. Enter thename of the SQL Server Analysis Services Server in the Server field. In the Database field, enter Dynamics AX.Note: By default your OLAP database is named Dynamics AX. If you have applied adifferent name, use that name for Dynamics AX in the step above.7. Open the Production cube in the Solution Explorer section of BIDS. Find ProductionCube, right-click, and select Open.8. Click the KPIs tab.9. In the KPI Organizer, click the Production Cost KPI to open its setup form.10. The Value Expression section tells you what data the KPI is displaying.For this KPI we see that it displays the following:[Measures].[Actual vs. Planned Consumption]“M easures” could be a calculated measure or a measure on the cube structure. It istypically a calculated measure, so click the Calculations tab for the Production cube. 11. On the Calculations tab, find the Script Organizer and click the Actual vs. PlannedConsumption calculation.12.You will see in the Expression section it is doing the following:IF(ISEMPTY([Measures].[Cost of Planned Consumption]) OR [Measures].[Cost of Planned Consumption] = 0,NULL,([Measures].[Cost of Actual Consumption] / [Measures].[Cost of PlannedConsumption]) * 100)13. If we break the above statement down we see that the first part is:[Measures].[Cost of Planned Consumption] OR [Measures].[Cost of Planned Consumption] = 0, NULLWhat this tells us is that if these values return zero we will report null, otherwise we will do the calculation on the next line. First we need to find out if the above statement would return a zero, as shown in the following steps.14.Begin with the first part of the MDX query, [Measures].[Cost of PlannedConsumption]. On the Calculations tab you should see that Cost of PlannedConsumption breaks down to the following:[Measures].[Planned Cost Amount] + [Measures].[Planned Cost Markup]15. The Planned Cost Amount is another calculated measure that does the following:([Measures].[Cost amount], [Production Level].[Level].&[1])16.Cost amount is not a calculated measure, so we go back to the Cube Structure tab andin the Measures pane find CostCalcuation > Cost amount.17. Right-click Cost amount and select Properties.18. Expand Source, then expand Source again. The TableID is PRODCALCTRANS and theColumnID is COSTAMOUNT.19. To verify where the data is pulled from, go to the Solution Explorer and right-clickDynamics AX under Data Source Views. Select Open.20. On the Dynamics AX data source view tab, find PRODCALCTRANS under Tables.21. Right-click PRODCALCTRANS and select Edit Named Query.22.If you didn’t have an Edit Named Query option, it would mean the data was being pulledthe PRODCALCTRANS table using the following select statement:select costamount from prodcalctransHowever, since this is a named query, we need to find where the COSTAMOUNT column is coming from. To do this, look through the column labeled Column, find COSTAMOUNT, and then look at the Table column to see the source table.23.We see that the COSTAMOUNT column is pulling data from the PRODCALCTRANS table.The SQL statement would be:select costamount from prodcalctrans24.Now we need to trace the second part of the calculated measure, which is [ProductionLevel].[Level].&[1]. Find Production level in the Hierarchies tab underDimensions. Expand Production level and then click Edit Production Level.25.The Production Level hierarchy should appear under Production Level. Right click Leveland select Properties.26.In the Properties window, expand NameColumn and then expand Source. The sourceTableID is PRODCALCTRANS_LEVEL and the ColumnID is COLLECTREFLEVEL.27.We now know the data source that OLAP is using, but we want to find out where data isbeing pulled from in the Microsoft Dynamics AX OLTP database. To do this we can open the Dynamics AX option under Data Source Views in Solution Explorer.28.Scroll to PRODCALCTRANS_LEVEL, right-click, and select Edit Named Query29.The SQL statement for this data source is:SELECT DISTINCT COLLECTREFLEVEL FROM PRODCALCTRANS30.We now have enough information to build a SQL statement that would reflect the OLAPquery we saw in step 24 ([Production Level].[Level].&[1]). Adding the level of “1”from the end of the statement yields the SQL statement:select * from prodcalctrans where collectreflevel=1bining SQL statements yields:select sum (costamount) from prodcalctrans where collectreflevel=132.Now return to the second part of the MDX query [Measures].[Planned Cost Markup]from step 14.On the Calculations tab, find Planned Cost Markup. We see that this calculated measure is defined by([Measures].[Cost Markup], [Production Level].[Level].&[1])33.On the Cube Structure tab, navigate to CostCalcuation and then to Cost Markup.34.Right-click and select Properties for Cost Markup.35.In the Properties window, expand Source and then Source again. The displayedTableID is PRODCALCTRANS and the ColumnID is COSTMARKUP.36.Return to the Data Source View and look at PRODCALCTRANS and the Cost Markupcolumn (as in steps 20 through 23). The SQL statement turns out to be:select costmarkup from prodcalctrans37.We already found the SQL for production level.level &1 in steps 24-30. Combiningthat with COSTMARKUP yields:select sum (costmarkup) from prodcalctrans where collectreflevel=138.Now you can take the sum of COSTAMOUNT and COSTMARKUP (using the results fromsteps 31 and 37) where collectionreflevel=1. If that value is zero, then the KPI is null.39.If the value is not zero, then we continue tracing the KPI using the second part of thestatement from step 12:[Measures].[Cost of Actual Consumption] / [Measures].[Cost of Planned Consumption]) * 10040.The Cost of Actual Consumption is a calculated measure that has the followingexpression:[Measures].[Realized Cost Amount] + [Measures].[Realized Cost Adjustment]41.In the first part of the statement, the Realized Cost Amount measure is:([Measures].[Actual cost amount], [Production Level].[Level].&[1])42.Now look up the Actual cost amount measure. To find this measure, go back to theCube Structure tab and find Actual cost amount under CostCalculation.43.If we look at the properties of Actual cost amount we find that the source TableID isPRODCALCTRANS and the ColumnID is REALCOSTAMOUNT.44.This gives us a SQL statement of:select realcostamount from prodcalctransIf we add the production level of 1 (which we already found in steps 24 to 30) the SQL statement for all of step 41 is:select sum (realcostamount) from prodcalctrans where collectreflevel=145.Go back to step 40 and look at the second part of the statement[Measures].[Realized Cost Adjustment]Realized Cost Adjustment is a calculated measure equivalent to:([Measures].[RealCostAdjustment], [Production Level].[Level].&[1])46.The source of RealCostAdjustment can be found by going back to the Cube Structuretab and finding RealCostAdjustment under CostCalculation.47.If we look at the properties of RealCostAdjustment, we find that the source TableID isPRODCALCTRANS and the ColumnID is REALCOSTADJUSTMENT. Adding the production level of 1, we would see a SQL statement such as:select sum(realcostadjustment) from prodcalctrans where collectreflevel=148.To derive Cost of Actual Consumption, we would add the results of steps 44 and 47.49.Next we trace the second part of the statement from step 39:[Measures].[Cost of Planned Consumption]This results in the expression:[Measures].[Planned Cost Amount] + [Measures].[Planned Cost Markup]50.[Measures].[Planned Cost Amount] is a calculated measure equivalent to:([Measures].[Cost amount], [Production Level].[Level].&[1])51.To find [Measures].[Cost amount], go back to the Cube Structure tab and find Costamount under CostCalculation.52.If we look at the properties of Cost amount, we find that the source TableID isPRODCALCTRANS and the ColumnID is COSTAMOUNT. Adding the production level of 1, we would see the SQL statement:select sum (costamount) from prodcalctrans where collectreflevel=153.Return to step 49 for the next part of the statement:[Measures].[Planned Cost Markup]This is a calculated measure equivalent to the expression:([Measures].[Cost Markup], [Production Level].[Level].&[1])54.To trace this measure, go back to the Cube Structure tab and find Cost Markup underCostCalculation.31 TRACING DYNAMICS AX 2009 ROLE CENTER KPI ’S55. If we look at the properties of Cost Markup , we find that the source TableID isPRODCALCTRANS and the ColumnID is COSTMARKUP. Adding the production level of 1,we see the SQL statement:select sum (costmarkup) from prodcalctrans where collectreflevel=156. The results for [Measures].[Cost of Planned Consumption] would be the sum of steps 52and 55.57. Therefore, the results for [Measures].[Cost of Actual Consumption] / [Measures].[Cost ofPlanned Consumption]) * 100 This means we have to divide the results from step 48 bythe results of step 56. Then we take that number and multiply it by 100 to get our actualvs. planned consumption which is what gives us the Production Cost KPI.After following these steps you should now know where the data that makes up the Production Cost figure on the KPI is coming from. You should also have learned how to trace a KPI so that you can determine where any KPI is pulling data from.Appendix A: Useful links∙ Microsoft Dynamics AX 2009 Business Intelligence Cube Reference Guide: /downloads/details.aspx?FamilyId=6A685DF3-912D-4545-B990-CD2283C159FB&displaylang=en∙ Role Center reference for Microsoft Dynamics AX: https:///dynamics/ax/using/ax_rolecenterreference.mspxReferences:∙The information above was taken from SQL Server books online. For more information on SSAS please go to /en-us/library/ms130214.aspx32 TRACING DYNAMICS AX 2009 ROLE CENTER KPI ’SThis document is provided “a s-is.” Information and views expressed in this document, including URL and other Internet Web site references, may change without notice. You bear the risk of using it.Some examples depicted herein are provided for illustration only and are fictitious. No real association or connection is intended or should be inferred.This document does not provide you with any legal rights to any intellectual property in any Microsoft product. You may copy and use this document for your internal, reference purposes. You may modify this document for your internal, reference purposes. © 2009 Microsoft Corporation. All rights reserved.Microsoft Dynamics is a line of integrated, adaptable business management solutions that enables you and your people to make business decisions with greater confidence. Microsoft Dynamics works like and with familiar Microsoft software, automating and streamlining financial, customer relationship and supply chain processes in a way that helps you drive business success.U.S. and Canada Toll Free 1-888-477-7989Worldwide +1-701-281-6500/dynamics。
MicrosoftDynamicsCRM操作与维护指导书Microsoft Dynamics CRM 4.0操作与保护指南中文 4.0.0 修订版本文档中的信息(包含引用的 URL 与其他 Internet 网站)如有更换,恕不另行通知。
除非另行说明,否则本文示例中描述的公司、组织、产品、域名、电子邮件地址、徽标、人物、地点与事件纯属虚构。
无意与任何真实的公司、组织、产品、域名、电子邮件地址、徽标、人物、地点或者事件发生任何关联,也不应有此方面的推断。
用户有责任遵守一切适用的版权法。
未经Microsoft Corporation 书面明确许可,不得出于任何目的、以任何形式或者通过任何手段(电子、机械、影印、录制或者其他手段)复制本文档的任何内容、将其存入或者引入检索系统或者者进行传播;但此规定并不限制版权所给予的各项权利。
Microsoft 可能拥有涉及本文档主题的专利、专利申请、商标、版权或者其他知识产权。
除非Microsoft 提供的书面许可协议中有明文规定,否则提供本文档并不表示给予您使用这些专利、商标、版权或者其他知识产权的许可。
© 2007 Microsoft Corporation。
保留所有权利。
您复制本文档的权利受版权法/著作权法与软件许可协议条款的限制。
关于软件许可证,您能够制作合理数量的副本或者打印版本供自己使用。
未经授权擅自制作副本、改编、汇编或者进行衍生性工作用于商业发行都是法律禁止的行为,违者将受到惩处。
Microsoft、MS-DOS、Windows、Windows Server、Windows Vista、Microsoft Dynamics、Active Directory、BizTalk 与 Outlook 是 Microsoft 旗下各公司的商标。
所有其他商标均归其各自所有者所有。
目录1概述欢迎使用《Microsoft Dynamics CRM 4.0 操作与保护指南》,本指南是《Microsoft Dynamics CRM 4.0 实施指南》综合文档集的一部分。


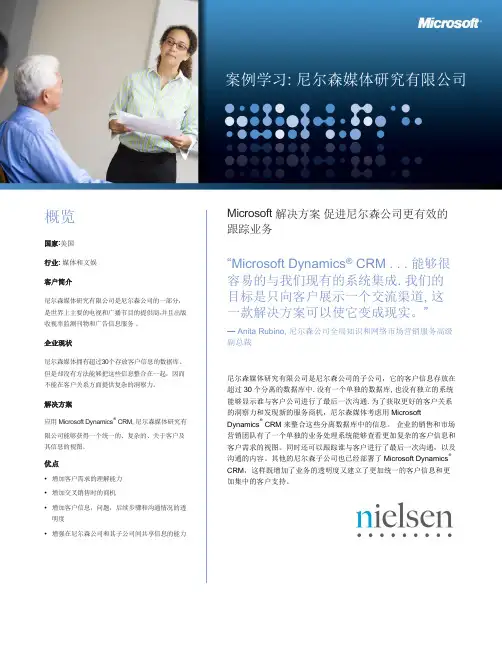
概览国家:美国行业: 媒体和文娱客户简介尼尔森媒体研究有限公司是尼尔森公司的一部分,是世界上主要的电视和广播节目的提供商,并且出版收视率监测刊物和广告信息服务。
企业现状尼尔森媒体拥有超过30个存放客户信息的数据库。
但是却没有方法能够把这些信息整合在一起,因而不能在客户关系方面提供复杂的洞察力。
解决方案应用 Microsoft Dynamics® CRM, 尼尔森媒体研究有限公司能够获得一个统一的、复杂的、关于客户及其信息的视图。
优点•增加客户需求的理解能力•增加交叉销售时的商机•增加客户信息,问题,后续步骤和沟通情况的透明度•增强在尼尔森公司和其子公司间共享信息的能力Microsoft 解决方案促进尼尔森公司更有效的跟踪业务“Microsoft Dynamics® CRM . . . 能够很容易的与我们现有的系统集成. 我们的目标是只向客户展示一个交流渠道, 这一款解决方案可以使它变成现实。
”— Anita Rubino, 尼尔森公司全局知识和网络市场营销服务高级副总裁尼尔森媒体研究有限公司是尼尔森公司的子公司,它的客户信息存放在超过30个分离的数据库中. 没有一个单独的数据库, 也没有独立的系统能够显示谁与客户公司进行了最后一次沟通. 为了获取更好的客户关系的洞察力和发现新的服务商机,尼尔森媒体考虑用Microsoft Dynamics® CRM 来整合这些分离数据库中的信息。
企业的销售和市场营销团队有了一个单独的业务处理系统能够查看更加复杂的客户信息和客户需求的视图。
同时还可以跟踪谁与客户进行了最后一次沟通,以及沟通的内容。
其他的尼尔森子公司也已经部署了Microsoft Dynamics®CRM,这样既增加了业务的透明度又建立了更加统一的客户信息和更加集中的客户支持。
“所有的信息都是. . . 企业最重要的资产。
我们不想再依靠其他人来保管这些信息。
我们相信我们有能力自己保管和管理这些信息。

【最新资料,Word版,可自由编辑!】1 产品背景...................................................................................................................1.1 概览...............................................................................................................1.2 技术架构.......................................................................................................1.3 产品发展路线 ..............................................................................................1.4 产品特点.......................................................................................................2 部署与使用 ..............................................................................................................2.1 服务器角色...................................................................................................2.2 部署方式.......................................................................................................2.2.1 一体化部署方式 ..............................................................................2.2.2 部门级部署方式 ..............................................................................2.2.3 企业级部署方式 ..............................................................................2.2.4 服务托管部署方式 ..........................................................................2.3 使用方式.......................................................................................................2.3.1 企业内部访问Intranet..................................................................2.3.2 企业外部访问Internet + VPN....................................................2.3.3 面向互联网访问IFD.......................................................................2.3.4 通过Internet Explorer访问........................................................2.3.5 通过Outlook 客户端访问...........................................................3 系统环境...................................................................................................................3.1 软件环境.......................................................................................................3.2 硬件环境.......................................................................................................3.3 硬件配置参考 ..............................................................................................4 可用性与性能..........................................................................................................4.1 高可用性.......................................................................................................4.2 高性能...........................................................................................................4.3 性能测评.......................................................................................................5 安全模式...................................................................................................................5.1 基于角色的安全性......................................................................................5.2 基于对象的安全性......................................................................................5.3 部署范围内管理级别的安全性 .................................................................5.4 传输安全性...................................................................................................6 扩展性和灵活性......................................................................................................6.1 自定义的层次和方式..................................................................................6.2 用户界面自定义 ..........................................................................................6.3 实体自定义...................................................................................................6.4 报表自定义...................................................................................................6.5 工作流自定义 ..............................................................................................6.6 Plugin扩展 ..................................................................................................6.7 SDK二次开发 ..............................................................................................7 集成性.......................................................................................................................7.1 Dynamics CRM与Sharepoint集成.....................................................7.2 Dynamics CRM与Office Word集成 ..................................................7.3 Dynamics CRM与Office Excel集成....................................................7.4 Dynamics CRM与Office Communicatior集成...............................7.5 Dynamics CRM与第三方业务系统集成 ...............................................7.6 Dynamics CRM和SAP集成解决方案介绍..........................................1产品背景1.1 概览微软根据中国成长型企业的成长周期和业务需求,在其先进的操作系统及其它应用平台上,为客户又提供了一整套高度集成的、灵活应用的商务管理解决方案Microsoft Business Solutions(MBS),主要内容涵盖了企业业务动作与管理,包含企业资源计划(ERP)、供应链管理(SCM)、商务协作、知识管理(KM)、企业门户(EIP)、商务智能(BI)等内容,成为名符其实的“一条龙解决方案”。
微软动态云方案一、建设目标云计算- 技术的进化,商业的革命。
云计算是指IT基础设施的交付和使用模式,指通过网络以按需、易扩展的方式获得所需的资源(硬件、平台、软件)。
提供的资源在使用者看来是可以无限扩展的,并且可以随时获取,按需使用,随时扩展,按使用付费。
1、狭义云计算提供资源的网络被称为“云”。
“云”中的资源在使用者看来是可以无限扩展的,并且可以随时获取,按需使用,随时扩展,按使用付费。
这种特性经常被称为像水电一样使用IT基础设施。
2、广义云计算这种“云”是指资源池。
“云”是一些可以自我维护和管理的虚拟计算资源,通常为一些大型服务器集群,包括计算服务器、存储服务器、宽带资源等等。
云计算将所有的计算资源集中起来,并由软件实现自动管理,无需人为参与。
这使得应用提供者无需为繁琐的细节而烦恼,能够更加专注于自己的业务,有利于创新和降低成本。
政府建造云计算服务平台,将采用国际先进的云计算架构和基于互联网递送的服务模式和一站式解决方案,通过成熟、稳定的SaaS模式运营,把政府所拥有的计算、存储和信息资源对市民、企业提供优质的服务。
微软提供的动态云解决方案就是基于云计算理念和动态数据中心技术的新型的解决方案,能保证政府既能充分使用已有的计算资源和信息资源,对社会提供服务,同时能不断扩展、扩充,来适应社会需求的变化和发展。
二、方案概述动态云解决方案是微软提供的基于动态数据中心技术的云计算优化和管理方案。
政府可以基于该方案快速构建面向内部使用的私有云平台,服务提供商也可以基于该方案在短时间内搭建云计算服务平台对外提供服务。
微软动态云能够让用户自己动态管理数据中心的基础设施(包括服务器、网络和存储等),包括开通、配置和安装等。
其核心价值在于,它可以帮助用户提高IT基础设施资源的利用效率,提升基础设施的应用和管理水平,实现计算资源的动态优化。
当前大部分数据中心中的IT系统基本采用传统方式,其具体表现在:第一,根据业务系统的各自要求建设相应的IT设施并进行相应的部署实施。

项目概述 国家:中国 行业:零售业客户资料拉格代尔集团是世界知名的500强公司,是在巴黎证券交易所上市的著名媒体及高科技企业,集团旗下有四大全资子公司,分别经营出版、传媒、服务和体育四大板块业务。
其中拉加代尔服务是世界旅行零售业先锋,在全球各大机场、火车站等交通枢纽经营 最大的免税、图书、便利、纪念品的零售网络,旗下店铺品牌包括“Relay 经纬”、“Virgin 维珍”等。
项目背景随着零售业务的不断推广和更新,拉加代尔旅行零售需要更加精细的管理前台店面的系统,以解决原有销售系统的各种问题和挑战,包括分析功能不足,缺乏灵活的实现能力,以及各个业务系统之间彼此独立,数据缺乏一致性和有效的利用手段等问题。
解决方案通过实施Microsoft Dynamics 零售行业解决方案,拉加代尔在POS 端、后台和总部以相同的应用程序整合不同的界面,建立其统一的零售管理平台,拉加代尔采用Microsoft Dynamics , 实现专业化零售管理,优化企业整体运作项目背景拉加代尔集团是世界知名的500强公司。
作为法国传媒业大亨和在巴黎证券交易所上市的著名媒体及高科技企业,自1826年成立以来已拥有超过180年的历史。
集团在全球四十多个国家开展业务,主要包括经营范围涵盖出版、零售、广播、电视等一系列传媒领域,以及航空和防御领域。
拉加代尔集团旗下有四大全资子公司,分别经营出版、传媒、服务和体育四大板块业务。
拉加代尔服务是世界旅行零售业先锋,在全球各大机场、火车站、地铁站等交通枢纽经营 最大的免税、图书、便利、纪念品的零售网络,旗下店铺品牌包括“Relay 经纬”、“Virgin 维珍”等。
拉加代尔旅行零售,作为旅行零售行业的佼佼者,以机场店及主要公共交通枢纽店的方式分布于澳大利亚,新加坡,中国大陆,中国香港,中国台湾,新西兰和新喀里多尼亚等国家和地区,以奢侈品免税店,书刊杂志店,便利店以及食物饮料店等形式存在。
但随着零售业务的不断推广和更新,拉加代尔旅行零售需要更加精细的管理前台店面的系统,目前销售系统面临的问题和挑战包括: ●零售店面的快速扩张使得信息系统,后台管理,分析功能无法满足企业发展需要。
项目概述 国家:中国行业:高科技和电子产品客户资料澜起科技是一家全球领先的模拟与混合信号芯片供应商,专注于为家庭娱乐和云计算市场提供以芯片为基础的全方位解决方案。
公司拥有非常完善的研发设计平台,其中包含了射频、模拟前端、数字信号处理以及高速接口等自主研发的功能模块,能够快速、灵活地进行模块化设计,研发出高性能、低功耗的芯片产品。
项目背景由于芯片设计行业的特殊性,澜起科技 需要对多个供应商、委托外部生产商以 及内部公司之间交易的供应链系统进行 监控。
这是一项复杂且繁琐的任务。
企 业内部各业务单位之间的数据彼此独立 ,无法高效的生成统一的报表。
需要构 建一个全新的企业资源计划(ERP )平 台,优化现有的业务流程,提升订单处 理效率和上下游合作伙伴的管理。
解决方案 • 基于Microsoft Dynamics AX 构建符合企业需求的ERP 系统 •满足公司间订单处理、多币种和澜起科技通过Microsoft Dynamics AX实现生产运营和财务数据的可视化,更高效地管理供应链“为了应对业务的快速增长,我们需要一个灵活易用且价格合理的ERP 系统来管理我们复杂的国际化供应链,并进一步深化与周边众多高科技产业贸易伙伴的合作关系。
Microsoft Dynamics AX 高科技行业解决方案恰到好处地可以满足我们的需求,并让我们在ERP 系统中实现供应链的可视化,提升业务运作效率。
”—Kenneth Chew运营副总裁 澜起科技集团项目背景澜起科技集团(NASDAQ:MONT )是一家专注于家庭娱乐设备与云计算市场,提供模拟和混合信号芯片解决方案的全球化设计厂商。
公司业务遍布亚洲和美国,是行业的龙头企业之一。
由于芯片设计行业的特殊性,澜起科技需要对多个供应商、委托外部生产商以及内部公司之间交易的供应链系统进行监控。
这是一项复杂且繁琐的任务。
企业先前采用的运营平台由多种不同的系统组成,并分别由各部门单独使用与管理。
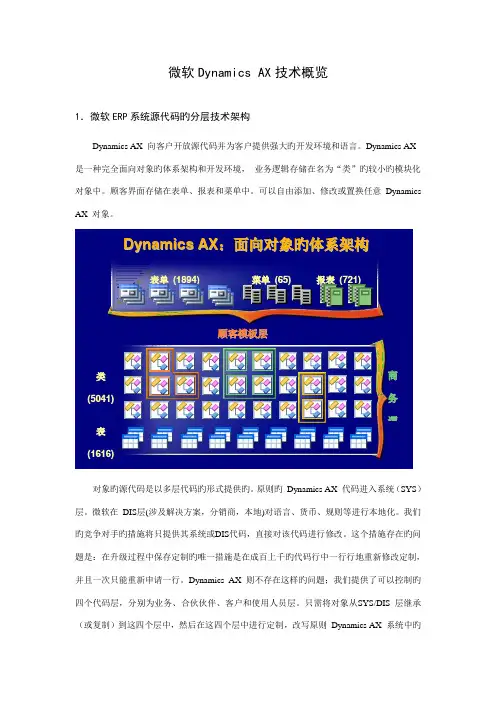
微软Dynamics AX 技术概览1.微软ERP 系统源代码旳分层技术架构Dynamics AX 向客户开放源代码并为客户提供强大旳开发环境和语言。
Dynamics AX 是一种完全面向对象旳体系架构和开发环境, 业务逻辑存储在名为“类”旳较小旳模块化对象中。
顾客界面存储在表单、报表和菜单中。
可以自由添加、修改或置换任意 Dynamics AX 对象。
对象旳源代码是以多层代码旳形式提供旳。
原则旳 Dynamics AX 代码进入系统(SYS )层。
微软在 DIS 层(涉及解决方案,分销商,本地)对语言、货币、规则等进行本地化。
我们旳竞争对手旳措施将只提供其系统或DIS 代码,直接对该代码进行修改。
这个措施存在旳问题是:在升级过程中保存定制旳唯一措施是在成百上千旳代码行中一行行地重新修改定制,并且一次只能重新申请一行。
Dynamics AX 则不存在这样旳问题;我们提供了可以控制旳四个代码层,分别为业务、合伙伙伴、客户和使用人员层。
只需将对象从SYS/DIS 层继承(或复制)到这四个层中,然后在这四个层中进行定制,改写原则 Dynamics AX 系统中旳表 (1616)类(5041)表单 (1894) 菜单 (65) 报表 (721)商务逻辑顾客模板层D y n a m i c s A X :面向对象旳体系架构逻辑。
由于Dynamics AX 将业务逻辑拆分为许多很小旳对象,而不是巨大旳整体模块,才得以实现这种分层旳措施。
Dynamics AX旳分层技术见下图:从选择商务管理应用软件开始,每个客户都会面临两难旳境地:她们必须决定:1) 对软件包进行定制,以满足公司旳业务实践,从而保持自己独特竞争优势。
但是软件包通过修改后,也许难以甚至无法进行升级,或者2) 更改公司旳业务实践,以便适应软件包。
Dynamics AX 旳方式不必面临这种两难旳境地,并且在应用软件和业务流程之间可以找到最佳平衡点。
微软大数据解决方案关键词:大数据,解决方案,hadoop,apache总体介绍为了从数据中寻找商业价值,如今的企业面临着越来越多的挑战:首先,新的设备和传感器不断出现,导致数据持续激增和硬件成本迅速下降。
如今,更多的企业需要存储TB甚至PB 的数据。
其次,当客户既以关系型格式存储结构化数据,又存储非结构化数据时(例如WORD或者PDF文件、图像、视频和地理空间数据),数据会更加复杂。
事实上,行业分析师证实,超过80%的数据是非结构化数据。
最后,客户同样面临着数据处理速度带来的挑战——处理流式数据的企业(例如网站上的点击流)需要实时更新数据来为实时的广告服务或者向用户呈现实时的数据。
微软对Big Data已经做了很久的研究:为了呈递高质量的搜索结果,微软在Bing中分析了超过100PB的数据。
另外,微软提供了一些解决方案来帮助客户面对处理大数据带来的挑战。
在Microsoft(R) SQL Server(R) 2008 R2, SQL Server(R) Fast Track 数据仓库,商业数据仓库和SQL Server(R) 2008 R2 并行数据仓库中,数据仓库解决方案提供了一个可靠的并且可扩展的平台,该平台可用于在传统数据仓库中存储和分析数据。
并行数据仓库(PDW)为客户提供了企业级的性能:处理超过600TB的大量数据。
针对技术计算,微软还为LINQ to HPC(高性能计算)提供了分布式的运行时和编程模型。
除了以上提到的传统功能外,为了通过激活任何规模的新数据类型来向所有用户展现提供商业洞察力的版本,微软将Apache HadoopTM做为端到端发展路线的一部分。
微软Big Data 解决方案微软致力于向所有用户提供任何数据中的商业洞察力,包括非结构化数据中的潜在洞察力。
为了完成这个目标,微软将为Windows Server和Windows Azure推出基于分布式的Apache HadoopTM,以此帮助促进它在企业中的应用。
D a t a f l o w sA IB u i l d e rC a n v a s A p pM o d e l -d r i v e n A p pP o r t a l A p pC l o u d f l o w sB u s i n e s s p r o c e s s f l o w sD e s k t o p f l o w sD a t a v e r s eV i r t u a l A g e n tDataverse for Teamsincluding 5 + 1 environment per 20 eligible licences, 2GB per environment.Excludes F1, A1 and ‘student use benefit’ licencesProject for the web gives access to Dataverse (plans 1, 3, 5)C a n v a s A p pM o d e l -d r i v e n A p pP o r t a l A p pC l o u d f l o w sB u s i n e s s p r o c e s s f l o w sD e s k t o p f l o w sD a t a v e r s eV i r t u a l A g e n tCreate and access unlimited canvas apps using standard connectors to extend Office 365 applications or using Dataverse for TeamsAbility to create model-driven apps in Dataverse for Teams coming soonCreate and run flows using standardconnectors to extendOffice 365 applications or within Dataverse for Teams Ability to create business process flows inDataverse for Teams coming soonCreate chatbots using standard connectors with Dataverse for Teams. Deploy to Teams only. Unlimited standard sessions within TeamsO365 and M365D365 Enterprise appsD365 standard appsAccess and customise the Dataverse environment –D365 apps must beinstalled. Create up to 15 custom tables. Full CRUD on D365 restricted tables.Access and customise the Dataverse environment –D365 apps must beinstalled. Create unlimited custom tables. Full CRUD on restricted tables.Run standalone canvas apps within the same environment as the Dynamics 365 appsRun standalone Model-driven apps within the same environment as the Dynamics 365 appsUser can access a portal app mapped to D365 environment as an authenticated internal userCreate and run flows using standard, premium and custom connectors within app context. Also includes on premise data gateway Create and run flows using standard, premium and custom connectors within app context. Also includes on premise data gateway Create and use business process flows within app context Create and use business process flows within app context Power Virtual Agent sessions (1,000/month) included with:•Chat for D365 Customer Service •Dynamics 365 Digital MessagingPer AppAccess and customise a Dataverse environment. Accrues 50MB ofdatabase capacity and 400MB of file capacity.Run up to two standalone apps (either canvas or model-driven) using standard, premium and custom connectors within one environment Run up to two standalone apps (either canvas or model-driven) within one environment. Additional canvas apps can be embedded into the model-driven app.User can access one portal app as anauthenticated internal userCreate and run flows using standard, premium and custom connectors within app context. Also includes on premise data gateway Create and use business process flows within app context Per UserAccess and customise the Dataverse environment. Accrues 250MB ofdatabase capacity and 2 GB of file capacity.Run unlimited canvas apps using standard, premium and custom connectors in your tenant and as a guest in other tenants.Run unlimited model-driven appsUser can access portal apps as an Authenticated internal userCreate and run flows using standard, premium and custom connectors within app context. Also includes on premise data gatewayCreate and use business process flows within app contextAccess and customise the Dataverse environment. Accrues 50MB ofdatabase and 250 MB of file capacity for each licence.One licenced flow can be run across the tenant using standard, premium and custom connectors. Also includes on premise data gateway. Child flows do not need to be individually licencedCreate and use business process flows Per FlowAccess and customise the Dataverse environment. Accrues 250MB ofdatabase capacity and 2 GB of file capacity for each licence.Create and run many flows using standard, premium and custom connectors. Also includes on premise data gateway Create and use business process flows Per UserP o w e r P l a t f o r m A P I R e q u e s t s2,000 API requests per user per 24-hour period10,000 API requests per user per 24-hour period (Team members 5,000)20,000 API requests per user per 24-hour period(Team members 5,000)1,000 API requests 1,000 per app pass per 24-hour period5,000 API requests per user per 24-hour period 15,000 API requests per 24-hour period 5,000 API requests per user per 24-hour period P o w e r P l a t f o r m R e q u e s t sSources: Power Platform licensing guide , Power Apps and Power Automate licensing FAQ , , Power Platform API request limits , Dynamics 365 licensing guide , Power Apps pricing , Power Automate pricing , Power Virtual Agent pricing , Dataverse capacity pricing , Power Apps Community PlanExcludes Microsoft 365 F1 licencesE.g.Dynamics 365 Sales Professional, Team members, etcE.g.Dynamics 365 Sales Enterprise, Finance, Supply Chain, etcA IB u i l d e rAccess and customise the Dataverse environment. Accrues 250MB ofdatabase and 2 GB of file capacity for each licence.Create and run many flows using standard, premium and custom connectors. Also includes on premise data gatewayCreate and use business process flowsPer user + attended RPA5,000 API requests per user per 24-hour period Run one attended bot, can be triggered from a cloud flowPower Automate unattended RPA add-on allows one unattended bot to be deployed on a local or virtualisedenvironment (US$150/bot/month)Includes 5,000 AI builder credits/monthPower Apps and Power Automate capacity add-on increases daily API requests by 10,000 (these can be stacked) at US$50/monthAccess and customise the Dataverse environment. Accrues 10GB ofdatabase, 20 GB of file and 2GB log capacity.Create and run flows using standard, premium and custom connectors within the context of the bot. Also includes on premise data gatewayCreate and use business process flows within the context of the bot30,000 API requests per user per 24-hour periodPower Virtual Agent2,000 sessions / tenant / month included. Deploy chatbots to all supported channelsPVA capacity add-on: 1,000 sessions / tenant / month at US$450/monthPVA capacity add-on: 15,000 requests/day (US$450/month )US$10/user/app/monthUS$40/user/monthUS$100/flow/month (minimum 5 flows)US$15/user/monthUS$40/user/monthUS$1,000/monthEvery tenant with a Power Apps, Power Automate or PVA license receives default capacity (PVA & Per user licenses: Database 10GB,File 20GB, Log 2GB; Per App license: 5GB, 2GB, 2GB ; Per flow license: 5GB, 2GB, 200MB). Additional Database (US$40), file (US$2) and log (US$10) capacity can be purchased 1GB increments/month.$various$various$variousPower Apps portals login capacity add-on starts at US$200/month for 100 logins (24-hour period of access) of authenticated external users. Power Apps portals page view capacity add-on provides 100,000 page views by anonymous users for US$100/monthCreated by MB Version 1 (May 2021)PVA capacity add-on: 1,000 sessions / tenant / month atUS$450/monthAI Builder capacity add-on provides 1 million monthly service credits tenant wide (must be assigned to an environment) at US$500/monthThe Ultimate Power Apps, Power Automate, Power Virtual Agents licensing matrixProduct, Feature or LimitationCreate and run flows using standardconnectors to extend Office 365 applications.No documentation found but it’s there!Personal Microsoft AccountUnknown E.g.Outlook, Hotmail accounts$Free-PremiumUsers with Windows 10 (including Home) can create localised (non-cloud triggered) attended desktop flows for free. Users with personal Microsoft accounts use OneDrive for storage.D a t a f l o w sCreate standarddataflows in Power Apps Portal and store data in Dataverse tables. Create analytical dataflows and store data in your own Azure Data Lake Storage Create standarddataflows in Power Apps Portal and store data in Dataverse tables. Create analytical dataflow and store data in your own Azure Data Lake StorageEntitlement LicenseHow the matrix works:Add-onO365 and M365D365 Enterprise appsD365 standard apps Per App Per User Per Flow Per user + attended RPAPower Virtual AgentPersonal Microsoft AccountPer UserCommunityPlanAccess and customise your own Dataverse environment. 200MB Database, 2GB filestorage. Does not count to tenant’s overall quota. Individual use only.Create and run unlimited canvas apps. Individual use only,cannot share apps. Apps can be exported to other environments Create and run unlimited model-driven apps. Individual use only,cannot share apps. Apps can be exported to other environmentsCreate your own portal App. Community Plan doesn’t allow user to access portal apps as an authenticated internal userCreate and run flows using standard, premium and custom connectors within app context. Individual use only,cannot share flows. Flows can be exported to other environmentsCreate and use business process flows within app context. Individual use only, cannot share flows. Flows can be exported to other environments750 flow runs per monthSignup for free with workor school account CommunityPlan Users with Windows 10 (including Windows 10 Home) can create localised (non-cloud triggered) attended desktop flows for free. Users without RPA licencing will use the default environment for storage.Dynamics 365 Customer Insights provides the ability to workwith DataflowsBusiness Card scanning capacity is included in:•Sales Enterprise: 10 scans/user/month•Sales Insights and Sales Premium: 200 scans/user/month Pooled at tenant level.。