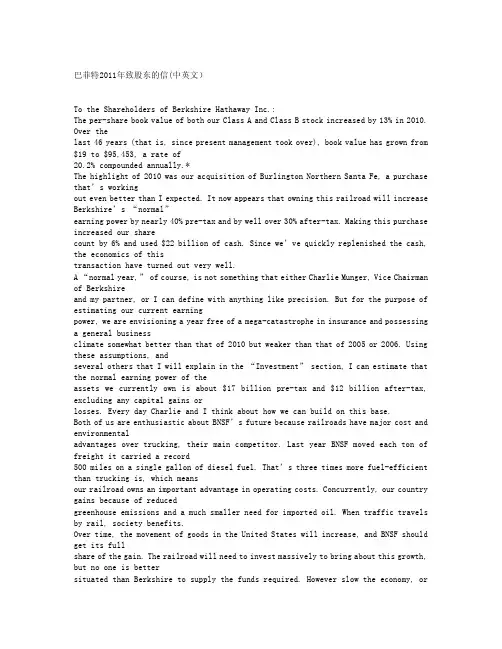
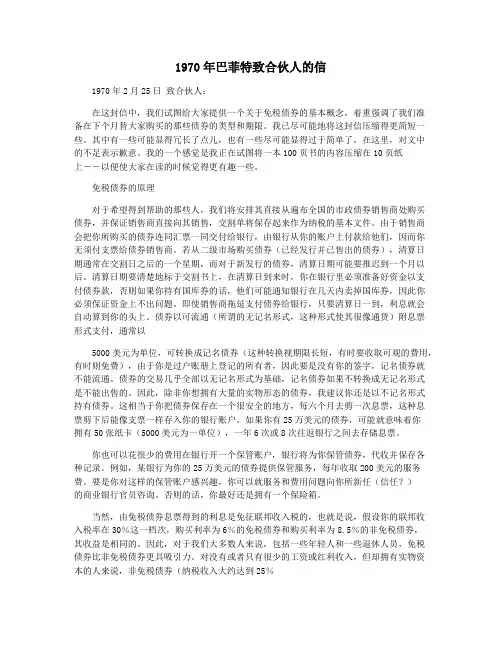
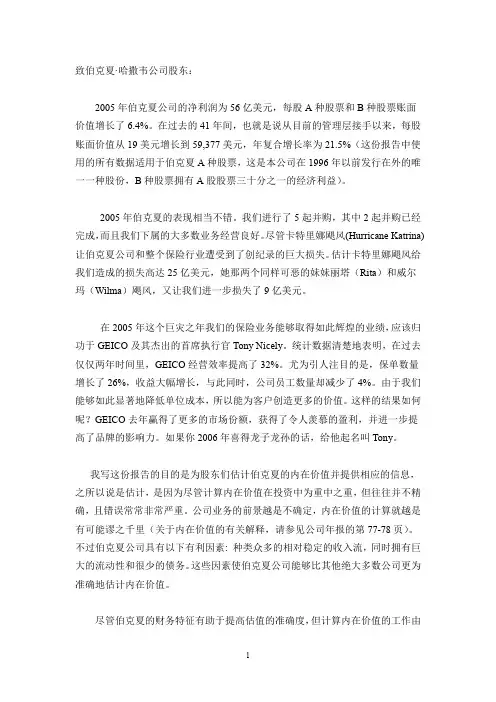
巴菲特2011年致股东的信(中英文)To the Shareholders of Berkshire Hathaway Inc.:The per-share book value of both our Class A and Class B stock increased by13%in2010. Over thelast46years(that is,since present management took over),book value has grown from $19to$95,453,a rate of20.2%compounded annually.*The highlight of2010was our acquisition of Burlington Northern Santa Fe,a purchase that’s workingout even better than I expected.It now appears that owning this railroad will increase Berkshire’s“normal”earning power by nearly40%pre-tax and by well over30%after-tax.Making this purchase increased our sharecount by6%and used$22billion of cash.Since we’ve quickly replenished the cash, the economics of thistransaction have turned out very well.A“normal year,”of course,is not something that either Charlie Munger,Vice Chairman of Berkshireand my partner,or I can define with anything like precision.But for the purpose of estimating our current earningpower,we are envisioning a year free of a mega-catastrophe in insurance and possessing a general businessclimate somewhat better than that of2010but weaker than that ing these assumptions,andseveral others that I will explain in the“Investment”section,I can estimate that the normal earning power of theassets we currently own is about$17billion pre-tax and$12billion after-tax, excluding any capital gains orlosses.Every day Charlie and I think about how we can build on this base.Both of us are enthusiastic about BNSF’s future because railroads have major cost and environmentaladvantages over trucking,their main st year BNSF moved each ton of freight it carried a record500miles on a single gallon of diesel fuel.That’s three times more fuel-efficient than trucking is,which meansour railroad owns an important advantage in operating costs.Concurrently,our country gains because of reducedgreenhouse emissions and a much smaller need for imported oil.When traffic travels by rail,society benefits.Over time,the movement of goods in the United States will increase,and BNSF should get its fullshare of the gain.The railroad will need to invest massively to bring about this growth, but no one is bettersituated than Berkshire to supply the funds required.However slow the economy,orchaotic the markets,ourchecks will clear.Last year–in the face of widespread pessimism about our economy–we demonstrated our enthusiasmfor capital investment at Berkshire by spending$6billion on property and equipment. Of this amount,$5.4billion–or90%of the total–was spent in the United States.Certainly our businesses will expand abroad inthe future,but an overwhelming part of their future investments will be at home.In 2011,we will set a newrecord for capital spending–$8billion–and spend all of the$2billion increase in the United States.Money will always flow toward opportunity,and there is an abundance of that in America. Commentators today often talk of“great uncertainty.”But think back,for example, to December6,1941,October18,1987and September10,2001.No matter how serene today may be, tomorrow is alwaysuncertain.*All per-share figures used in this report apply to Berkshire’s A shares.Figures for the B shares are1/1500th of those shown for A.3Don’t let that reality spook you.Throughout my lifetime,politicians and pundits have constantlymoaned about terrifying problems facing America.Yet our citizens now live an astonishing six times better thanwhen I was born.The prophets of doom have overlooked the all-important factor that is certain:Human potentialis far from exhausted,and the American system for unleashing that potential–a system that has worked wondersfor over two centuries despite frequent interruptions for recessions and even a Civil War–remains alive andeffective.We are not natively smarter than we were when our country was founded nor do we work harder.Butlook around you and see a world beyond the dreams of any colonial citizen.Now,as in 1776,1861,1932and1941,America’s best days lie ahead.PerformanceCharlie and I believe that those entrusted with handling the funds of others should establishperformance goals at the onset of their cking such standards, managements are tempted to shootthe arrow of performance and then paint the bull’s-eye around wherever it lands. In Berkshire’s case,we long ago told you that our job is to increase per-share intrinsic value at a rategreater than the increase(including dividends)of the S&P500.In some years we succeed;in others we fail.But,if we are unable over time to reach that goal,we have done nothing for our investors, who by themselves couldhave realized an equal or better result by owning an index fund.The challenge,of course,is the calculation of intrinsic value.Present that task to Charlie and meseparately,and you will get two different answers.Precision just isn’t possible. To eliminate subjectivity,we therefore use an understated proxy for intrinsic-value–book value–when measuring our performance.To be sure,some of our businesses are worth far more than their carryingvalue on our books.(Later in this report,we’ll present a case study.)But since that premium seldom swingswildly from year to year,book value can serve as a reasonable device for tracking how we are doing.The table on page2shows our46-year record against the S&P,a performance quite good in the earlieryears and now only satisfactory.The bountiful years,we want to emphasize,will never return.The huge sums ofcapital we currently manage eliminate any chance of exceptional performance.We will strive,however,forbetter-than-average results and feel it fair for you to hold us to that standard. Yearly figures,it should be noted,are neither to be ignored nor viewed as all-important. The pace ofthe earth’s movement around the sun is not synchronized with the time required for either investment ideas oroperating decisions to bear fruit.At GEICO,for example,we enthusiastically spent $900million last year onadvertising to obtain policyholders who deliver us no immediate profits.If we could spend twice that amountproductively,we would happily do so though short-term results would be further penalized.Many largeinvestments at our railroad and utility operations are also made with an eye to payoffs well down the road.To provide you a longer-term perspective on performance,we present on the facing page the yearlyfigures from page2recast into a series of five-year periods.Overall,there are42 of these periods,and they tellan interesting story.On a comparative basis,our best years ended in the early1980s. The market’s golden period,however,came in the17following years,with Berkshire achieving stellar absolute returns even as our relativeadvantage narrowed.After1999,the market stalled(or have you already noticed that?).Consequently,the satisfactoryperformance relative to the S&P that Berkshire has achieved since then has delivered only moderate absoluteresults.Looking forward,we hope to average several points better than the S&P–though that result is,ofcourse,far from a sure thing.If we succeed in that aim,we will almost certainly produce better relative results inbad years for the stock market and suffer poorer results in strong markets.4Berkshire’s Corporate Performance vs.the S&P500by Five-Year PeriodsAnnual Percentage ChangeFive-Year Periodin Per-ShareBook Value ofBerkshire(1)in S&P500with DividendsIncluded(2)RelativeResults(1)-(2)1965-1969..................................... ..........17.2 5.012.21966-1970..................................... ..........14.7 3.910.81967-1971..................................... ..........13.99.2 4.71968-1972..................................... ..........16.87.59.31969-1973..................................... ..........17.7 2.015.71970-1974..................................... ..........15.0(2.4)17.41971-1975..................................... ..........13.9 3.210.71972-1976..................................... ..........20.8 4.915.91973-1977..................................... ..........23.4(0.2)23.61974-1978..................................... ..........24.4 4.320.11975-1979..................................... ..........30.114.715.41976-1980..................................... ..........33.413.919.51977-1981..................................... ..........29.08.120.91978-1982..................................... ..........29.914.115.81979-1983..................................... ..........31.617.314.31980-1984..................................... ..........27.014.812.21981-1985..................................... ..........32.614.618.01982-1986..................................... ..........31.519.811.71983-1987..................................... ..........27.416.411.01984-1988..................................... ..........25.015.29.81985-1989..................................... ..........31.120.310.81986-1990..................................... ..........22.913.19.81987-1991..................................... ..........25.415.310.11988-1992..................................... ..........25.615.89.81989-1993..................................... ..........24.414.59.91990-1994..................................... ..........18.68.79.91991-1995..................................... ..........25.616.59.11992-1996..................................... ..........24.215.29.01993-1997..................................... ..........26.920.2 6.71994-1998..................................... ..........33.724.09.71995-1999..................................... ..........30.428.5 1.91996-2000..................................... ..........22.918.3 4.61997-2001..................................... ..........14.810.7 4.11998-2002..................................... ..........10.4(0.6)11.01999-2003..................................... .......... 6.0(0.6) 6.62000-2004..................................... ..........8.0(2.3)10.32001-2005...............................................8.00.67.42002-2006..................................... ..........13.1 6.2 6.92003-2007..................................... ..........13.312.80.52004-2008..................................... .......... 6.9(2.2)9.12005-2009..................................... ..........8.60.48.22006-2010..................................... ..........10.0 2.37.7Notes:The first two periods cover the five years beginning September30of the previous year.The third period covers63months beginning September30,1966to December31,1971.All other periods involve calendar years.The other notes on page2also apply to this table.5Intrinsic Value–Today and TomorrowThough Berkshire’s intrinsic value cannot be precisely calculated,two of its three key pillars can bemeasured.Charlie and I rely heavily on these measurements when we make our own estimates of Berkshire’svalue.The first component of value is our investments:stocks,bonds and cash equivalents. At yearend thesetotaled$158billion at market value.Insurance float–money we temporarily hold in our insurance operations that does not belong to us–funds$66billion of our investments.This float is“free”as long as insurance underwriting breaks even,meaningthat the premiums we receive equal the losses and expenses we incur.Of course, underwriting results are volatile,swinging erratically between profits and losses.Over our entire history,though, we’ve been significantlyprofitable,and I also expect us to average breakeven results or better in the future. If we do that,all of ourinvestments–those funded both by float and by retained earnings–can be viewed as an element of value forBerkshire shareholders.Berkshire’s second component of value is earnings that come from sources other than investments andinsurance underwriting.These earnings are delivered by our68non-insurance companies, itemized on page106.In Berkshire’s early years,we focused on the investment side.During the past two decades,however,we’veincreasingly emphasized the development of earnings from non-insurance businesses,a practice that willcontinue.The following tables illustrate this shift.In the first table,we present per-share investments at decadeintervals beginning in1970,three years after we entered the insurance business.We exclude those investmentsapplicable to minority interests.YearendPer-ShareInvestments PeriodCompounded Annual Increasein Per-Share Investments1970...................$66 1980...................7541970-198027.5% 1990...................7,7981980-199026.3% 2000...................50,2291990-200020.5% 2010...................94,7302000-2010 6.6%Though our compounded annual increase in per-share investments was a healthy19.9%over the40-year period,our rate of increase has slowed sharply as we have focused on using funds to buy operatingbusinesses.The payoff from this shift is shown in the following table,which illustrates how earnings of ournon-insurance businesses have increased,again on a per-share basis and after applicable minority interests.YearPer-SharePre-Tax Earnings PeriodCompounded Annual Increase inPer-Share Pre-Tax Earnings1970............$ 2.871980............19.011970-198020.8%1990............102.581980-199018.4%2000............918.661990-200024.5%2010............5,926.042000-201020.5%6For the forty years,our compounded annual gain in pre-tax,non-insurance earnings per share is21.0%.During the same period,Berkshire’s stock price increased at a rate of22.1%annually. Over time,you can expectour stock price to move in rough tandem with Berkshire’s investments and earnings. Market price and intrinsicvalue often follow very different paths–sometimes for extended periods–but eventually they meet.There is a third,more subjective,element to an intrinsic value calculation that can be either positive ornegative:the efficacy with which retained earnings will be deployed in the future.We,as well as many otherbusinesses,are likely to retain earnings over the next decade that will equal,or even exceed,the capital we presentlyemploy.Some companies will turn these retained dollars into fifty-cent pieces,others into two-dollar bills.This“what-will-they-do-with-the-money”factor must always be evaluated along with the“what-do-we-have-now”calculation in order for us,or anybody,to arrive at a sensible estimate of a company’sintrinsic value.That’s because an outside investor stands by helplessly as management reinvests his share of thecompany’s earnings.If a CEO can be expected to do this job well,the reinvestment prospects add to thecompany’s current value;if the CEO’s talents or motives are suspect,today’s value must be discounted.Thedifference in outcome can be huge.A dollar of then-value in the hands of Sears Roebuck’s or MontgomeryWard’s CEOs in the late1960s had a far different destiny than did a dollar entrusted to Sam Walton.************Charlie and I hope that the per-share earnings of our non-insurance businesses continue to increase at adecent rate.But the job gets tougher as the numbers get larger.We will need both good performance from ourcurrent businesses and more major acquisitions.We’re prepared.Our elephant gun has been reloaded,and mytrigger finger is itchy.Partially offsetting our anchor of size are several important advantages we have.First, we possess acadre of truly skilled managers who have an unusual commitment to their own operations and to Berkshire.Many of our CEOs are independently wealthy and work only because they love what they do.They arevolunteers,not mercenaries.Because no one can offer them a job they would enjoy more, they can’t be luredaway.At Berkshire,managers can focus on running their businesses:They are not subjected to meetings atheadquarters nor financing worries nor Wall Street harassment.They simply get a letter from me every two years(it’s reproduced on pages104-105)and call me when they wish.And their wishes do differ:There are managersto whom I have not talked in the last year,while there is one with whom I talk almost daily.Our trust is in peoplerather than process.A“hire well,manage little”code suits both them and me. Berkshire’s CEOs come in many forms.Some have MBAs;others never finished college. Some usebudgets and are by-the-book types;others operate by the seat of their pants.Our team resembles a baseball squadcomposed of all-stars having vastly different batting styles.Changes in our line-up are seldom required.Our second advantage relates to the allocation of the money our businesses earn.After meeting theneeds of those businesses,we have very substantial sums left over.Most companies limit themselves toreinvesting funds within the industry in which they have been operating.That often restricts them,however,to a“universe”for capital allocation that is both tiny and quite inferior to what is available in the wider world.Competition for the few opportunities that are available tends to become fierce.The seller has the upper hand,asa girl might if she were the only female at a party attended by many boys.That lopsided situation would be greatfor the girl,but terrible for the boys.At Berkshire we face no institutional restraints when we deploy capital.Charlie and I are limited onlyby our ability to understand the likely future of a possible acquisition.If we clear that hurdle–and frequently wecan’t–we are then able to compare any one opportunity against a host of others. 7When I took control of Berkshire in1965,I didn’t exploit this advantage.Berkshire was then only intextiles,where it had in the previous decade lost significant money.The dumbest thing I could have done was topursue“opportunities”to improve and expand the existing textile operation–so for years that’s exactly what Idid.And then,in a final burst of brilliance,I went out and bought another textile company.Aaaaaaargh!Eventually I came to my senses,heading first into insurance and then into other industries.There is even a supplement to this world-is-our-oyster advantage:In addition to evaluating theattractions of one business against a host of others,we also measure businesses against opportunities available inmarketable securities,a comparison most managements don’t make.Often,businesses are priced ridiculouslyhigh against what can likely be earned from investments in stocks or bonds.At such moments,we buy securitiesand bide our time.Our flexibility in respect to capital allocation has accounted for much of our progress to date.We havebeen able to take money we earn from,say,See’s Candies or Business Wire(two of our best-run businesses,butalso two offering limited reinvestment opportunities)and use it as part of the stakewe needed to buy BNSF.Our final advantage is the hard-to-duplicate culture that permeates Berkshire.And in businesses,culture counts.To start with,the directors who represent you think and act like owners.They receive tokencompensation:no options,no restricted stock and,for that matter,virtually no cash. We do not provide themdirectors and officers liability insurance,a given at almost every other large public company.If they mess upwith your money,they will lose their money as well.Leaving my holdings aside,directors and their families ownBerkshire shares worth more than$3billion.Our directors,therefore,monitor Berkshire’s actions and resultswith keen interest and an owner’s eye.You and I are lucky to have them as stewards. This same owner-orientation prevails among our managers.In many cases,these are people who havesought out Berkshire as an acquirer for a business that they and their families have long owned.They came to uswith an owner’s mindset,and we provide an environment that encourages them to retain it.Having managerswho love their businesses is no small advantage.Cultures self-propagate.Winston Churchill once said,“You shape your houses and then they shapeyou.”That wisdom applies to businesses as well.Bureaucratic procedures beget more bureaucracy,and imperialcorporate palaces induce imperious behavior.(As one wag put it,“You know you’re no longer CEO when youget in the back seat of your car and it doesn’t move.”)At Berkshire’s“World Headquarters”our annual rent is$270,212.Moreover,the home-office investment in furniture,art,Coke dispenser,lunch room,high-techequipment–you name it–totals$301,363.As long as Charlie and I treat your money as if it were our own,Berkshire’s managers are likely to be careful with it as well.Our compensation programs,our annual meeting and even our annual reports are all designed with aneye to reinforcing the Berkshire culture,and making it one that will repel and expel managers of a different bent.This culture grows stronger every year,and it will remain intact long after Charlie and I have left the scene.We will need all of the strengths I’ve just described to do reasonably well.Our managers will deliver;you can count on that.But whether Charlie and I can hold up our end in capital allocation depends in part on thecompetitive environment for acquisitions.You will get our best efforts.GEICONow let me tell you a story that will help you understand how the intrinsic value of a business can farexceed its book value.Relating this tale also gives me a chance to relive some great memories.Sixty years ago last month,GEICO entered my life,destined to shape it in a huge way.I was then a20-year-old graduate student at Columbia,having elected to go there because my hero, Ben Graham,taught aonce-a-week class at the school.8One day at the library,I checked out Ben’s entry in Who’s Who in America and found he waschairman of Government Employees Insurance Co.(now called GEICO).I knew nothing of insurance and hadnever heard of the company.The librarian,however,steered me to a large compendium of insurers and,afterreading the page on GEICO,I decided to visit the company.The following Saturday,I boarded an early train forWashington.Alas,when I arrived at the company’s headquarters,the building was closed.I then rather franticallystarted pounding on a door,until finally a janitor appeared.I asked him if there was anyone in the office I couldtalk to,and he steered me to the only person around,Lorimer Davidson.That was my lucky moment.During the next four hours,“Davy”gave me an education about bothinsurance and GEICO.It was the beginning of a wonderful friendship.Soon thereafter, I graduated fromColumbia and became a stock salesman in Omaha.GEICO,of course,was my prime recommendation,which gotme off to a great start with dozens of customers.GEICO also jump-started my net worth because,soon aftermeeting Davy,I made the stock75%of my$9,800investment portfolio.(Even so,I felt over-diversified.)Subsequently,Davy became CEO of GEICO,taking the company to undreamed-of heights before it gotinto trouble in the mid-1970s,a few years after his retirement.When that happened–with the stock falling bymore than95%–Berkshire bought about one-third of the company in the market,a position that over the yearsincreased to50%because of GEICO’s repurchases of its own shares.Berkshire’s cost for this half of the businesswas$46million.(Despite the size of our position,we exercised no control over operations.)We then purchased the remaining50%of GEICO at the beginning of1996,which spurred Davy,at95,to make a video tape saying how happy he was that his beloved GEICO would permanentlyreside withBerkshire.(He also playfully concluded with,“Next time,Warren,please make an appointment.”)A lot has happened at GEICO during the last60years,but its core goal–saving Americans substantialmoney on their purchase of auto insurance–remains unchanged.(Try us at 1-800-847-7536or.)In other words,get the policyholder’s business by deserving his business.Focusing on thisobjective,the company has grown to be America’s third-largest auto insurer,with a market share of8.8%.When Tony Nicely,GEICO’s CEO,took over in1993,that share was2.0%,a level at which it hadbeen stuck for more than a decade.GEICO became a different company under Tony,finding a path to consistentgrowth while simultaneously maintaining underwriting discipline and keeping its costs low.Let me quantify Tony’s achievement.When,in1996,we bought the50%of GEICO we didn’t alreadyown,it cost us about$2.3billion.That price implied a value of$4.6billion for100%. GEICO then had tangiblenet worth of$1.9billion.The excess over tangible net worth of the implied value–$2.7billion–was what we estimatedGEICO’s“goodwill”to be worth at that time.That goodwill represented the economic value of the policyholderswho were then doing business with GEICO.In1995,those customers had paid the company $2.8billion inpremiums.Consequently,we were valuing GEICO’s customers at about97%(2.7/2.8)of what they wereannually paying the company.By industry standards,that was a very high price.But GEICO was no ordinaryinsurer:Because of the company’s low costs,its policyholders were consistently profitable and unusually loyal.Today,premium volume is$14.3billion and growing.Yet we carry the goodwill of GEICO on ourbooks at only$1.4billion,an amount that will remain unchanged no matter how much the value of GEICOincreases.(Under accounting rules,you write down the carrying value of goodwill if its economic valuedecreases,but leave it unchanged if economic value increases.)Using the 97%-of-premium-volume yardstick weapplied to our1996purchase,the real value today of GEICO’s economic goodwill is about$14billion.And thisvalue is likely to be much higher ten and twenty years from now.GEICO–off to a strong start in2011–is thegift that keeps giving.9One not-so-small footnote:Under Tony,GEICO has developed one of the country’s largest personallinesinsurance agencies,which primarily sells homeowners policies to our GEICO auto insurance customers.Inthis business,we represent a number of insurers that are not affiliated with us.They take the risk;we simply signup the st year we sold769,898new policies at this agency operation,up 34%from the year before.The obvious way this activity aids us is that it produces commission revenue;equally important is the fact that itfurther strengthens our relationship with our policyholders,helping us retain them.I owe an enormous debt to Tony and Davy(and,come to think of it,to that janitor as well).************Now,let’s examine the four major sectors of Berkshire.Each has vastly different balance sheet andincome characteristics from the others.Lumping them together therefore impedes analysis.So we’ll present themas four separate businesses,which is how Charlie and I view them.We will look first at insurance,Berkshire’s core operation and the engine that has propelled ourexpansion over the years.InsuranceProperty-casualty(“P/C”)insurers receive premiums upfront and pay claims later. In extreme cases,such as those arising from certain workers’compensation accidents,payments can stretch over decades.Thiscollect-now,pay-later model leaves us holding large sums–money we call “float”–that will eventually go toothers.Meanwhile,we get to invest this float for Berkshire’s benefit.Though individual policies and claimscome and go,the amount of float we hold remains remarkably stable in relation to premium volume.Consequently,as our business grows,so does our float.And how we have grown:Just take a look at thefollowing table:YearendFloat(in$millions) 1970........................................ $39 1980........................................ 237 1990........................................ 1,632 2000........................................。