曼昆《宏观经济学》第2章--宏观经济学的数据
- 格式:ppt
- 大小:1.33 MB
- 文档页数:25


曼昆中级宏观经济学课后答案【篇一:曼昆宏观经济学-课后答案第6、7版】txt>复习题1、由于整个经济的事件产生于许多家庭与许多企业的相互作用,所以微观经济学和宏观经济学必然是相互关联的。
当我们研究整个经济时,我们必须考虑个别经济行为者的决策。
由于总量只是描述许多个别决策的变量的总和,所以宏观经济理论必然依靠微观经济基础。
2、经济学家是用模型来解释世界,但一个经济学家的模型往往是由符号和方程式构成。
经济学家建立模型有助于解释gdp、通货膨胀和失业这类经济变量。
这些模型之所以有用是因为它们有助于我们略去无关的细节而更加明确地集中于重要的联系上。
模型有两种变量:内生变量和外生变量,一个模型的目的是说明外生变量如何影响内生变量。
3、经济学家通常假设,一种物品或劳务的价格迅速变动使得供给量与需求量平衡,即市场走向供求均衡。
这种假设称为市场出清。
在回答大多数问题时,经济学家用市场出清模型。
持续市场出清的假设并不完全现实。
市场要持续出清,价格就必须对供求变动作出迅速调整。
但是,实际上许多工资和价格调整缓慢。
虽然市场出清模型假设所有工资和价格都是有伸缩性的,但在现实世界中一些工资和价格是粘性的。
明显的价格粘性并不一定使市场出清模型无用。
首先偷格并不总是呆滞的,最终价格要根据供求的变动而调整。
市场出清模型并不能描述每一种情况下的经济,但描述了经济缓慢地趋近了均衡。
价格的伸缩性对研究我们在几十年中所观察到的实际gdp增长这类长期问题是一个好的假设。
第二章宏观经济学数据复习题1、gdp既衡量经济中所有人的收入,又衡量对经济物品与劳务的总支出。
gdp能同时衡量这两件事,是因为这两个量实际上是相同的:对整个经济来说,收入必定等于支出。
这个事实又来自于一个更有基本的事实:由于每一次交易都有一个买者和一个卖者,所以,一个买者支出的每一美元必然成为一个卖者的一美元收入。
2、cpi衡量经济中物价总水平。
它表示相对于某个基年一篮子物品与劳务价格的同样一篮子物品与劳务的现期价格。
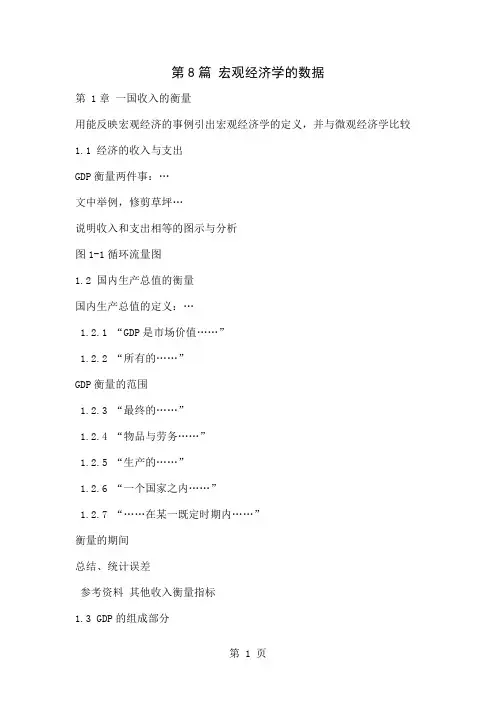
第8篇宏观经济学的数据第 1章一国收入的衡量用能反映宏观经济的事例引出宏观经济学的定义,并与微观经济学比较1.1 经济的收入与支出GDP衡量两件事:…文中举例,修剪草坪…说明收入和支出相等的图示与分析图1-1循环流量图1.2 国内生产总值的衡量国内生产总值的定义:…1.2.1 “GDP是市场价值……”1.2.2 “所有的……”GDP衡量的范围1.2.3 “最终的……”1.2.4 “物品与劳务……”1.2.5 “生产的……”1.2.6 “一个国家之内……”1.2.7 “……在某一既定时期内……”衡量的期间总结、统计误差参考资料其他收入衡量指标1.3 GDP的组成部分1.3.1 消费解释1.3.2 投资解释1.3.3 政府购买解释1.3.4 净出口解释案例研究:美国GDP的组成部分1.4 真实GDP与名义GDP1.4.1 一个数字例子引出真是GDP和名义GDP的定义表1-2真实GDP与名义GDP案例分析1.4.2 GDP平减指数GDP平减指数的定义与解释案例研究近年来的真实GDP新闻摘录 GDP变轻了新闻摘录地下经济1.5 GDP是衡量经济福利的好指标吗GDP没有考虑到的方面案例研究 GDP与生活质量的国际差异表GDP与生活质量案例研究谁在奥林匹克比赛中获胜1.6 结论内容提要关键概念复习题问题与应用第 2章生活费用的衡量引用历史经济事实,讨论消费物价指数,通货膨胀率….2.1 消费物价指数消费物价指数的定义2.1.1 如何计算消费物价指数表2-1计算消费物价指数和通货膨胀率的一个例子(1)固定篮子(2)找出价格(3)计算这一篮子东西的费用(4)选择基年并计算指数消费物价指数=一篮子物品与劳务的价格/基年一篮子的价格×100(5)计算通货膨胀率第二年的通货膨胀率=(第二年的CPI-第一年的CPI)/第一年CPI×100对例子中计算结果的分析参考资料 CPI的篮子中有些什么2.1.2 衡量生活费用过程中存在的问题第一个问题,替代偏向第二个问题,新产品的引进第三个问题,无法衡量的质量变动新闻摘录核算质量变动关于通货膨胀的争论正在商场中悄然酝酿2.1.3 GDP平减指数与消费物价指数第一个差别,反映…价格举例说明,假设沃尔沃….第二个差别,如何对各种价格进行加权….图2-2通货膨胀的两个衡量指标(CPI,通货膨胀率)2.2 根据通货膨胀的影响校正经济变量2.2.1 不同时期的美元数字今天美元的数量=T年美元的数量×今天的物价水平/T年的物价水平案例研究指数先生进入好莱坞表2-2电影史上前10部卖座电影(根据通货膨胀进行了调整)2.2.2 指数化指数化的定义2.2.3 真实利率与名义利率文中举例,假设某人把钱存入银行…通过案例分析通货膨胀率下的利率名义利率和实际利率的定义案例研究美国经济中的利率图2-3名义利率与实际利率2.3 结论内容提要关键概念复习题问题与应用第9篇长期中的真实经济第 3章生产与增长各国人均收入的历史增长与差别3.1 世界各国的经济增长表3-1不同的增长经历对该表的分析参考资料一张图片顶一千个统计数字参考资料你比最富的美国人还富吗3.2 生产率:作用及决定因素3.2.1 为什么生产率如此重要从事例引入生产率,并对其进行解释 3.2.2 生产率是如何决定的人均物质资本人均人力资本人均自然资源技术知识(对这些概念的解释)参考资料生产函数相关公式案例研究自然资源是增长的限制吗3.3 经济增长和公共政策3.3.1 储蓄和投资3.3.2 收益递减和追赶效应从假设引出收益递减的定义图3-1说明函数追赶效应的定义与相关说明3.3.3 来自国外的投资来自国外的投资采取的几种形式来自国外的投资对经济繁荣的所有衡量指标的影响分析来自国外的投资如何使一国经济增长3.3.4 教育人力资本投资成本与面临的问题新闻摘录提升人力资本3.3.5 健康与营养另一种类型的人力资本投资健康与营养和生产率的关系通过研究事实来说明3.3.6 产权和政治稳定对产权的解释对产权的一个威胁是政治的不稳定性3.3.7 自由贸易内向性政策、外向型政策列举内向性政策、外向型政策的国家经济发展特点 3.3.8 研究与开发生活水平提高的原因政府鼓励的作用3.3.9 人口增长新闻摘录富有的农民与世界穷人你们的农业补贴政治扼杀我们导致自然资源紧张新闻摘录外援世界银行面临的挑战:真的在帮助穷人吗稀释了资本存量促进了技术进步3.4 结论:长期增长的重要性内容提要关键概念复习题问题与应用第 4章储蓄、投资和金融体系设定某一身份去决定一个企业如何投资筹资金融体系的概念4.1 美国经济中的金融机构金融体系的组成部分4.1.1 金融市场概念:金融市场、债券市场、股票市场债券市场的特点:第一,债券的期限第二,信用风险第三,税收待遇股票的作用和特点股票市场的概况4.1.2 金融中介机构概念:金融中介机构、银行参考资料如何阅读报纸上的股票行情价格交易量红利价格-收益比共同基金的概念与优点4.1.3 总结4.2 国民收入账户中的储蓄与投资分析金融市场的出发点4.2.1 一些重要的恒等式Y=C+I+G+NXY=C+I+CY-C-G=IS=I储蓄等于投资对各个公式的解释与分析概念:国民储蓄S=Y-C-GS=(Y-T-C)+(T-G)对各个公式的解释与分析概念:私人储蓄、公共储蓄、预算盈余、预算赤字 4.2.2 储蓄与投资的含义举例说明储蓄并不是投资4.3 可贷资金市场引入金融市场模型可贷资金市场的概念单一金融市场假设4.3.1 可贷资金的供给与需求两种情况,储蓄是可贷资金的供给的来源图4-1可贷资金市场对图示的解析可贷资金供求模型说明了金融市场也和经济中其他市场一样运行,举例说明牛奶市场4.3.2 政策1:储蓄激励十大经济学原理:人们会对激励做出反应建议改变税法举例说明图4-2储蓄激励增加了可贷资金供给对图示的解析4.3.3 政策2:投资激励投资税赋的减免的影响图4-3投资激励增加了可贷资金需求对图示的解析第一,该法律影响供给还是需求第二,需求曲线应该向哪个方向移动第三,考虑均衡如何变动4.3.4 政策3:政府预算赤字与盈余政府争论的永恒主题是政府预算状况引入名词:预算赤字、政府债务、预算平衡图4-4政府预算赤字的影响对图示的解析第一,当预算赤字出现时哪条曲线移动第二,供给曲线向哪个方向移动第三,我们可以比较新旧均衡概念:挤出总结政府预算盈余和预算赤字的作用案例研究美国政府债务史图4-5美国政府债务案例分析4.4 结论内容提要关键概念复习题问题与应用第5章基本金融工具生活中与基本金融工具的事例概念:金融学5.1 现值:衡量货币的时间价值简单问题引入现值的概念概念:现值、未来值、复利问答形式对以上概念增强理解揭示普遍性的公式:如果利率是r,在N年后X的现值是X/(1+r)^N参考资料复利计算的魔力与70规则概念:贴现经济决策的做出取决与利率现值概念在实际中的应用,eg:公司决策…;假设赢了彩票参考资料:复利计算的魔力与70规则5.2 风险管理从生活中的小风险引入经济学中的风险管理5.2.1 风险厌恶概念:风险厌恶文中举例,假设一个朋友向你提供机会…用效用的概念建立了风险厌恶模型图27-1效用函数图示解析5.2.2 保险市场保险合约的特点经济学中,保险的作用保险市场受到…困扰,逆向选择,道德风险参考资料医疗保险的特点5.2.3 企业特有风险的多元化从安然事件中的股票价值引入多元化概念概念:多元化多元化的例子:保险市场例子解析图5-1多元化减少风险对图示的解析概念:企业特有风险、市场风险5.2.4 风险与收益的权衡取舍十大原理之一:人们面临权衡取舍多元化有价证券组合中,股票固有的风险图5-2风险与收益的权衡取舍对图示的解析第一种资产类型是风险股票的多元化组合第二种资产类型是安全替代品6.3 资产评估6.3.1 基本分析概念:基本分析从设想的有价证券组合中估计股票的价值依靠基本分析挑选有价证券组合的方法 6.3.2 有效市场假说概念用假设事例加强对此概念的理解有效市场假说的内容概念:信息有效、随机行走案例研究随机行走与指数基金新闻摘录诺贝尔级的投资建议6.3.3 市场非理性股票价格波动的原因的讨论对背离理性定价的争议6.4 结论内容提要关键概念复习题问题与应用第 7章失业失业对个人和国家的影响本章研究的方向与安排7.1 失业的确认7.1.1 如何衡量失业关于劳动力的人口调查对家庭成员的划分:就业者、失业者、非劳动力概念:劳动力、失业率、劳动力参工率图7-1 2004年人口的分类对统计结果的分析表7-1 不同人口群体的劳动力市场经历图7-2 1960年以来的失业率对图示的解析概念:自然失业率、周期性失业案例研究美国经济中男性与女性的劳动力参工率图7-3 1950年以来男性与女性的劳动力参工率对图示的解析7.1.2 失业率衡量了我们想要衡量的内容吗对失业率衡量范围内的人群的分析概念:丧失信心的工人表7-2劳动力利用不足的可供选择衡量指标新闻摘录成年男性无工作者增加7.1.3 失业者没有工作的时间有多长对失业状态持续时间进行讨论,得出结论:大多数失业是短期的….举例说明该结论,假设你一年中每周…7.1.4 为什么总有些人是失业者从对失业原因的讨论中引入概念:摩擦性失业、结构性失业7.2 寻找工作对寻找工作的分析7.2.1 为什么一些摩擦性失业是不可避免的摩擦性失业通常不是企业间劳动需求变动的结果举例说明,假设消费者对Dell电脑的偏好大于….当一个地区的就业增加时,另一个地区的就业可能减少摩擦性失业不可避免只是因为经济总是在变动新闻摘录德国的失业在严重的危机中,德国开始改变其庞大的福利国家制度 7.2.2 公共政策和寻找工作尽管一些摩擦性失业是不可避免的,但并没有准确的数量政府计划努力以各种方式促进寻找工作政府是否应该卷入寻找工作过程的讨论7.2.3 失业保险概念:失业保障依据:人们会对激励做出反应失业保障的激励效应7.3 最低工资法最低工资法如何引起失业图工资高于均衡水平引起的失业对图示的解析参考资料谁在领取最低工资7.4 工会和集体谈判概念:工会7.4.1 工会的经济学工会是一种卡特尔概念:集体谈判、罢工工会的作用局外人对失业所做出的反应工会的作用取决与…法律影响工会市场的力量的立法7.4.2 工会对经济是好还是坏工会批评者和工会支持者不同的看法新闻摘录:你应该加入工会吗?7.5 效率工资理论概念:效率工资效率工资引起失业的情况企业想保持高工资的原因7.5.1 工人健康工资和工人健康的关系效率工资理论的适用性7.5.2 工人流动率工资和工人流动率的关系企业关心工人流动率的原因7.5.3 工人素质工资和工人素质的关系7.5.4 工人努力程度工资和工人努力程度的关系插入相关漫画帮助理解案例研究亨利·福特及其极为慷慨的每天5美元工资7.6 结论内容提要关键概念复习题问题与应用第10篇长期中的货币与物价第 8章货币制度生活中需要使用货币的情形物物交换、欲望的双向一致性本章提要8.1 货币的含义概念:货币财富与货币的区别8.1.1 货币的职能三种职能:交换媒介计价单位价值储藏手段概念:流动性举例说明货币的流动性8.1.2 货币的种类商品货币概念及概念解析文中举例,…的另一个例子是香烟…法定货币概念及概念解析新闻摘录货币的历史在这个博物馆中,货币在讲述历史8.1.3 美国经济中的货币概念:通货、活期存款支票与货币存量图8-1美国经济中货币存量的两种衡量指标参考资料信用卡、借记卡和货币案例研究所有的通货都在哪里8.2 联邦储备体系概念:联邦储备、中央银行8.2.1 美联储的结构美联储的组成部分美联储有两项相互关联的重要工作概念:货币供给、货币政策8.2.2 联邦公开市场委员会联邦公开市场委员会的组成结构通过FOMC的决策,美联储有权增加或减少经济中美元的数量美联储的主要工具是公开市场活动美联储的权利依靠…经济学原理8.3 银行与货币供给银行的行为对货币供给的影响8.3.1 百分之百准备金银行的简单情况设定假设说明银行行为对货币供给的影响概念:准备金第一公民银行的T型账户对T型账户的解析得出结论:如果银行以储备金形式持有所有存款….8.3.2 部分准备金银行的货币创造重新考虑百分之百准备金银行的政策概念:部分准备金银行、准备率T型账户及解析结论:当银行只把部分存款作为准备金时,银行创造了货币此结论的意义8.3.3 货币乘数假设及相应的T型账户从以上假设中,引出货币乘数概念:货币乘数货币乘数的决定因素结论:货币乘数是准备率的倒数倒数公式的意义及举例应用公式分析8.3.4 美联储控制货币的工具美联储的货币工具箱中的三种工具:公开市场活动法定准备金贴现率概念及美联储的相关操作8.3.5 控制货币供给中存在的问题美联储的三种工具对货币供给的重要影响,必须克服的两个问题:第一,美联储不能控制家庭银行存款的方式持有货币量第二,美联储不能控制银行选择的贷款量在一部分准备金银行制度中,经济中的货币量部分取决于…案例研究银行挤兑和货币供给参考资料:联邦基金利率问答形式8.4 结论内容提要关键概念复习题问题与应用第9章货币增长与通货膨胀从日常生活中所涉及的物品的价格上升引入通货膨胀某一历史时期物品价格持续下降,引入通货紧缩通货膨胀所波及的国家或地区,通货膨胀的影响,超速通货膨胀通货膨胀的决定因素为什么通货膨胀成为一种问题9.1 古典通货膨胀理论9.1.1 物价水平与货币价值从日常物品的价格变化引入货币价值和物品价值的概念这个观点有助于推导出通货膨胀理论从两个方面来看经济中的物价总水平一方面,把物价水平看作…;另一方面,可以把物价水平看作货币价值的一种衡量指标9.1.2 货币供给、货币需求与货币均衡货币的供给与需求决定了货币的价值分析货币供给多货币价值的影响分析货币需求对货币价值的影响确保货币供给与货币需求平衡的因素图9-1货币供给与货币需求如何决定均衡的物价水平9.1.3 货币注入的影响对图示的解析货币注入后对平衡的影响图9-2货币供给增加对图示的解析概念:货币数量论9.1.4 调整过程简述分析如何从旧均衡到新均衡经济中生产物品和劳务的能力并没有改变总结结论9.1.5 古典二分法和货币中性概念:名义变量、真实变量、古典二分法转向价格时古典二分法的应用名义变量….,实际变量…长期中真实经济的讨论货币中性的概念和应用9.1.6 货币流通速度与货币数量论方程式概念:货币流通速度公式:V=(P×Y)/M对公式的意义说明及举例应用数量方程式:M×V=P×Y对数量方程式的解析解释均衡物价水平和通货膨胀率的因素:(1)货币流通速度一直是较为稳定的(2)由于货币流通速度稳定,…图9-3名义GDP、货币量与货币流通速度(3)一个经济的物品与劳动量….(4)在产量由要素供给和技术决定的情况下….(5)因此,…结果就是高通货膨胀率、案例研究四次超速通货膨胀期间的货币与物价图9-4四次超速通货膨胀期间的货币与物价9.1.7 通货膨胀税如何解释通货膨胀,概念:通货膨胀税通货膨胀税对与不同国家重要程度不同新闻摘录:德国的超速通货膨胀货币太多了9.1.8 费雪效应货币、通货膨胀和利率之间的关系分析真实利率=名义利率-通货膨胀率公式解析概念:费雪效应对费雪效应的分析在长期中是有效的费雪效应对理解名义利率在长期中的变动至关重要图9-5名义利率和通货膨胀9.2 通货膨胀的成本通货膨胀如何成为一个严重的经济问题9.2.1 购买力下降?通货膨胀的谬误通货膨胀本身并没有降低人们的实际购买力分析人们谬误的原因9.2.2 皮鞋成本通货膨胀像是对货币持有者征收的一种税一个人如何避免通货膨胀税概念:皮鞋成本文中举例,一个人的工资….,生活成本….在通货膨胀下,采取不同的措施会有不同的结果 9.2.3 菜单成本改变价格有成本概念:菜单成本通货膨胀增加了企业必须承担的菜单成本9.2.4 相对价格变动与资源配置不当假设情景,说明市场经济依相对价格配置稀缺资源 9.2.5 通货膨胀引起的税收扭曲通货膨胀往往增加储蓄所赚到的收入的税收负担通货膨胀如何抑制储蓄:税收对资本收益的例子例子:税收对利息收入的处理表9-1通货膨胀如何提高了储蓄的税收负担税法与通货膨胀如何相互影响的两个例子:名义资本收益名义利息收入的税收税制指数化问题9.2.6 混乱与不方便从一项民意调查引入美联储增加货币供给侵蚀了计价单位的真实价值 9.2.7 未预期到的通货膨胀的特殊成本:任意的财富再分配 178当通货膨胀出乎意料时,增加额外成本文中举例,假设学生….对例子的解释说明平均通货膨胀高的状况,从相关国家说明案例研究《欧兹国历险记》与银币自由铸造的争论9.3 结论内容提要复习题问题与应用第11篇开放经济的宏观经济学第 10章开放经济的宏观经济学:基本概念列出一个购买行为,来说明一国经济和世界经济概念:封闭经济、开放经济10.1 物品与资本的国际流动10.1.1 物品的流动:出口、进口以及净出口公式:净出口=一国的出口值-一国的进口值概念:出口、进口、净出口、贸易余额、贸易盈余、贸易赤字、贸易平衡影响以上概念的因素:消费者对国内和国外物品的嗜好国内与国外物品的价格人们可以用国内通货购买国外通货的汇率国内与国外消费者的收入从一国到另一国运送物品的成本政府对国际贸易的政策案例研究美国经济日益提高的开放程度新闻摘录分解生产链10.1.2 金融资源的流动:资本净流出资本净流出的概念资本净流出=本国居民购买的外国资产-外国人购买的国内资产资本流出到国外的两种形式:国外直接投资国外有价证券投资相关举例说明影响资本净流出的因素:国外资产得到的真实利率国内资产得到的真实利率持有国外资产可以觉察到的经济与政治风险影响国外拥有国内最资产的政府政策举例说明10.1.3 净出口与资本净流出相等一个开放经济以两种方式与世界其他经济相互交易NCO=NX用例子说明这个恒等式用日元投资日本经济或购买日本物品兑换成美元对整个经济进行总结当一国有贸易盈余时当一国有贸易赤字时新闻摘录:美国人依靠国外的资本流入10.1.4 储蓄、投资及其与国际流动的关系一国的储蓄和投资是其长期经济增长的关键Y=C+I+G+NXY-C-G=I+NXS=I+NXS=I+NCO多各公式的解释说明我们认定金融体系处于这个恒等式的两边储蓄有两种用法:国内投资与资本净流出储蓄、投资和国际资本流动错综复杂地相互关联案例研究美国的贸易赤字是一个全国性问题吗 10.1.5 总结表10-1物品与资本的国际流动:总结10.2 国际交易的价格:真实汇率与名义汇率10.2.1 名义汇率概念:名义汇率、升值、贬值10.2.2 真实汇率概念:真实汇率真实汇率与名义汇率是紧密相关的真实汇率=名义汇率×国内价格/国外价格文中举例说明真实汇率至关重要的原因真实汇率=(e×P)/P*相关说明参考资料欧元10.3 第一种汇率决定理论:购买力平价举例,幅度大且反方向的变动(价格)解释该现象的因素概念:购买力平价10.3.1 购买力平价理论的基本逻辑购买力平价理论根据一价定律的原理的出举例说明,假设西雅图咖啡豆的售价低于波士顿….考虑一价定律用于国际市场根据理论,一种通货必然在所有国家都具有相同的购买力 10.3.2 购买力平价理论的含义两国通货之间的名义汇率取决于这两个国家的物价水平假设举例说明e=P*/P对公式的解释说明该理论的关键含义案例研究超速通货膨胀时期的名义汇率图10-3超速通货膨胀时期的名义汇率新闻摘录:星巴克指数10.3.3 购买力平价理论的局限性购买力平价理论提供了一个有关汇率如何决定的简单模型购买力平价理论并不是完全正确的:第一,许多物品是不容易进行贸易的第二,即使是可贸易物品,当它们在不同国家时….文中举例,一些消费者偏爱德国汽车…购买力平价理论提供了理解汇率方面有用的第一步案例研究汉堡包标准第 11章开放经济的宏观经济理论11.1 可贷资金市场与外汇市场的供给与需求11.1.1 可贷资金市场从S=I+NCO恒等式开始讨论可贷资金可贷资金的供给和需求分别来自:…关于可贷资金的解释说明当NOC>0时,当NOC<0时,一国的真实利率对可资本净流出的影响及原因分析图111-1可贷资金市场对图示的解析利率调整使可贷资金的供给和需求平衡11.1.2 外汇市场NCO=NX对这个恒等式的解析开放经济模型假设,这个恒等式的两边代表外汇市场的双方真实汇率使外汇市场供求平衡图11-2外汇市场对图示的解析参考资料购买力平价是一种特例11.2 开放经济中的均衡11.2.1 资本净流出:两个市场之间的联系公式:S=I+NCONCO=NX对恒等式的相关分析净资本流出是联系两个市场的变量可贷资金市场和外汇市场图11-3资本净流出如何取决于真实利率11.2.2 两个市场的同时均衡图11-4开放经济的实际均衡a.可贷资金市场b.资本净流出c.外汇市场对图示的解析….如何共同决定开放经济中重要宏观经济变量参考资料分开供给与需求11.3 政策和事件如何影响开放经济11.3.1 政府预算赤字开放经济中,预算赤字的影响图11-5政府预算赤字的影响a.可贷资金市场b.资本净流出c.外汇市场对图示的解析第一步,找出模型中移动的曲线。


第一篇导言复习题第一章宏观经济学的科学1、解释宏观经济学和微观经济学之间的差距,这两个领域如何相互关联?【答案】微观经济学研究家庭和企业如何作出决策以及这些决策在市场上的相互作用。
微观经济学的中心原理是家庭和企业的最优化——他们在目的和所面临的约束条件下可以让自己的境况更好。
而相对的,宏观经济学研究经济的整体情况,它主要关心总产出、总就业、一般物价水平和国际贸易等问题,以及这些宏观指标的波动趋势与规律。
应该看到,宏观经济学研究的这些宏观经济变量是以经济体系中千千万万个体家庭和企业之间的相互作用所构成的。
因此,微观经济决策总是构成宏观经济模型的基础,宏观经济学必然依靠微观经济基础。
2、为什么经济学家建立模型?【答案】一般来说,模型是对某些具体事物的抽象,经济模型也是如此。
经济模型可以简洁、直接地描述所要研究的经济对象的各种关系。
这样,经济学家可以依赖模型对特定的经济问题进行研究;并且,由于经济实际不可控,而模型是可控的,经济学家可以根据研究需要,合理、科学的调整模型来研究各种经济情况。
另外,经济模型一般是数学模型,而数学是全世界通用的科学语言,使用规范、标准的经济模型也有利于经济学家正确表达自己的研究意图,便于学术交流。
3、什么是市场出清模型?什么时候市场出清的假设是适用的?【答案】市场出清模型就是供给与需求可以在价格机制调整下很快达到均衡的模型。
市场出清模型的前提条件是价格是具有伸缩性的(或弹性)。
但是,我们知道价格具有伸缩性是一个很强的假设,在很多实际情况下,这个假设都是不现实的。
比如:劳动合同会使劳动力价格在一段时期内具有刚性。
因此,我们必须考虑什么情况下价格具有伸缩性是合适的。
现在一般认为,在研究长期问题时,假设价格具有伸缩性是合理的;而在研究短期问题时,最好假设价格具有刚性。
因为,从长期看,价格机制终将发挥作用,使市场供需平衡,即市场出清,而在短期,价格机制因其他因素制约,难以很快使市场出清。

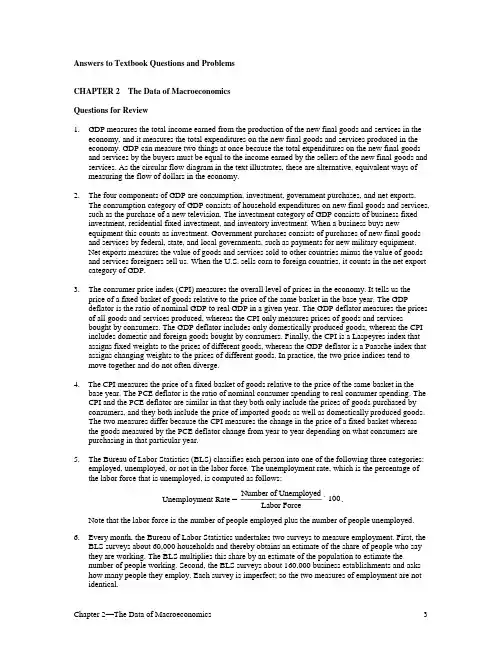
Answers to Textbook Questions and ProblemsCHAPTER 2 The Data of MacroeconomicsQuestions for Review1. GDP measures the total income earned from the production of the new final goods and services in theeconomy, and it measures the total expenditures on the new final goods and services produced in the economy. GDP can measure two things at once because the total expenditures on the new final goods and services by the buyers must be equal to the income earned by the sellers of the new final goods and services. As the circular flow diagram in the text illustrates, these are alternative, equivalent ways of measuring the flow of dollars in the economy.2. The four components of GDP are consumption, investment, government purchases, and net exports.The consumption category of GDP consists of household expenditures on new final goods and services, such as the purchase of a new television. The investment category of GDP consists of business fixed investment, residential fixed investment, and inventory investment. When a business buys newequipment this counts as investment. Government purchases consists of purchases of new final goods and services by federal, state, and local governments, such as payments for new military equipment.Net exports measures the value of goods and services sold to other countries minus the value of goods and services foreigners sell us. When the U.S. sells corn to foreign countries, it counts in the net export category of GDP.3. The consumer price index (CPI) measures the overall level of prices in the economy. It tells us theprice of a fixed basket of goods relative to the price of the same basket in the base year. The GDPdeflator is the ratio of nominal GDP to real GDP in a given year. The GDP deflator measures the prices of all goods and services produced, whereas the CPI only measures prices of goods and servicesbought by consumers. The GDP deflator includes only domestically produced goods, whereas the CPI includes domestic and foreign goods bought by consumers. Finally, the CPI is a Laspeyres index that assigns fixed weights to the prices of different goods, whereas the GDP deflator is a Paasche index that assigns changing weights to the prices of different goods. In practice, the two price indices tend to move together and do not often diverge.4. The CPI measures the price of a fixed basket of goods relative to the price of the same basket in the baseyear. The PCE deflator is the ratio of nominal consumer spending to real consumer spending. The CPI and the PCE deflator are similar in that they both only include the prices of goods purchased byconsumers, and they both include the price of imported goods as well as domestically produced goods.The two measures differ because the CPI measures the change in the price of a fixed basket whereas the goods measured by the PCE deflator change from year to year depending on what consumers are purchasing in that particular year.5. The Bureau of Labor Statistics (BLS) classifies each person into one of the following three categories:employed, unemployed, or not in the labor force. The unemployment rate, which is the percentage of the labor force that is unemployed, is computed as follows:Unemployment Rate = Number of UnemployedLabor Force´100.Note that the labor force is the number of people employed plus the number of people unemployed. 6. Every month, the Bureau of Labor Statistics undertakes two surveys to measure employment. First, theBLS surveys about 60,000 households and thereby obtains an estimate of the share of people who say they are working. The BLS multiplies this share by an estimate of the population to estimate thenumber of people working. Second, the BLS surveys about 160,000 business establishments and asks how many people they employ. Each survey is imperfect; so the two measures of employment are not identical.Problems and Applications1. From the main Web page click on the interactive data tab at the top, select GDP, begin usingthe data, section 1, and then table 1.1.1. Real GDP grew at a rate of 2.2 percent in quarter 4 of 2014.When compared to growth rates of −2.1percent, 4.6 percent, and 5 percent for the first three quarters of 2014, the rate of 2.2 percent was slightly below average. From the main Web page select the data tools tab, then top picks. Check the box for the unemployment rate and retrieve the data. The unemployment rate in March 2015 was 5.5 percent, which was about equal to the natural rate ofunemployment, or the long run average rate. From the main page, select the economic releases tab, then inflation and prices. Access the report for the CPI. In February 2015, the inflation rate for all items was 0 percent, and if food and energy were excluded the rate was 1.7 percent. The inflation rate was below average and below the Federal Reserve’s target of 2 percent.2. Value added by each person is equal to the value of the good produced minus the amount the personpaid for the materials needed to make the good. Therefore, the value added by the farmer is $1.00 ($1 –0 = $1). The value added by the miller is $2: she sells the flour to the baker for $3 but paid $1 for theflour. The value added by the baker is $3: she sells the bread to the engineer for $6 but paid the miller $3 for the flour. GDP is the total value added, or $1 + $2 + $3 = $6. Note that GDP equals the value of the final good (the bread).3. When a woman marries her butler, GDP falls by the amount of the butler’s salary. This happensbecause GDP measures total income, and therefore GDP, falls by t he amount of the butler’s loss i n salary. If GDP truly measures the value of all goods and services, then the marriage would not affect GDP since the total amount of economic activity is unchanged. Actual GDP, however, is an imperfect measure of economic activity because the value of some goods and services is left out. Once thebutler’s work becomes part of his household chores, his services are no longer counted in GDP. As this example illustrates, GDP does not include the value of any output produced in the home.4. a. The airplane sold to the U.S. Air Force counts as government purchases because the Air Force ispart of the government.b. The airplane sold to American Airlines counts as investment because it is a capital good sold to aprivate firm.c. The airplane sold to Air France counts as an export because it is sold to a foreigner.d. The airplane sold to Amelia Earhart counts as consumption because it is sold to a privateindividual.e. The airplane built to be sold next year counts as investment. In particular, the airplane is countedas inventory investment, which is where goods that are produced in one year and sold in anotheryear are counted.5. Data on parts (a) to (f) can be downloaded from the Bureau of Economic Analysis. Go to the Website, click on the interactive data tab at the top, select GDP, begin using the data, section 1, and then table 1.1.5. Choose the ―modify the data‖ option to select the years you in which you areinterested. By dividing each component (a) to (f) by nominal GDP and multiplying by 100, we obtain the following percentages:1950 1980 2014a. Personal consumption expenditures 64.0% 61.3% 68.5%b. Gross private domestic investment 18.8% 18.5% 16.4%c. Government consumption purchases 16.9% 20.6% 18.2%d. Net exports 0.2% –0.5% 3.1%e. National defense purchases 7.6% 6.3% 4.4%f. Imports 3.9% 10.3% 16.5%(Note: The above data was downloaded April 3, 2015, from the BEA Web site.)Among other things, we observe the following trends in the economy over the period 1950–2015:a. Personal consumption expenditures have been around two-thirds of GDP between 1980 and 2015.b. The share of GDP going to gross private domestic investment remained fairly steady.c. The share going to government consumption purchases rose sharply from 1950 to 1980.d. Net exports, which were positive in 1950, have been negative since that time.e. The share going to national defense purchases has fallen.f. Imports have grown rapidly relative to GDP.6.a. GDP measures the value of the final goods and services produced, or $1,000,000.b. NNP is equal to GNP minus depreciation. In this example, GDP is equal to GNP because there areno foreign transactions. Therefore, NNP is equal to $875,000.c. National income is equal to NNP, or $875,000.d. Employee compensation is equal to $600,000.e. Proprietors ’ income measures the income of the owner,and is equal to 150,000.f. Corporate profit is equal to corporate taxes plus dividends plus retained earnings, or $275,000. Retained earnings is calculated as sales minus wages minus dividends minus depreciation minus corporate tax, or $75,000.g. Personal income is equal to employee compensation plus dividends, or $750,000.h. Disposable personal income is personal income minus taxes, or $550,000.7. a. i.Nominal GDP is the total value of goods and services measured at currentprices. Therefore,Nominal GDP 2010 = P hotdogs 2010´Q hotdogs 2010()+P burgers 2010´Q burgers 2010()= ($2⨯200) + ($3⨯200)= $400 + $600= $1,000.Nominal GDP 2015 = P hotdogs 2015´Q hotdogs 2015()+P burgers 2015´Q burgers 2015()= ($4⨯ 250) + ($4⨯500)= $1,000 + $2,000= $3,000.ii. Real GDP is the total value of goods and services measured at constantprices. Therefore, to calculate real GDP in 2015 (with base year 2010), multiplythe quantities purchased in the year 2015 by the 2010 prices:Real GDP 2015 = P 2010hotdogs ´Q 2015hotdogs ()+P 2010burgers ´Q 2015burgers ()= ($2⨯ 250) + ($3⨯500)= $500 + $1,500= $2,000.Real GDP for 2010 is calculated by multiplying the quantities in 2010 by theprices in 2010. Since the base year is 2010, real GDP 2010 equals nominalGDP 2010, which is $10,00. Hence, real GDP increased between2010 and 2015.iii. The implicit price deflator for GDP compares the current prices of all goodsand services produced to the prices of the same goods and services in a baseyear. It is calculated as follows:Implicit Price Deflator 2015 = Nominal GDP 2010Real GDP 2010 = 1Using the values for Nominal GDP 2015 and real GDP 2015 calculated above:Implicit Price Deflator 2015=$3,000$2,000= 1.50.This calculation reveals that prices of the goods produced in the year 2015increased by 50 percent compared to the prices that the goods in the economysold for in 2010. (Because 2010 is the base year, the value for the implicitprice deflator for the year 2010 is 1.0 becausenominal and real GDP are thesame for the base year.)iv. The consumer price index (CPI) measures the level of prices in the economy.The CPI is called a fixed-weight index because it uses a fixed basket of goods over time to weight prices.If the base year is 2010, the CPI in 2015 is measuring the cost of the basket in 2015 relative to the cost in 2010. The CPI2015 is calculated as follows:CPI2015= (P2015hotdogs´Q2010hotdogs) + (P2015burgers´Q2010burgers)(P2010hotdogs´Q2010hotdogs) + (P2010burgers´Q2010burgers)= $16,000,000 $10,000,000= 1.6.This calculation shows that the price of goods purchased in 2015 increased by 60percentcompared to the prices these goods would have sold for in 2010. The CPIfor 2010, the baseyear, equals 1.0.b. The implicit price deflator is a Paasche index because it is computed with a changingbasket ofgoods; the CPI is a Laspeyres index because it is computed with afixed basket of goods. From(7.a.iii), the implicit price deflator for the year 2015 is1.50, which indicates that prices rose by 50percent from what they were in theyear 2010. From (7.a.iv.), the CPI for the year 2015 is 1.6,which indicates thatprices rose by 60 percent from what they were in the year 2010.If prices of all goods rose by, for example, 50 percent, then one could say unambiguouslythat the price level rose by 50 percent. Yet, in our example, relativeprices have changed. The price ofhot dogs rose by 1020 percent; the price of hamburgers roseby 33.33 percent, making hamburgers relatively less expensive.As the discrepancy between the CPI and the implicit price deflator illustrates,the change in the price level depends on how the goods’ prices are weighted.The CPI weights the price of goods by the quantities purchased in the year2010. The implicit price deflator weights the price of goods by the quantities purchasedin the year 2015. Since the quantity of the two goods was the same in2010, the CPI is placing equal weight on the two price changes. In 2015, the quantity ofhamburgers was twice as large as hot dogs, so there is twice as much weight placed on thehamburger price relative to the hot dog price. For this reason, the CPI shows a larger inflation rate – more weight is placed on the good with the larger price increase.8. a. The consumer price index uses the consumption bundle in year 1 to figure out howmuch weight toput on the price of a given good:CPI2=$2´10()+$1´0() $1´10()+$2´0()=P2red´Q1red()+P2green´Q1green()P1red´Q1red()+P1green´Q1green()= 2.According to the CPI, prices have doubled.b. Nominal spending is the total value of output produced in each year. In year 1 and year 2, Abbybuys 10 apples for $1 each, so her nominal spending remains constant at $10. For example,Nominal Spending2= P2red ´Q2red()+P2green´Q2green()= ($2 ⨯ 0) + ($1 ⨯ 10)= $10.c. Real spending is the total value of output produced in each year valued at the prices prevailing inyear 1. In year 1, the base year, her real spending equals her nominal spending of $10. In year 2, she consumes 10 green apples that are each valued at their year 1 price of $2, so her real spending is $20. That is,Real Spending2= P1red ´Q2red()+P1green´Q2green()= ($1 ⨯ 0) + ($2 ⨯ 10)= $20.Hence, Abby’s real spending rises from $10 to $20.d. The implicit price deflator is calculated by dividing Abby’s nominal spending inyear 2 by her realspending that year:Implicit Price Deflator2=Nominal Spending2 Real Spending2=$10 $20= 0.5.Thus, the implicit price deflator suggests that prices have fallen by half. The reasonfor this is that the deflator estimates how much Abby values her apples usingprices prevailing in year 1. Fromthis perspective green apples appear very valuable.In year 2, when Abby consumes 10 greenapples, it appears that her consumptionhas increased because the deflator values green apples more highly thanred apples. The only way she could still be spending $10 on a higherconsumptionbundle is if the price of the good she was consuming fell.e. If Abby thinks of red apples and green apples as perfect substitutes, then the costof living in thiseconomy has not changed—in either year it costs $10 to consume10 apples. According to the CPI, however, the cost of living has doubled. This isbecause the CPI only takes into account the factthat the red apple price has doubled;the CPI ignores the fall in the price of green apples becausethey were not inthe consumption bundle in year 1. In contrast to the CPI, the implicit pricedeflatorestimates the cost of living has been cut in half. Thus, the CPI, a Laspeyresindex,overstates the increase in the cost of living and the deflator, a Paascheindex, understates it.9. a. The labor force includes full time workers, part time workers, those who run their own business,and those who do not have a job but are looking for a job. The labor force consists of 70 people.The working age population consists of the labor force plus those not in the labor force. The 10discouraged workers and the 10 retired people are not in the labor force, but assuming they arecapable of working, they are part of the adult population. The adult population consists of 90people, so the labor force participation rate is equal to 70/90 or 77.8 percent.b. The number of unemployed workers is equal to 10, so the unemployment rate is 10/70 or 14.3percent.c. The household survey estimates total employment by asking a sample of households about theiremployment status. The household survey would report 60 people employed. The establishmentsurvey estimates total employment by asking a sample of businesses to report how many workers they are employing. In this case the establishment survey would report 55 people employed. The 5 people with 2 jobs would be counted twice, and the 10 people who run their own business wouldnot be counted.10. As Senator Robert Kennedy pointed out, GDP is an imperfect measure of economic performance orwell-being. In addition to the left-out items that Kennedy cited, GDP alsoignores the imputed rent on durable goods such as cars, refrigerators, and lawnmowers;many services and products produced as part of household activity, such as cooking andcleaning; and the value of goods produced and sold in illegal activities, such as the drugtrade. These imperfections in the measurement of GDP do notnecessarily reduce itsusefulness. As long as these measurement problems stay constant over time, then GDPis useful in comparing economic activity from year to year. Moreover, a large GDPallows us to afford better medical care for our children, newer books for their education,and more toys for their play. Finally, countries with higher levels of GDP tend to havehigher levels of life expectancy, better access to clean water and sanitation, and higherlevels of education. GDP is therefore a useful measure for comparing the level ofgrowth and development across countries.11. a. Real GDP falls because Disney World does not produce any services while it is closed. Thiscorresponds to a decrease in economic well-being because the income of workers and shareholders of Disney World falls (t he income side of the national accounts), and people’s consumption ofDisney World falls (the expenditure side of the national accounts).b. Real GDP rises because the original capital and labor in farm production now produce more wheat.This corresponds to an increase in the economic well-being of society, since people can nowconsume more wheat. (If people do not want to consume more wheat, then farmers and farmlandcan be shifted to producing other goods that society values.)c. Real GDP falls because with fewer workers on the job, firms produce less. This accurately reflectsa fall in economic well-being.d. Real GDP falls because the firms that lay off workers produce less. This decreases economic well-being because workers’ incomes fall (the inco me side), and there are fewer goods for people tobuy (the expenditure side).e. Real GDP is likely to fall, as firms shift toward production methods that produce fewer goods butemit less pollution. Economic well-being, however, may rise. The economy now produces lessmeasured output but more clean air. Clean air is not traded in markets and, thus, does not show up in measured GDP, but is nevertheless a good that people value.f. Real GDP rises because the high school students go from an activity in which they are notproducing market goods and services to one in which they are. Economic well-being, however,may decrease. In ideal national accounts, attending school would show up as investment because it presumably increases the future productivity of the worker. Actual national accounts do notmeasure this type of investment. Note also that future GDP may be lower than it would be if thestudents stayed in school, since the future work force will be less educated.g. Measured real GDP falls because fathers spend less time producing market goods and services.The actual production of goods and services need not have fallen because but unmeasuredproduction of child-rearing services rises. The well-being of the average person may very well rise if we assume the fathers and the children enjoy the extra time they are spending together.。
曼昆宏观经济学第七版中文答案【篇一:曼昆宏观经济学-课后答案第6、7版】txt>复习题1、由于整个经济的事件产生于许多家庭与许多企业的相互作用,所以微观经济学和宏观经济学必然是相互关联的。
当我们研究整个经济时,我们必须考虑个别经济行为者的决策。
由于总量只是描述许多个别决策的变量的总和,所以宏观经济理论必然依靠微观经济基础。
2、经济学家是用模型来解释世界,但一个经济学家的模型往往是由符号和方程式构成。
经济学家建立模型有助于解释gdp、通货膨胀和失业这类经济变量。
这些模型之所以有用是因为它们有助于我们略去无关的细节而更加明确地集中于重要的联系上。
模型有两种变量:内生变量和外生变量,一个模型的目的是说明外生变量如何影响内生变量。
3、经济学家通常假设,一种物品或劳务的价格迅速变动使得供给量与需求量平衡,即市场走向供求均衡。
这种假设称为市场出清。
在回答大多数问题时,经济学家用市场出清模型。
持续市场出清的假设并不完全现实。
市场要持续出清,价格就必须对供求变动作出迅速调整。
但是,实际上许多工资和价格调整缓慢。
虽然市场出清模型假设所有工资和价格都是有伸缩性的,但在现实世界中一些工资和价格是粘性的。
明显的价格粘性并不一定使市场出清模型无用。
首先偷格并不总是呆滞的,最终价格要根据供求的变动而调整。
市场出清模型并不能描述每一种情况下的经济,但描述了经济缓慢地趋近了均衡。
价格的伸缩性对研究我们在几十年中所观察到的实际gdp增长这类长期问题是一个好的假设。
第二章宏观经济学数据复习题1、gdp既衡量经济中所有人的收入,又衡量对经济物品与劳务的总支出。
gdp能同时衡量这两件事,是因为这两个量实际上是相同的:对整个经济来说,收入必定等于支出。
这个事实又来自于一个更有基本的事实:由于每一次交易都有一个买者和一个卖者,所以,一个买者支出的每一美元必然成为一个卖者的一美元收入。
2、cpi衡量经济中物价总水平。
它表示相对于某个基年一篮子物品与劳务价格的同样一篮子物品与劳务的现期价格。
第一篇导言复习题第一章宏观经济学的科学1、解释宏观经济学与微观经济学之间的差距,这两个领域如何相互关联?【答案】微观经济学研究家庭与企业如何作出决策以及这些决策在市场上的相互作用。
微观经济学的中心原理就是家庭与企业的最优化——她们在目的与所面临的约束条件下可以让自己的境况更好。
而相对的,宏观经济学研究经济的整体情况,它主要关心总产出、总就业、一般物价水平与国际贸易等问题,以及这些宏观指标的波动趋势与规律。
应该瞧到,宏观经济学研究的这些宏观经济变量就是以经济体系中千千万万个体家庭与企业之间的相互作用所构成的。
因此,微观经济决策总就是构成宏观经济模型的基础,宏观经济学必然依靠微观经济基础。
2、为什么经济学家建立模型?【答案】一般来说,模型就是对某些具体事物的抽象,经济模型也就是如此。
经济模型可以简洁、直接地描述所要研究的经济对象的各种关系。
这样,经济学家可以依赖模型对特定的经济问题进行研究;并且,由于经济实际不可控,而模型就是可控的,经济学家可以根据研究需要,合理、科学的调整模型来研究各种经济情况。
另外,经济模型一般就是数学模型,而数学就是全世界通用的科学语言,使用规范、标准的经济模型也有利于经济学家正确表达自己的研究意图,便于学术交流。
3、什么就是市场出清模型?什么时候市场出清的假设就是适用的?【答案】市场出清模型就就是供给与需求可以在价格机制调整下很快达到均衡的模型。
市场出清模型的前提条件就是价格就是具有伸缩性的(或弹性)。
但就是,我们知道价格具有伸缩性就是一个很强的假设,在很多实际情况下,这个假设都就是不现实的。
比如:劳动合同会使劳动力价格在一段时期内具有刚性。
因此,我们必须考虑什么情况下价格具有伸缩性就是合适的。
现在一般认为,在研究长期问题时,假设价格具有伸缩性就是合理的;而在研究短期问题时, 最好假设价格具有刚性。
因为,从长期瞧,价格机制终将发挥作用,使市场供需平衡,即市场出清,而在短期,价格机制因其她因素制约,难以很快使市场出清。