土石坝SH 波地震反射成像
- 格式:pdf
- 大小:6.86 MB
- 文档页数:16
•岩土工程与地下工程•地震反射波法在隧道超前预报中的应用曾胜强!,奉建军2,黄云2(1.西南 大学地球科学与环境工程学院,四川成都610031;2.西南大学土木工程学院,四川610031#【摘要】隧道在挖掘过程中,常发生坍塌、涌水等隧道病害,故隧道超前预报得到了重视与发展,其中 地震反射波法在隧道超前预报中应用最广。
地震反射波法在隧道超前预报中应用的主要方法有负视速度法、HSP 水平声波剖面技术、TSP 隧道地震预报、TRT 地震层析成像方法、TST 隧道地震CT 成像技术等,由于 这些方法的观测系统与数据处理方式不同而导致反演结果存在差异。
文章主要分析了各类地震反射波法在 反演中存在的差异,评价了方法间的优劣,通过综合分析可知:TST 隧道地震CT 成像技术采用了空间观测系 统、像方法、散射理论,能采集掌子面前方波速,反演出异常体空间位置与围岩力学特征。
【关键词】地震反射波法;隧道超前预报;观测系统;数据处理;异常体【中图分类号】U 456.3 +3隧道在挖掘过程中常发生塌方、岩溶涌水等突发地质灾 害,严重 工进度害人 全。
手段 有效探面前方不良地质情况,指导 开挖,低 的发生。
地震反法在中得到了广泛应用。
在 九代初期,负视速度法应用于我铁 域,曾昭璜、何振起发 关的 果。
二十九代期间,HSP ;剖面技术由中铁西南院提出,在台湾、地区得到应用。
, 司出了 TSP ) 方法,NSA 工程公司研发了 TRT 地震层 方法,且这 方法在欧亚 获得广泛使用。
本初期,TST 隧道地震CT 成像技术 授.研发 ,并应用于工 域[1]。
各种地震反法的基,均是基于惠更斯菲涅尔、费 、斯奈尔定律[4]。
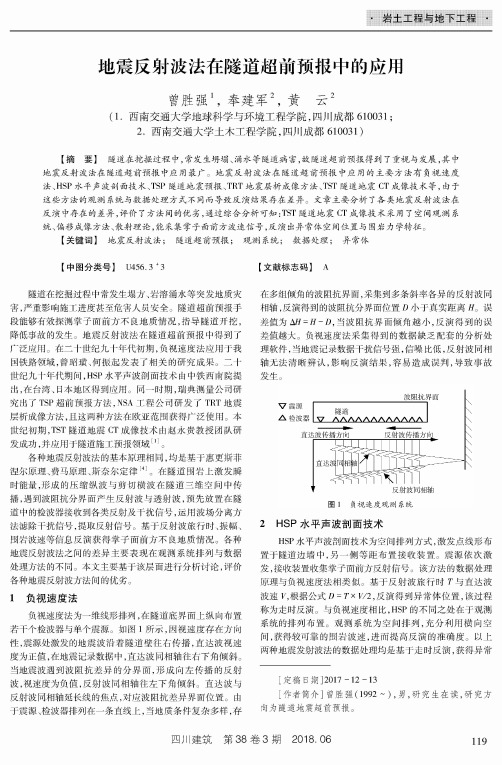
在 岩上激发瞬, 的压缩纵波与剪切 在维空间中传播,遇到波阻抗分界面产生反与,预先放置在隧中的 接收到各类反射及干扰 ,运用 方法 扰 ,提取反 。
基于反 、振、围岩波速等信息反演获得 面前方不良地质情况。
各种地震反法之间的差异主要表现在观测系列与数据处理方法的不同。

地震波反射成像与油气勘探效果分析地震波反射成像技术在油气勘探领域的应用已有数十年的历史,它通过记录和分析地下地震波的反射信息,可以对地下构造进行成像和解释,从而帮助勘探人员判断油气储层的分布和性质。
本文将围绕地震波反射成像技术的原理、方法和应用展开论述。
地震波反射成像技术的基本原理是利用地面或井下发射的震源激发地下介质中的地震波,当波束遇到不同的地层界面时,会发生反射、折射和透射等现象。
这些反射信号会被接收器记录下来,然后经过数字信号处理和成像算法分析,最终形成地下地质层面或地震剖面的图像。
地震波反射成像技术主要包括震源激发、地震数据采集和处理、成像和解释等几个步骤。
在震源激发方面,常用的方法有人工震源、爆炸震源和振动车震源等。
地震数据采集和处理包括地震仪器的布放、数据采集和预处理等。
成像阶段是将采集的地震数据进行适当的处理,应用反演算法和波动方程模拟等手段,将信号转化为地层界面的形态图像。
解释是根据成像结果,分析地震波与地层之间的相互作用规律,确定油气储层的分布及其性质。
地震波反射成像技术在油气勘探中具有多方面的应用效果。
首先,它可以对油气储层的几何形态进行细致刻画,提供了勘探人员进行合理油气勘探区划的依据。
其次,通过分析反射波的振幅、频率和相位等特征,可以获得油气储层的物性参数,如孔隙度、饱和度、弹性参数等,从而评估储层的质量和含油气性。
此外,地震波反射成像技术还可以探测油气储层的构造异常,如断裂、岩性变化等,为油气勘探提供了重要的线索。
然而,地震波反射成像技术也存在一些挑战和限制。
首先,地震波的解释需要丰富的地质背景知识和专业技术,对勘探人员的要求较高。
其次,成像结果受到多种因素的影响,如地震仪器的参数设置、地面与储层之间的介质性质等,因此需要科学合理地选择采样点和参数。
此外,地震波反射成像技术在某些地质构造复杂的区域效果可能会受到限制,如在山区和盆地等地形复杂的地区。
尽管存在一些限制,地震波反射成像技术作为油气勘探的主要手段之一,仍然在许多国家和地区得到广泛应用。

浅谈地震映像法在水利工程勘察中的应用王发青;李新宝【摘要】地震映像法是继反射波多次覆盖技术后,近年来发展起来的一种地球物理勘探方法,它是以弹性波在介质中传播时,遇到物性分界面或物性突变点将发生反射或绕射并产生频散现象,利用其反射波和绕射波的特性,根据波的运动学和动力学特征,反演介质的物性参数.其优点是数据采集简便、资料处理简单,已广泛应用于浅层地质勘察中,并获得了良好的应用效果文章简要介绍了地震映像法在水利工程勘察中的实际应用效果.【期刊名称】《技术与市场》【年(卷),期】2012(019)011【总页数】1页(P47)【关键词】弹性波;地震映像法;偏移距;同相轴【作者】王发青;李新宝【作者单位】吉林省水利水电勘测设计研究院,吉林长春130012;吉林省水利水电勘测设计研究院,吉林长春130012【正文语种】中文0 引言弹性波在介质中传播时,遇到物性分界面或物性突变点将发生反射或绕射并产生频散现象。
反射波法是利用其反射波和绕射波的特性,记录各种波的旅行时间和动力学特征,根据波的运动学和动力学特征,反演介质的物性参数,据此通过计算处理获取物性分界面和突变点的埋深。
1 地震映像法基本原理地震映像(又称高密度地震勘探和地震多波勘探)是基于反射波法中的最佳偏移距技术发展起来的一种常用浅地层勘探方法。
这种方法可以利用多种波作为有效波来进行探测,也可以根据探测目的要求仅采用一种特定的波作为有效波。
在这种方法中,每一测点的波形记录都采用相同的偏移距激发和接收。
在该偏移距处接收到的有效波具有较好的性噪比和分辨率,能够反映出地质体沿垂直方向和水平方向的变化。
地震映像可以用波形图或彩色振幅图显示结果,同时进行运动学和动力学方面的解释分析,数据处理可以在空间、时间和频率域中进行,图示直观。
目前一些地震仪器已经采用了特殊的数据采集技术,可以方便、快速地获得地震映像记录。
2 地震映像法的特点地震映像法数据采集速度较快,但抗干扰能力弱,勘探深度有限。

高密度多波列地震影像法及其在堤坝隐患检测中的应用
彭皖生
【期刊名称】《水利水电技术》
【年(卷),期】2001(032)010
【摘要】@@ 1 前言rn地震学理论表明,在距震源一定距离处,瑞雷波的能量最强,特别是在松散土层中尤为突出.SWS系列多功能面波仪的问世,以其快速的存储采集功能使进行固定偏移距的面波剖面采集成为可能.因此,在工程物探中一种新的方法
出现了,人们暂称之为"高密度多波列地震影像法”.应用得知,它在探测地下埋设物、空洞、浅部岩溶、土洞调查、浅部构造、堤(坝)松散或软弱层隐患、堤坝的横向不均性、地下暗滨等诸多方面有着其它常规工程物探方法所不具有的快速、准确、直观等特点.
【总页数】2页(P48-49)
【作者】彭皖生
【作者单位】安徽省水利部淮河水利委员会水利科学研究院
【正文语种】中文
【中图分类】TV698.1
【相关文献】
1.多波列高密度地震影像法在沪崇隧道工程地质调查中的应用 [J], 谭春;王永
2.高密度多波列地震影像法及其在合流污水管道探测中的应用 [J], 王永;郁钧
3.多波地震勘探法与高密度电法在测量堤坝渗漏隐患上的分析比较 [J], 马玉霞;马
骏
4.高密度电阻率法在东山门水库堤坝隐患探测中的应用 [J], 涂丹;邹晨阳
5.多波地震勘探法与高密度电法在测量堤坝渗漏隐患上的分析比较 [J], 马玉霞; 马骏
因版权原因,仅展示原文概要,查看原文内容请购买。

V形河谷中土石坝纵向地震反应的简化解析解
沈振中;徐志英
【期刊名称】《水电能源科学》
【年(卷),期】1999(17)4
【摘要】提出了一个计算V形河谷中非均匀土石坝纵向地震反应的线弹性模型.在考虑剪切模量随深度至指数变化的情况下,运用三维剪切楔理论,导出了土石坝纵向振动的控制微分方程,并采用分离变量法和伽辽金逼近,得到了计算土石坝纵向振动前三阶振型自振频率的代数公式,以及相应的估计地震反应的计算公式.【总页数】4页(P9-12)
【关键词】土石坝;纵向振动;地震反应;反应谱
【作者】沈振中;徐志英
【作者单位】河海大学
【正文语种】中文
【中图分类】TV312
【相关文献】
1.不同河谷条件面板堆石坝地震加速度反应规律 [J], 宋志宇;董莉莉;李斌
2.V形河谷中非均匀土石坝振动的简化分析 [J], 沈振中;徐志英
3.V形河谷中土石坝垂直振动的近似解析 [J], 沈振中;徐志英
4.成层场地振动特性及地震反应简化解析解的完整形式 [J], 栾茂田;刘占阁
5.非均质土石坝及地基竖向地震反应简化分析 [J], 栾茂田;金崇磐;林皋
因版权原因,仅展示原文概要,查看原文内容请购买。

浅层地震映像法在堤坝无损检测中的应用
刘江平;陈超;侯卫生
【期刊名称】《人民长江》
【年(卷),期】2002(033)005
【摘要】为了达到准确而有效地对堤坝裂隙(或裂缝)进行无损检测之目的,在建立垂直裂隙(或裂缝)反射波运动学数学模型的基础上,对垂直裂隙(或裂缝)模型进行了数字模拟和超声波物理摸拟,对其结果作了综合讨论和分析.并对某钢筋混凝土大坝采用浅层地震映像法检测的实例结果进行了综合分析.结果表明,浅层地震映像法探测垂直裂隙时,必须采用偏移距不为零的等偏移距映像法才能得到垂直裂隙(或裂缝)的反射,否则难以对垂直裂隙(裂缝)进行有效检测;不管激发和接收点处于什么位置,在水平界面上的反射点均在与激发和接收点同侧,距垂直裂隙1/2偏移距处;浅层地震映像法是一种无损检测堤坝裂隙(或裂缝)及不良体的行之有效的方法.
【总页数】3页(P26-28)
【作者】刘江平;陈超;侯卫生
【作者单位】中国地质大学地球物理系,湖北,武汉,430074;中国地质大学地球物理系,湖北,武汉,430074;中国地质大学地球物理系,湖北,武汉,430074
【正文语种】中文
【中图分类】TV698.13
【相关文献】
1.浅层地震映像技术在岩溶探查中的应用 [J], 周孝宇
2.浅层地震映像法在破碎带勘察中的应用 [J], 孙茂锐;罗术
3.三分量地震映像技术在浅层裂隙调查中的应用 [J], 施剑;刘江平;曾祥芝
4.地震映像技术在浅层隐伏空区探测中的应用∗ [J], 张洋洋
5.高密度电阻率法和浅层地震映像法在岩溶塌陷勘察中的应用 [J], 陈权;胡斌;杜春龙;梁本旺
因版权原因,仅展示原文概要,查看原文内容请购买。
井间地震测量数据的反射波成像及解释
严又生;宜明理;魏新;万文曼
【期刊名称】《石油地球物理勘探》
【年(卷),期】2000(035)001
【摘要】井间地震反射波成像比井间速度层析成像具有更高的分辨率,井间地震反射波成像剖面能用于井间储层精细解释.本文采用非均匀介质的射线追踪算法,按照实际井间地震观测系统计算共炮点道集(或共接收点道集)的反射波时间场,然后将反射波能量在共反射点上叠加,得到井间地震反射波成像剖面.其具体做法分三步:①计算各反射点的反射波旅行时,包括上、下行反射波;②按一定的观测方式(如共炮点、共接收点、共偏移距、共中心点、共深度点)进行上、下行波分离;③分别对上、下行反射波进行共反射点叠加成像并合并.通过理论模型和实际资料处理,均得到了质量较高的井间反射波成像剖面.
【总页数】7页(P36-41,63)
【作者】严又生;宜明理;魏新;万文曼
【作者单位】石油地球物理勘探局研究院地质研究中心;石油地球物理勘探局研究院地质研究中心;石油地球物理勘探局研究院地质研究中心;西安石油勘探仪器总厂【正文语种】中文
【中图分类】P631;TE1
【相关文献】
1.井间地震反射波POSTMAP偏移成像方法研究 [J], 魏国华;孔庆丰;左建军;魏宏泉
2.井间地震直达波和反射波联合层析成像及应用 [J], 左建军;林松辉;孔庆丰;张建中;施俊杰
3.对井间地震反射波成像资料的初步认识 [J], 乔玉雷;王延光;李九生;何惺华
4.井间地震反射波成像技术探讨 [J], 郭全仕;邬达理;唐金良;曹辉
5.井间地震下行反射波成像方法初探 [J], 孔庆丰;左建军;魏国华
因版权原因,仅展示原文概要,查看原文内容请购买。
圆盘波源反射成像在地震勘探中的应用地震勘探是一种通过探测地下构造和岩石性质的方法,广泛应用于石油、矿产资源勘探等领域。
在地震勘探过程中,波源反射成像是一种重要的技术。
其中,圆盘波源反射成像技术由于其良好的成像效果,得到了广泛的应用。
圆盘波源反射成像技术利用能量均匀分布的圆盘状波源来发射地震波。
这种波源可以产生多方向的地震波,从而获得更全面的地下信息。
与传统的线源波场相比,圆盘波源具有以下几个优势。
首先,圆盘波源能够提供更全面的地下信息。
线源波场只能产生沿着线方向的能量传播,而圆盘波源能够产生各个方向的波动,从而覆盖更广阔的地下区域。
通过这种方式,我们可以获取到地下的细节信息,更加准确地理解地下构造和岩石性质。
其次,圆盘波源反射成像技术在成像质量上具有明显的优势。
由于圆盘波源能够向各个方向发射波动,因此在成像过程中可以获取到更多的反射信号。
这就意味着成像的信噪比更高,图像清晰度更高,使得地震勘探人员可以更准确地解读地下结构。
此外,圆盘波源反射成像还具有较好的深部探测能力。
由于能量分布均匀,圆盘波源波场能够深入地下,并引发更多深部反射信号。
对于某些地质构造复杂、深度较大的区域,传统的线源波场可能无法达到预期效果,而圆盘波源能够有效提高探测深度,拓宽勘探范围。
当然,圆盘波源反射成像技术也存在一些挑战和限制。
首先,由于圆盘波源需要在地面上布置,布点较多,工作量较大。
其次,由于圆盘波源的能量分布均匀,单个波源产生的能量较弱,信噪比相对较低。
这就要求在勘探过程中需要采用更高灵敏度的接收设备来接收弱信号。
另外,成像结果的处理也需要更复杂的算法和技术支持。
尽管存在上述挑战,圆盘波源反射成像技术在地震勘探中的应用仍然非常广泛。
近年来,随着科学技术的不断进步,接收和处理设备的提升,圆盘波源反射成像技术的应用前景更加广阔。
在石油勘探领域,圆盘波源反射成像技术已经在深水勘探和海底油气资源探测中取得了很好的应用效果。
此外,在地质灾害和地下水资源勘探中,圆盘波源反射成像技术也有着重要的应用价值。
土石坝地震工程学一、地震基本原理地震是地球内部的地震波在地壳内传播引起的地面振动现象。
地震波分为体波和面波,其中体波包括P波和S波,而面波是S波及P波在地表相遇后激发产生的。
地震波的传播速度与地层的地质、深度等因素有关。
地震的震级和烈度是衡量地震释放能量和影响程度的两个重要指标。
二、土石坝震损机制土石坝在地震作用下的损坏机制主要包括以下几个方面:水平惯性力的影响,导致坝体的滑动和倾覆;地震波产生的动水压力,影响坝体的稳定性;地震引起的砂土液化,导致坝体失稳;地基的液化或错动,导致坝体下沉或裂缝。
了解这些机制有助于针对性地制定抗震设计和加固措施。
三、土石坝抗震设计土石坝的抗震设计需要充分考虑地震对坝体的影响,包括地震力、地基变形、砂土液化等因素。
设计时需要采取有效的抗震措施,如优化坝体结构、加强地基处理、防止砂土液化等。
此外,设计时还需要根据不同等级的地震要求,采用适当的抗震计算和分析方法,以确保坝体的安全性和稳定性。
四、土石坝抗震加固对于已经建成的土石坝,如果存在抗震性能不足的问题,需要进行抗震加固。
加固措施主要包括:加强坝体结构,提高其抗滑稳定性;改善地基,防止地基液化;增加排水措施,降低静水压力和防止砂土液化等。
同时,抗震加固还需要考虑施工条件和工程费用的限制,确保加固效果的经济性和可行性。
五、土石坝地震模拟土石坝的地震模拟是通过建立数学模型或物理模型来模拟地震对坝体的作用。
通过模拟,可以深入了解坝体在地震作用下的响应机制和破坏模式,为抗震设计和加固提供依据。
同时,模拟还可以用于评估不同抗震措施的效果和可行性,为实际工程提供参考和借鉴。
六、土石坝地震监测土石坝的地震监测是通过安装地震监测仪器来实时监测地震对坝体的作用。
监测数据可以用于分析坝体的响应机制和破坏模式,评估坝体的安全性和稳定性。
同时,监测数据还可以用于验证抗震设计和加固措施的效果,为以后的工程提供经验和借鉴。
七、土石坝震后修复在地震灾害发生后,土石坝可能会受到不同程度的损坏。
地震波真反射层析成像超前预报布置参数优化
刘勇锋;马海涛
【期刊名称】《中国安全生产科学技术》
【年(卷),期】2013(009)002
【摘要】利用地震波真反射层析成像技术对西石门铁矿深部开拓工程进行了超前预报,分析了各种不利因素引起的地震波振幅变化对井巷地质超前预报效果带来的影响.对TRT地质超前预报系统布置参数进行了改进与创新研究,得出了震源、最小偏移距和炮间距最优参数.防止了重大突水事故的发生,为西石门铁矿后期进行的开拓工程提供了可靠的依据.
【总页数】6页(P29-34)
【作者】刘勇锋;马海涛
【作者单位】中国安全生产科学研究院,北京100012
【正文语种】中文
【中图分类】X936
【相关文献】
1.地震波反射法(TSP)在杨家峪隧道超前预报中的应用 [J], 王丽仙
2.富水断层破碎带隧道超前预报的地震波三维层析成像应用研究 [J], 孙立军
3.电阻抗层析成像测量电路参数优化仿真研究 [J], 周丹娜
4.地震波各向异性走时层析成像有限元模型仿真 [J], 贾源源;董淼
5.从反射波射线路径对地震波速度实施层析成像计算 [J], William S.Harlan;周焕然
因版权原因,仅展示原文概要,查看原文内容请购买。
ResearchApplied Geophysics—ArticleSH-Mode Seismic-Reflection Imaging of EarthfillDamsEdward W.WooleryDepartment of Earth and Environmental Sciences,University of Kentucky,Lexington,KY 40506-0053,USAa r t i c l e i n f o Article history:Received 8April 2017Revised 31March 2018Accepted 27August 2018Available online 5September 2018Keywords:GeophysicsSeismic reflection Shear-wave Near-surface Dam safetya b s t r a c tAssessing subsurface characteristics and imaging geologic features (e.g., faults, cavities, low-velocity lay-ers, etc.) are typical problems in near-surface geophysics. These questions often have adverse geotechni-cal engineering implications, and can be especially acute when associated with high-hazard structures such as large earthen flood-control dams. Dam-related issues are becoming more frequent in the United States, because a large part of this major infrastructure was designed and constructed in the early- to mid-twentieth century; these dams are thus passing into the latter stages of their design life, where minute flaws that were overlooked or thought to be insignificant in design/construction are now proving problematic. The high-hydraulic heads associated with these structures can quicken degra-dation of weak areas and compromise long-term integrity. Addressing dam-related problems solely with traditional invasive drilling techniques is often inadequate (i.e., lack of lateral resolution) and/or econom-ically exorbitant at this scale. However, strategic geotechnical drilling integrated with the broad utility of near-surface geophysics, particularly the horizontally polarized shear-wave (SH-mode) seismic-reflection technique for imaging the internal structural detail and geological foundation conditions of earthfill embankment dams can cost-effectively improve the overall subsurface definition needed for remedial engineering. Demonstrative evidence for this supposition is provided in the form of SH-wave seismic-reflection imaging of in situ and engineered as-built components of flood-control embankment dams at two example sites in the central United States.Ó 2018 THE AUTHOR. Published by Elsevier LTD on behalf of Chinese Academy of Engineering and Higher Education Press Limited Company. This is an open access article under the CC BY-NC-ND license .1.IntroductionSocietal demands for flood control,water resources,and domestic/industrial energy helped initiate a prolific period of dam design and construction throughout the United States during the early-and mid-twentieth century [1].During much of this time,engineering efficiency and economic practicality allowed civil projects,particularly earthfill embankment dams,to utilize suitable in situ earth materials (i.e.,clay,sand,and gravel)for impervious cutoffs,filter drains,and other fundamental structural elements.It was not until the near-catastrophic dam failures asso-ciated with the 1971San Fernando earthquake in southern Califor-nia that more stringent consideration was given to the practice of using in situ materials as part of a dam’s composition [1].Subse-quently,most regulatory agencies required the excavation and replacement of unlithified natural materials with engineered fill in all aspects of high-hazard dam design and construction.How-ever,the in situ natural materials used in the earlier structuresretained the potential for having undiscovered zones of adverse geotechnical properties (e.g.,soft or low seismic-velocity zones,etc.),or acting to mask the presence of unfavorable geologic fea-tures (i.e.,faults,karst,etc.)in the underlying bedrock foundation.Depending on the particular site conditions,resultant problems associated with these unknown geotechnical flaws may take dec-ades to manifest.Change orders or other post-design alterations often occur dur-ing the construction phase of any project,but can be especially numerous and significant for large complex structures such as flood-control dams [2].Although modern digital tracking systems and databases provide a more complete engineering archive,it should not be surprising that many construction modification records made during the early period of prolific dam building have been lost or poorly documented due to the large number of amend-ments and record-keeping practices of the time.Nevertheless,these previous standards of practice can make assessing in situ geo-logical or as-built engineered features within or beneath older earthen embankment dams a common source of geotechnical uncertainty.E-mail address:woolery@All of these issues are of particular concern for large embank-ment dams and other high-hazard structures,because a large part of this infrastructure is passing into the latter stages of design life where minuteflaws,which were overlooked or thought to be insignificant in the original design and/or construction phase,are proving problematic.Moreover,these geotechnical conditions can be especially consequential for structures exposed to high-hydraulic heads such asflood-control dams,where degradation can be accelerated and long-term integrity compromised.Traditionally,solutions to geotechnical dam problems have largely relied on engineering measurements derived from various invasive drilling methods[1];however,this approach can be inef-fective(e.g.,lack of lateral resolution)and/or cost exorbitant at this size and scale.In addition,the boreholes are generally distributed evenly across the project‘‘footprint,”thus problem areas can easily go undetected.However,a target-based drilling strategy can be technically and economically more effective by integrating the broad utility of noninvasive near-surface geophysics.Having said that,the selected geophysical method must be physically capable of resolving the geotechnical targets and objectives.The horizon-tally polarized shear-wave seismic-reflection technique can often provide the required resolution and optimal imaging for large embankment dams,including engineered structural features and in situ geological foundation conditions.This supposition was doc-umented at two earthfillflood-control dams in the central United States.Notwithstanding the high-noise conditions at both dams, the SH-wave seismic-reflection method proved successful for imaging low-impedance intra-embankment boundaries separating in situ geologic sediment and compacted engineered borrow-fill of equivalent material(i.e.,impervious cutoff),as well as buried as-built concrete elements(i.e.,bulkhead cutoff and outlet works conduit).These results provide corroborative evidence for utilizing noninvasive cost-effective near-surface geophysics as a supple-ment to traditional drilling programs at large-scale civil works projects.2.BackgroundSH-wave seismic-reflection profiles collected at two earthfill flood-control dams in the central United States were used in order to evaluate their geophysical effectiveness for imaging and locating the following:①low-impedance intra-embankment boundaries separating engineeredfill and in situ geologic materials incorpo-rated into the dam design as impermeable cutoffs and drainfilters; and②relatively small,fundamental elements required for a prop-erly functioning dam(i.e.,interior concrete outlet conduit),as well as features added during the construction phase for the abatement of a foundation hazard discovered during excavation at the dam abutment(i.e.,concrete bulkhead cutoff).Dam Site1,located in northern Indiana,was constructed during the early to mid-1960s(Fig.1(a)).It is a compacted earthfill embankment approximately2.4km in length with a maximum height of nearly53m above bedrock.The embankment is founded on approximately25m of glacio-alluvial sediment overlying a Silurian limestone bedrock.The788m long SH-wave seismic-reflection profile was acquired along the downstream edge of the dam’s crest,approximately12m downstream of the axial center line.It originated at the right abutment and terminated at the onset of the centrally located outlet works.An earlier interpreta-tion of these seismic-reflection data assessed existing geologic haz-ards associated with mature karst development in the limestone foundation beneath the embankment,which were encountered during both design and construction[3].The previous study suc-cessfully applied high-resolution SH-wave seismic-reflection sur-veying of the bedrock surface beneath the dam in order to approximate the depth to bedrock,and to identify signal anomalies indicative of unfavorable geological foundation conditions(i.e., karst).The data are used here to evaluate the SH-wave seismic-reflection method for imaging intra-embankment boundaries sep-arating engineeredfill(compacted glacial till borrow)and in situ glacial till and alluvial sand used for an impermeable cutoff and horizontal drainfilter,respectively.The data were also used in order to assess the geophysical ability to resolve the internal basal concrete conduit associated with the dam’s outlet works.Dam Site2,located in southern Kentucky,was constructed dur-ing the mid-and late1960s,and consists of a rock-fill dam,earthen dike,gate-controlled outlet works,and an open-cut spillway between the dike and dam.The dike is the structure of interest for this study(Fig.1(b)).It is an appurtenant impoundment dam 595m in length and approximately31m in height,founded directly on Mississippian limestone.The SH-wave seismic-reflection transect was collected orthogonal to the centerline and atop the near-vertical zonated backfill in an excavated notch just above the base of the right dike abutment(Fig.1(b)).These data were used to evaluate the effectiveness for geophysically imaging a concrete bulkhead cutoff,the excavated notch rock surface,and the engineered material zonation used in the backfill.3.MethodsPioneering research associated with near-surface high-resolution seismic-reflection imaging primarily incorporated pri-mary wave(P-wave),or compressional wave,energy,because of the higher frequency characteristics and operationalcontrolFig.1.Two earthfill embankment dams in the central United States were imaged with SH-wave seismic-reflection techniques to evaluate this method’s ability to distinguish small,high-impedance engineered features(i.e.,concrete conduits and bulkheads),as well as larger,low-impedance boundaries such as those separating in situ geologic sediment and compacted engineered backfill that uses equivalent local borrow material.(a)Dam Site1and(b)Dam Site2are located in northern Indiana and southern Kentucky,respectively.(Source:Google Earth,2016)E.W.Woolery/Engineering4(2018)694–701695offered by the various weight-drop,projectile,and vibratory sources(e.g.,Refs.[4–8]).However,a groundwater masking effect can be problematic for P-wave energy that is used to image the solid matrix in subsurface environments where relatively low-velocity geologic media and their elastic impedance are water-saturated,such as the unlithified sediment generally found in the near surface of activefluvial and alluvial environments.The hori-zontally polarized shear-wave(SH-mode)common-midpoint (CMP)method has subsequently proven an amenable alternative for imaging these low-velocity,water-saturated,near-surface con-ditions((100m)(e.g.,Refs.[2,9–18]).Shear waves can be more responsive for near-surface imaging because they are‘‘framework waves”(i.e.,not subjected to groundwater masking),and thus propagate with the solid media relative to thefluid-sensitive P-wave.The SH phase is theoretically easier to identify,unlike vertically-polarized shear-wave(SV-mode)signals,because of the lack of mode conversion at ideal impedance boundaries[19].Rela-tive to P-wave energy,the lower velocity SH-wave has an optimal spatial window at the nearer offset;it also expands the temporal separation between the reflecting boundaries[20].An increased temporal window permits more distinct,accurate identification of the reflecting boundaries that result from the larger separation between the signal and coherent noise events,while the nearer off-set optimal recording window decreases the potential for introduc-ing adverse wide-angle-reflection effects.More importantly, however,experience shows that although SH-waves commonly have frequency content only one-half to one-third that of P-waves,the velocities of P-waves are5to10times higher than those of SH-waves;therefore,resolution commonly improves by a factor of two to three when using SH-waves[14,20].This is a very important point when considering relatively small subsurface tar-gets.For example,the major reflection horizons observed for the data presented herein have an average velocity range of220–400mÁsÀ1,and a dominant frequency of approximately50Hz.This yields a temporal resolvable limit(i.e.,calculated by the one-quarter wavelength criteria[19])ranging between1.1and2.0m. The detectable limits are considerably smaller(i.e.,k/8–k/20).The spatial resolution of the reflecting horizons is constrained between approximately two and four shot points,based on the radius of the first Fresnel zone[19].In addition to overall varying targets and objectives requiring varying acquisition parameters,the seismic data collection at the two dam sites occurred several years apart;as a result,there was a deployment of different recording systems.The Site1survey used a Geometrics StrataViewÒ48-channel engineering seismo-graph and two inline spreads of24and30Hz,with horizontally polarized Mark ProductsÒgeophones with7.5cm ground spikes. The seismograph was a24-bit system with an instantaneous dynamic range of115dB.The sampling interval was0.5ms,and a25Hz low-cut acquisitionfilter and a250Hz high-cut anti-alias filter were used.Due to several nearby electrical power sources,a60Hz notchfilter suppressed potential unshielded noise.The shear-wave energy source was a modified section of steel H-pile ($11kg)struck horizontally with a4.5kg sledge hammer.The hold-down weight of the H-pile was between approximately70 and80kg,including the weight of the hammer swinger and the H-pile section.The H-pileflanges and hammer swings were per-pendicular to the geophone spread for SH-mode generation.The flanges were in prepared slit trenches in order to resist movement and maximize the energy couple with the ground.The geophones in the two inline spreads were spaced at2m intervals,for a total spread length of96m.The production survey maintained a2m near offset between the end-on shot point and thefirst active geo-phone.Example processing steps for the pre-stackfield gathers are given in Fig.2.These seismograms consist of two sets of three con-secutive datafieldfiles collected near thefirst and last parts of the survey.The primary reflection events had a two-way travel time (TWTT)of70–300ms.The Site2SH-wave seismic-reflection data were collected with two24-channel Geometrics GeodeÒseismographs,and with a geo-phone array similar to that used in Site1but with1m spacing.The instrumentalfidelity was equivalent to the seismograph used at Site1,but was controlled with a separate laptop computer.Data sampling at Site2occurred at0.25ms intervals.The digital acqui-sitionfilters included15Hz low-cut and60Hz notchfilters.The shear-wave energy source was similar to that used in Site1,but involved a smaller H-pile(3kg)and hammer(0.9kg).Fig.3shows processing steps for the example pre-stackfield gathers at Site2. These are three single gathers that were selected from near the beginning,middle,and end of the survey.Each SH-wave survey used instrumental polarity reversals and correlative reverse hammer impacts on both sides of the energy source for each shot point.This ensured correct identification of the SH-wave energy and decimated P-wave contamination.In addition,hammer blows were stacked(or linearly superimposed) between four and six times per shot point.Both sites realized min-imal acquisition downtime;however,work was suspended during prolonged wind gusts and/or passing traffic.Data acquisition parameters for the two sites are in Table1. Although it is generally preferable not to apply acquisitionfilters, the local conditions provided justification for the partial use at the two sites.The processing for both data sets was on a personal computer using the commercially available VISTA seismic data processing software,versions7.0and13.0,along with a conven-tional shallow CMP processing sequence.The primary signal pro-cessing steps focused on coherent noise muting,digitalfiltering, trace editing,appropriate trace balancing,and careful correlation statics for improving the pre-stack quality of the events seen on the rawfieldfile.This is a minimal,but acceptable,approach for processing shallow seismic-reflection profiles[21,22].These standard near-surface data-processing procedures are similar to those used in the petroleum industry,but appropriatelyscaledFig.2.Example Dam Site1fieldfiles:two sets of three consecutive datafieldfiles collected near thefirst and last parts of the survey.(a)Raw/spherical-gain corrected data;(b)trace-killed/muted/filtered data;(c)normal moveout corrected data.696 E.W.Woolery/Engineering4(2018)694–701and conservatively applied.No other shallow-reflection processing (i.e.,deconvolution,migration,etc.)were applied because of the insignificant signal quality improvement.4.Results 4.1.Dam Site 1The 12-fold,788m long,east–west SH-wave seismic-reflection image was parallel with the dam’s centerline and along the down-stream edge of the embankment crest (Fig.4).The profile provides subsurface coverage across the right half of the dam (i.e.,between the right abutment and outlet works).The uninterpreted and inter-preted images,along with a borehole-derived geologic profile for correlative assistance,are provided in Fig.5.Trace numbers along the top of the reflection profiles are at 100m intervals.In general,the data quality is good along the entire length of the profile.This was somewhat surprising,because significant noise was associated with the reservoir water discharge from the downstream outlet works.The relatively high-frequency shear-wave geophones may have acted as a pre-emphasis filter,minimizing the record contam-ination.The continuous,relatively coherent,large-amplitude reflection (doublet)visible between 150and 300ms TWTT (i.e.,$24and 53m depth)across the profile is the top-of-bedrock unconformity [3].This reflection event provides a clear image of the terraces and former river channel.The previous interpretation for the abrupt loss of coherency at two locations in the ‘‘bright”bedrock reflector (Fig.5)was karst solutioned joints and/or cavity collapse [3].The associated seismic-derived depths to bedrockwere within 5%of those expressed in the geologic profile.A bore-hole targeted the karst interpretation at approximately trace num-ber 410,and found 6.5m lower-than-expected top-of-rock elevation from the geologic profile [3].The borehole observations found a 6.5m interval below the expected top-of-rock consisting of very soft foundation material (i.e.,N -values <5),a primary indi-cator of karstic cavity fill likely formed from embankment ‘‘piping.”In addition,during excavation operations for the final remedial positive cut-off wall constructed through the limestone foundation and keyed into a lower shale unit,mature karst solution features were found in both anomalous areas identified in the initial interpretation.yNumerous intra-embankment reflectors are also apparent;these horizons agree reasonably well with the areas and elevations of engineered fill and in situ foundation soils described in the borehole-derived profile (Fig.5).Of particular note is the steeply dipping reflector observed between traces 225and 600,which is visible between TWTTs 70and 150ms.This event correlates with the boundary separating the engineered fill and glacial till inter-preted in the borehole-derived geologic profile.The ‘‘onlap”char-acteristic of the shallow intra-embankment reflection just above the in situ till boundary near trace 250(and $100ms TWTT)is interpreted as emplaced engineered backfill abutted with the in situ till (Fig.5).Although the borehole logs mention weathering being observed in the shallow till,the final geologic profile for the design document does not explicitly interpret a weathered zone for the till.A slightly steeper dipping reflector just beneath the inter-face is interpreted here as the base of the weathered zone.This zone may indicate a colluvial wedge.Other discontinuous reflec-tors appear within the till,and may represent the scattered sand and gravel bodies described in the geologic profile;however,this is speculative,and additional corroboration is required to verify these interpretations.The interpreted package of reflectors within the old river channel is the in situ alluvium that was left to act as a horizontal drain.The far-west side of the channel has a steeply ris-ing reflector,and correlates with the onset of the outlet works in the as-built reports.A relatively strong shallow reflector is present between $80and 90ms TWTT,but appears to be discontinuous,likely due to the top muting.This horizon may correlate with the top of the vertical ‘‘chimney”drain constructed on thedownstreamFig.3.Example Dam Site 2field files:three data files collected near the beginning,middle,and end of the survey.(a)Raw data;(b)filtered/balanced data;(c)top-mute corrected data.Note the normal (image (a))and reverse (image (c))moveout ringing below 200ms TWTT in the gathers;this is probably offline noise associated with the excavated notch and/or the dike’s upstream and downstream free face.Table 1Acquisition parameters and general signal processing procedures for the CMP seismic-reflection surveys at Sites 1and 2.Field parameters Site 1Site 2Source4.5kg hammer with 11kg H-pile 0.9kg hammer with 3kg H-pile Acquisition low-cut 25Hz 15Hz Acquisition high-cut 250Hz Out Geophone 30Hz 30Hz Near offset2m 1m Group/shot interval 2m 1m Sample interval 0.5ms 0.25ms Fold126Vertical stack44yKenneth Henn,United States Army Corps of Engineers,2010,personal communications.E.W.Woolery /Engineering 4(2018)694–701697Fig.4.Footprint of the Dam Site 1embankment overlying original topography (modified from Ref.[3]).The northeast–southwest-oriented heavy line,between station labels 25+00and 50+85,indicates the location of the reflection profile along the crest,just downstream of the centerline.The beginning and ending traces are also shown,along with their corresponding stationing.SI-3is the instrumentation well that was used for the Woolery [3]downhole seismic test.Note the old river channel crossing beneath the southwest end of the profile.Also note that the outlet conduit was located at the southwest edge of the old channel.Sta:station.Fig.5.(a)Geologic profile constructed from design and post-construction phase borehole information;(b)the interpreted SH-wave seismic-reflection image;(c)the uninterpreted image.(Modified from Ref.[3])698 E.W.Woolery /Engineering 4(2018)694–701side of the crest (Fig.6).A reduced aperture for the acquisition array would be necessary to better image this feature (i.e.,contract the shallow muted zone)and corroborate the interpretation.Nev-ertheless,the overall interpretive evidence suggests that the origi-nal as-built geologic profile for the project was well constrained,and is a reliable source of geotechnical detail for most subsequent remedial design actions.4.2.Dam Site 2Acquisition of the six-fold,37m long,SH-wave seismic-reflection subsurface image was orthogonal to centerline,approx-imately 10m inside the Site 2dike’s right abutment.The ground-surface elevation is approximately 229m above mean sea level (AMSL),and the first subsurface image point was located 14m upstream of the dike centerline,with the terminal point 23m downstream of the centerline (Fig.7).This location is the as-built location that was given in the change order for a concrete bulkhead to act as a positive cutoff for potential seepage through a large karst conduit discovered in the right abutment (Fig.7).The loca-tion is set back approximately 15m into the excavated notch from the originally planned location.The top-of-rock profile,determined from design through post-construction drilling programs,shows the irregular nature of this horizon (Fig.7).Also shown is the orig-inal planned location for the bulkhead cutoff.Note the highly irreg-ular or ‘‘pinnacled”top of limestone that is typical of a mature karstic environment.More importantly,the large subhorizontal solution conduit,which was discovered during design drilling investigations and confirmed during construction excavation,had the potential to provide an uncontrolled seepage path of reservoir water through the impoundment structure.The emplaced bulk-head acted as a positive cutoff;however,the as-built location was set back further into the abutment notch because of the highly weathered poor rock quality found at the original planned location.Fig.8is a simplified design schematic for the zoned engineered backfill in the excavated abutment notch.The elevation for the base of the notch,top of bulkhead,and abutment ground surface (at the survey location)is 214,217,and 229m AMSL,respectively.The final uninterpreted and interpreted Site 2reflection profile is provided in Fig.9.The profile consists of 74seismic traces spaced 0.5m apart.The notch clearly exhibits a synformal reflection event between seismic traces 7and 61,and between 65and 135ms TWTT.The six horizontal relatively large-amplitude reflection wavelets visible between seismic traces 25and 35,and at 135ms TWTT,is the notch ing a shear-wave velocity of 220m Ás À1,this places the base of the notch approximately 15m below ground surface,verifying the as-built elevation (i.e.,214mAMSL).The bedrock surface outside the notch appears to be undu-lating but relatively coherent.A prominent ‘‘bright”reflection (i.e.,higher relative frequency and larger amplitude)manifests within the engineered backfill material and notch interior.This is evident between seismic traces 28and 33,and at 100ms TWTT.This reflec-tion is from the top of the concrete bulkhead cutoff.The 220m Ás À1shear-wave velocity yields a depth of 11m for this reflector,which is approximately equivalent to the as-built recorded elevation (i.e.,217m AMSL).The ability to noninvasively verify the recorded as-built location without advancing one or more invasive boreholes minimized the potential for compromising the bulkhead’s cutoff integrity.However,it is also notable that there are no observable signal variations distinguishing between the clay core,sand filter,and rock shell.Truncation of the seismogram was below 200ms TWTT,because of no target interest and multiple contamination (i.e.‘‘ringing”)that was likely associated with the fill/rockinterface.Fig.6.Cross-sectional view of the embankment at approximately Station 41+00(Fig.5).This shows the approximate location of the phreatic surface and its intersection with the vertical ‘‘chimney”drain.Discharge of controlled seepage is through relief wells along the downstream ‘‘toe”of thedam.Fig.7.The inset (top)is a map view of the design and as-built locations for the concrete bulkhead.The green line is the original planned location for the bulkhead,and the red line shows the setback location and SH-wave seismic-reflection profile.The top-of-rock profile (bottom)shows the highly varying rock surface,indicative of a mature karstic environment.The original planned location for the concrete bulkhead is where the solution conduit intersects the rock-embankment boundary.The bulkhead was set back to more favorable rock conditions during construction.E.W.Woolery /Engineering 4(2018)694–7016995.ConclusionsSolving geotechnical problems with traditional geotechnical exploration (i.e.,drilling)can be inefficient and often inadequate at high-hazard earthfill embankment dams [16];however,near-surface geophysical exploration using the SH-mode seismic-reflection method to supplement invasive drilling has improved the geotechnical assessment of two earthen flood-control damsin the central United States.The cost-effective,noninvasive,SH-wave seismic-reflection surveys clearly identified the bedrock foundation at both dam sites,as well as many primary intra-structural features.Prior to performing the survey at Site 1,it was uncertain whether the seismic-reflection method could phys-ically resolve the contact separating the engineered fill and the in situ geological sediment (i.e.glacial till)used for part of the impermeable cutoff,because the fill consisted of a compacted local ‘‘borrow”of the equivalent glacial till.However,the seismic-reflection survey showed that sufficient impedance does exist between the in situ glacial till and the compacted fill to provide a coherent reflected signal.A more subtle impedance boundary was also observed beneath the fill-till boundary.This reflection was a weathering boundary or colluvial wedge in the in situ glacial till.The in situ alluvium in the former river channel also provided measurable elastic contrast.At Site 2,an image of the notch exca-vation in the abutment bedrock was clear;however,discriminating the vertical zonation for the engineered fill in the excavated notch was unsuccessful.In addition,the resolution of the SH-wave seismic-reflection signal permitted the imaging of relatively smal-ler engineered features,including a concrete bulkhead cutoff at Site 2and part of the outlet works conduit at Site 1.These results corroborate the supposition that high-resolution SH-mode reflec-tion surveys are a viable tool for evaluating dam safety issues,as well as other geotechnical problems in earthfill embankment dams.References[1]Federal Emergency Management Agency.Federal guidelines for dam safetyrisk management Report.New York:Federal Emergency Management Agency;2015.[2]Nunnally SW.Construction methods and management.8th ed.Upper SaddleRiver:Prentice Hall;2011.[3]Woolery EW.SH-wave reflection images of anomalous foundationconditions at the Mississinewa dam,Indiana.J Environ Eng Geophys 2002;7(4):161–8.[4]Steeples DW,Knapp RW.Reflections from 25feet or less [expanded abstract].In:The 52nd Annual International Meeting and Exposition,Society of Exploration Geophysicists;1982Oct 17–21;Dallas,TX,USA;1982.p.469–71.[5]Hunter JA,Pullan SE,Burns RA,Gagne RM,Good RL.Shallow seismicreflection mapping of the overburden-bedrock interface with the engineering seismograph—some simple techniques.Geophysics 1984;49(8):1381–5.[6]Pullan SE,Hunter JA.Seismic model studies of the overburden-bedrockreflection.Geophysics 1985;50(11):1684–8.[7]Knapp RW,Steeples DW.High-resolution common depth point seismicreflection profiling,instrumentation.Geophysics 1986;51(2):276–82.[8]Knapp RW,Steeples DW.High-resolution common depth point seismicreflection profiling,field acquisition parameter design.Geophysics 1986;51(2):283–94.[9]Goforth T,Hayward C.Seismic reflection investigations of a bedrock surfaceburied under alluvium.Geophysics 1992;57(9):1217–27.[10]Woolery EW,Street RL,Wang Z,Harris JB.Near-surface deformation in theNew Madrid seismic zone as imaged by high resolution SH-wave seismic methods.Geophys Res Lett 1993;20(15):1615–8.[11]Woolery EW,Wang Z,Street RL,Harris JB.AP-and SH-wave seismic reflectioninvestigation of the Kentucky Bend scarp in the New Madrid seismic zone.Seismol Res Lett 1996;66(2):67–74.[12]Woolery EW,Street RL,Harris JB,Wang Z,McIntyre J.Neotectonic structure inthe central New Madrid seismic zone:evidence from multi-mode seismic-reflection data.Seismol Res Lett 1999;70(5):554–76.[13]Woolery EW,Baldwin J,Kelson K,Hampson S,Givler R,Sundermann S.Site-specific fault assessment in the fluorspar area fault complex western Kentucky.Seismol Res Lett 2009;80(6):1035–44.[14]Harris JB.Shear-wave splitting in Quaternary sediments:neotectonicimplications in the central New Madrid seismic zone.Geophysics 1996;61(6):1871–82.[15]Deidda GP,Balia R.An ultrashallow SH-wave seismic reflection experiment ona subsurface ground model.Geophysics 2001;66(4):1097–104.[16]Woolery E,Street R.Quaternary fault reactivation in the fluorspar area faultcomplex of western Kentucky:evidence from shallow SH-wave reflection profiles.Seismol Res Lett 2002;73(5):628–39.[17]Benjumea B,Hunter JA,Aylsworth JM,Pullan SE.Application of high-resolutionseismic techniques in the evaluation of earthquake site response,Ottawa Valley,Canada.Tectonophy 2003;368(1–4):193–209.Fig.8.Idealized design cross-section of the notch and zoned backfill.The white dashed line is the as-built top of the cutoff,at 217m AMSL.The bottom of the notch is at 214m AMSL.The SH-wave seismic-reflection profile was over the as-built location,at Station À0+15.Ground elevation is approximately 229mAMSL.Fig.9.The (a)uninterpreted and (b)interpreted SH-wave seismic-reflection profile across the backfilled notch on the dike’s right abutment.Trace numbers refer to the subsurface sample points,and trace separation is 0.5m.The red line is the interpreted notch and the orange zone marked by the high amplitude reflectors at 100ms TWTT is the top of the concrete bulkhead.The calculated elevations for the base of the notch and the top of the bulkhead correlated well with the as-built descriptions.700 E.W.Woolery /Engineering 4(2018)694–701。