最大功率点跟踪英文文献翻译
- 格式:pdf
- 大小:953.94 KB
- 文档页数:8

0. INTRODUCTIONSThe research on the solar battery photovoltaic output characteristics has an important significance in some aspects, such as in – depth exploration of photovoltaic power generation mechanism and the development of the application of solar energy technology. Analyzing the change of parameters ,such as diode ideal factors(A)、series resistor(Rs)and shunt resistance(Rp),has an effect on the photovoltaic output characteristics ,and then research the change law of the photovoltaic output characteristics under any light intensity (light intensity) and environment temperature (environment temperature),which plays a guiding role for improving the utilization of solar energy methods and the development of a more efficient energy conversion device [1].At present, the equivalent circuit which contains diode and the Series-parallel resistance is a more accurate photovoltaic output characteristic mechanism model. But, as the strong light and temperature changes, the A, Rs and Rp changes. The Model is a nonlinear function with the parameters changes. It is difficult to solve the model parameters and calculate the maximum power point directly. What’s more, most of the existing documentation methods are the use of standard test conditions data provided by manufacturer, through simplifying photovoltaic characteristics equation approximately, only can solve model parameters under standard test conditions simultaneously, can’t beextended to arbitrary light intensity and temperature conditions [2-3].Through analyzing A, Rs, Rp parameters which affect photovoltaic output characteristics law, this paper gives a method based on parabola extreme point to solve out maximum power point directly . Then, using maximum power point calculation process data, we build photovoltaic characteristics model parameters to solve out equation, obtain photovoltaic characteristic curve under arbitrary light intensity and temperature. Finally, aiming at the four types of solar batteries, we carry out experimental validation, error results get from calculation and analysis to prove the effectiveness of the methods.1. The analysis of model parameters affecting the photovoltaic output characteristicsIn the condition of light, solar battery photovoltaic output can be regarded as diode characteristic approximately. With the voltage changes, the current changes exponentially, we can get the relationship between the current and voltage of the output characteristics from literature[4], as is shown in equation (1):()()-e1]s q U IR s AKTph o pU IR I I I R ++=--[ (1)In the equation, I: Output current (A), U: Output voltage (V), Iph: Light born current (A), Rs: Series resistance (Ω), Rp: Parallel resistance (K Ω), A: Diode ideal constant, Io: Diode reverse saturated leakage current (A),q: charge quantity, K: Boltzmann constant, T: Environment temperature (℃).Under the short circuit conditions, U = 0 ,I = Isc ,because the low voltage can not reach the diode turn-on voltage, the current is tiny, so that sc ph sc s pI I I R R =-;Under the open conditions, U = Uoc ,I = 0 ,Thereis()(e1)ocqU AKTo ph oc p I I U R =--[5-6]. According to short and open conditionscircuit, we can get (2)-(3):(1)ph sc s P I I R R =+(2)()oc qU oc sc sAKTo sc pU I R I I eR --=-(3)Arrange (1)-(3),both sides of the equation multiply the output voltage simultaneously, we can get P-U output characteristic equation that only contains A, Rs and Rp parameters ,as shown in (4) and get the regular that the parameters affect the P-U curve ,as shown in figure 1.Fig.1 Influence results between model parameters to P-U characteristic curvesThe analytical result of figure 1 shows that open circuit voltage Uoc affects the endpoint location of P-U characteristic curve, ideal constant A of diode affects the curvature of the curve, series resistance (Rs) affects the rake ratio of the end segment of curve, and parallel resistance (Rp) affects the rake ratio of the initial segment of the curve. The photovoltaic array is made up of the parallel battery unit series, and the A, Rs and Rp parameters also has the characteristics of series and paralleling, this article only researches the sampling process of the battery unitparameters.According to the equivalent circuit characteristics, we define the parameters range that A ∈ [1, 2], Rs, ∈ [0, ∞] Rp ∈ [∞, 0] under the limit state. we substitute the Isc and Uoc, and the upper and lower limit data of the model parameters into (4), then can get P-U boundary curve, as is shown in dotted line of figure 2, the solid part of the line are the P-U curve under any A, Rs and Rp parameters conditions, and that it must be included in the boundary curves.Fig.2 Boundary sketch including P-U characteristic curves with mutative modelparameters2. Direct calculation of the maximum power point under any light intensity and environment temperatureThis paper uses parabolic extremal solution, get the maximum power point data that under any light intensity and environment temperature[7-8], ①Through detecting the current open circuit voltage and short circuit current, we can solve out the maximum power point of the two border P-U curves; ②basing on up per and lower boundary curve ‘s reference voltage and through defining step length, we can define 2 ~3 point near current maximum power point, and detect its output power;③Making use of three voltage/power data, we can solve the parabolic equation parameters and the extreme points, and obtain the current maximum power point finally. It is the key to ensuring the effective application of this method to prove that the part of P-U curve near the maximum power point meets the parabolic characteristic and parabolic extreme points is the maximum power point. Figure 3 depicts the process that P-U characteristic curve defines the step length under arbitrary A, Rs and Rp.(a)The process that amorphous silicon with arbitrary model parameter P-U characteristic curve(b)The process that crystalline silicon with arbitrary model parameter P-Ucharacteristic curveFig.3 Defines step of P-U characteristic curves with arbitrary model parametersBecause (4) is the implicit function equation that P is on U, In order to get the maximum power points (P and P* )of the two boundary curves, we lead into Lambert W function to convent the (4) into explicit equation ,then solve out the results. Lambert W function isexp()ax b cx d +=+, and the analysis resolution is1[exp()]b c ad cb x W a c a a -=---therefore, through transforming (4), we can get2[()]()sc s p s psUI R R U AKTUP W Y R R qR +-=-+(5),In which[()]()()()[()]exp{}()s sc s p oc s p s p oc s sc s p s p qR I R R U Y AKT R R q R R U U qR U I R R AKT R R +-=++---++So ,in the maximum power point hasmU U dP dU == ,thus ,obtain maximumpower point voltage, as is shown in(6)[]()[1()]2[1()]()s sc s p m m s m p m qR I AKT R R W Y U qR W Y qR W Y -++=++(6)Aiming at the #1and #2 boundary curves in figure 3,substitute Isc 、Uoc 、A 、Rs and Rp ,we can get the maximum power point Pm(P and P*)of the boundary curves and voltage Um (U Q and U O *),as is shown in tableTable 1 Calculation results of model parameters and maximum power pointcurveI sc /MA U oc /V A R s /Ω R p /Ω U m /VP m /MW1#upper boundary curve35.300.5881∞0.51 17.14 1#lower boundary curve 2 ∞0.25 0.85 2#lower boundary curve 33.32 0.4491 0∞0.37 11.28 2#lower boundary curve2∞0.230.50Considering the difference of battery unit materials ,the maximumpower points of various types of P-U curves may be in two sides of *PPin figure 3, in order to guarantee the point beside the maximum power point and a part of the curve accord with the characteristic of parabola ,according to reference voltage U Q , give the step length definition algorithm ,shown as follows: owing to the characteristic of triangle has**()Q Q O Q O P P U U U U P P--=-- therefore, define the step length of point voltageas[()]0,1,2,3step Q Q O n mU U U U nm -=--=±±±in which ,n is the number of Partitionrange, m is the number of quasi acquisition power point.According to the experience ,we can determine the n ,make the lesser range curve beside the maximum power point accord with the characteristic of parabola. If m is zero, the point is in the segment *PP .Ifm is positive number ,the point is on the right of the segment*PP ,oron the left. In the light of the part P1Q1~P3Q3 of the real P-U curves in figure 3,take advantage of (7) to define the step length, in order to get three groups data of power point closed to the maximum power point . Then build parabola equation and solve the ratio of the equation. Through checking whether maximum power point is in parabola or not,we prove that the curve near the maximum power point accord with the characteristic of parabola. Results is shown in figure 4.Fig.4 Demonstration results of P-U curves fit on parabolic curve characteristicas figure 4 shows that three groups of power point data defining the step length meet the parabolic equation, and the maximum power point is in the parabola, therefore we can prove that the curve near the maximum power point accord with the characteristic of parabola. Besides because P-U characteristic curve in the maximum power point meetsmU U dPdU == .Parabolic equation in extreme point meets20dyax b dx=+=.So, extreme point of the parabola is the maximum power point of P-U characteristic curve. Therefore, making use of the three power point data(Um,1, Pm,1)、(Um,2, Pm,2) and (Um,3, Pm,3) got from defining the step length ,we can solve out the ratio (a,b,c) of the parabola ,then solve out the extreme point of the parabola and acquire maximum power point(Um, Pm) under the intensity of light and the environment temperature at present.3. Solving out the model parameter of the solar photovoltaic output characteristicBecause maximum power point accords with the characteristic of equation P-U, so we can get (8) from (4):22()()()m m m s oc m mm s sc s p mq U P R U U AKTU oc m sc s p m U P R I R R U U U I R R U e+-+-+=-+ (8)According to the solar photovoltaic output characteristic , the maximum power point has 0mU U dP dU ==.We can get equation(9)fromfirst-order derivative of(4),2()22()()m m s oc m mmq U P R U U oc sc s sc p AKTU m s p mm s q U I R I R eAKTP R R U P R U +---+-=-(9).The data of checking point near the maximum power point not only accords with the characteristic of P-U, but also meets parabola equation. Therefore, according to 1()2m U U dP d UI dII U aU b dUdU dU===+=+, we can get (10)shown as follows:,11,1,1,1()()2ps p s sc m m m m m AKTR qR AKT q R R I I U U aU b I +++--=-+-(10)According to equation(8),(10), besides short circuit equation(2) and open circuit equation(3), we construct 5 closed algebraic equation containing the Iph ,Io, A, Rs, and Rp parameters, then through making use of Isc, Uoc ,(Um,1, Pm,1) acquired from testing and four groups of the maximum power point data acquired from calculation by parabola method, we can solve out the model parameter of the solar photovoltaic output characteristic under the arbitrary intensity of light and environment temperature, shown as follows (11)},1,1,1,1,1,1,1,1(1)()()ln[()](()())[(()1)][(2)][()](2)[()ocph sc s P qU oc sc s AKTo sc p m m s oc sc m sc sm m oc m m m s m th s sc m m p m m th s sc m I I R R U I R I I e R A U I R V K T I I I R U W Z U W Z U W Z I aU b I R U AV R I I U R aU b I AV R I I -=+-=-=+⨯-⨯-=-⨯+⨯+⨯+-++--=-+-+-,1,1]()]m sc m U I I ⎧⎪⎪⎪⎪⎪⎨⎪⎪⎪⎪+-⎪⎩(11)In whichth KTV q =[()])]m sc m sc m sc Z I I I I I I =--4. Experimental verification and error analysisMaking use of four kinds of actual measurement data of solar battery unit provided by literature [10-13] ,besides adopting the method put forward by this text ,we can solve out the maximum power point and model parameter ,then checking their reliability and effectiveness. Literature data, maximum power point and calculation results of characteristic parameters of four kinds of Solar batteries in standard test conditions (G=1000W/m2, T=25℃) is shown in Table 2.Table 2 calculation results of characteristic parameters with standardnSe 51 63 2 54 62 0-10 18 8 15 a-SiC 27.10.54824.480.44023.720.43727.164.87×10-91.380.55231.56SiO 216.80.51614.30.40514.530.40016.861.99×10-81.481.38356.21 Through analyzing the results of table 2, we can know that the actualmeasurement data of literature ties better in with maximum power point acquired from calculating by the method of this text. The change impact of light intensity and in the nonstandard intensity of light and environment temperature conditions reflects the change of solar photovoltaic characteristic curve most obviously; it also affects the five model parameters. In the light of four kinds of solar battery unit, we solve out I-U characteristic and model parameters in the nonstandard conditions. The calculation results as shown in Table 3,Simulation and analysis of the change regularity as shown in Figure 5Table 3 Calculation results of characteristic parameters with non-standard conditionsSiliconIsc/m A Uoc/VIm/mAUm/VIph/AIo/A ARs/ΩRp/Ω20.29 0.548 18.44 0.452 20.3 6.67×10⁻¹ 1.20.42 736.823.32 0.49621.51 0.391 23.33 1.13×10-81.430.25896.3629.27 0.51926.17 0.429 29.34 3.36×10-91.260.36924.2225.22 0.51823.30 0.413 25.23 5.10×10-91.310.29609.12CulnSeIsc/m A Uoc/VIm/mAUm/VIph/AIo/A ARs/ΩRp/Ω19.40 0.419 17.47 0.33219.41 2.97×10-81.220.42823.1526.59 0.37624.37 0.288 26.61 6.26×10-81.130.51956.3924.53 0.35622.64 0.265 24.55 7.32×10-81.090.65789.5431.00 0.33527.22 0.240 31.04 1.57×10-61.320.73599.87a-SiCIsc/m A Uoc/VIm/mAUm/VIph/AIo/A ARs/ΩRp/Ω23.29 0.520 20.25 0.430 23.3 1.41×10⁻⁸ 1.40.47 431.516.10 0.437 14.31 0.33516.11 1.99×10-71.510.35605.7518.30 0.41815.95 0.314 18.32 4.13×10-71.530.38379.4225.30 0.35720.38 0.276 25.32 4.49×10-61.620.22254.75SiO2Isc/m A Uoc/VIm/mAUm/VIph/AIo/A ARs/ΩRp/Ω9.58 0.476 8.27 0.371 9.60 4.18×10-81.46 0.09656.2110.38 0.4358.72 0.329 10.41 2.41×10-71.60.24409.7615.10 0.45212.92 0.345 15.14 1.80×10-71.560.13432.0712.50 0.41710.68 0.306 12.55 2.82×10-71.530.35374.95Through analyzing the results of table 3 and figure 5, we can know that the actual measurement data of literature ties better in with mode calculation curve. As to four I-U curves of all kinds of solar battery units, all the measured data points have : relative error =| theoretical result -- the actual measurement data of literature | /the actual measurement data of literature. Calculate voltage error is based on standardized current, and its maximum result is regarded as voltage maximum error, otherwise, give the maximum current error. In table 4 are the Silicon, CulnSe, a-SiC and SiO2 solar cell unit error analysis results.Table 4 Error analysis between calculation results and literature data for solar cellsnumber Silicon CulnSe a-SiC SiO2maximumerror voltage current voltage current voltage current voltage current① 1.95% 1.75% 1.84% 1.51% 1.98% 1.65% 1.32% 1.76% ② 1.54% 1.59% 1.98% 1.49% 1.49% 1.23% 1.84% 1.43% ③ 1.8% 1.47% 1.95% 1.86% 1.58% 1.43% 1.99% 1.23% ④2.0%1.60% 1.90% 1.77% 1.82% 1.32% 1.74% 1.42%Through analyzing the results of table 4, the actual measurement data of literature ties better in with theoretical curve, all the error is below 2%.The main reason why causing error are: ①when structuring parameters to solve out the equation set, Io is regarded as zero approximately in equation (2)The solar photovoltaic t characteristic beside short circuit point can be approximated as a constant current source under short circuit conditions. ②e1eococ qU qU AKTAKT-≈③On the maximum power point, we regard the curve as parabolic characteristic approximately. Above all the approximations, through the theoretical analysis, it is reasonable. The error results show that it is within the range of permission, it can satisfy the engineering precision requirement.5. ConclusionsThrough analyzing the parameters of diode ideality factor, series resistor and a shunt resistor, this text puts forward a method based on parabola extreme point to solve out the maximum power point for the regularity of solar photovoltaic output characteristic; in addition we construct photovoltaic model parameters to solve the equation set. According to results acquired from comparing theoretical arithmetic with the actual measurement data of literature and error analysis results , we prove the method's validity and accuracy, after further simplify the calculation process and steps, it can satisfy the engineering precision requirement.。
电力系统中的最大功率点追踪算法优化研究电力系统是现代社会中至关重要的基础设施,能源的高效利用一直是一个研究热点。
最大功率点追踪(Maximum Power Point Tracking,MPPT)算法作为一种能够提高光伏发电系统效率的技术,一直受到学术界和工业界的广泛关注。
本文拟进行电力系统中的最大功率点追踪算法优化研究,旨在提出更加高效且可靠的算法,从而进一步提升电力系统的发电效率。
首先,我们需要了解最大功率点追踪算法的基本原理。
在光伏发电中,光照强度的变化会导致光伏电池的工作电压和电流发生变化,进而影响到系统的输出功率。
最大功率点追踪算法的目标就是使得光伏发电系统能够根据光照强度的变化,实时调整工作电压和电流,以保证系统输出功率始终接近于最大功率点。
常见的最大功率点追踪算法有全局搜索法、开环扫描法、模拟频率鼠标追踪法等。
然而,现有的最大功率点追踪算法仍然存在一些问题和挑战。
首先,传统的算法通常以固定的步长进行搜索,而不能根据光照变化的情况来灵活调整步长,因此可能存在追踪速度慢、精度不高等问题。
其次,并不是所有的算法都能适应不同光照环境下的最大功率点追踪,一些算法在部分光照条件下可能会失效。
此外,传统算法对于噪声信号的干扰比较敏感,容易导致功率点追踪不稳定。
因此,优化最大功率点追踪算法以解决这些问题显得尤为重要。
为了优化最大功率点追踪算法,在本文中我们提出了一种新的增量阻抗算法。
该算法通过分析光伏电池的电流和电压特性曲线,根据最大功率点的特点来确定阻抗的调整方向和步长。
与传统的固定步长搜索算法相比,该算法能够更加有效地追踪最大功率点,提高系统的效率。
此外,该算法还具有较快的响应速度和较高的稳定性,能够适应不同光照环境和不同负载条件下的功率点追踪。
在实验部分,我们以光伏发电系统为例,对比了提出的增量阻抗算法与传统的P&O算法(Perturbation and Observation)和模拟频率鼠标追踪法的效果。
本文由fanxiaolei1103贡献pdf文档可能在WAP 端浏览体验不佳。
建议您优先选择TXT ,或下载源文件到本机查看。
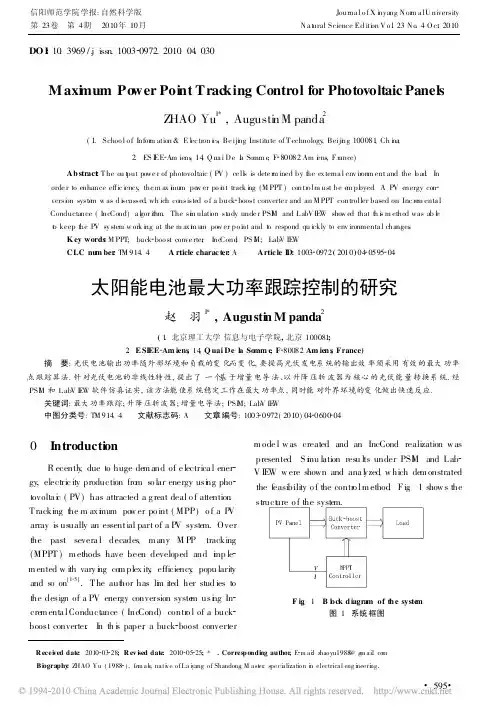
第43卷第ll期2009年11月电力电子技术PowerElectronicsV01.43No.11November,2009光伏系统中最大功率点跟踪方法的研究郭勇,孙超,陈新(南京航空航天大学,江苏南京210016)摘要:在光伏发电系统中.光伏电池的最大输出功率取决于温度和光照条件,采用最大功率跟踪(MaximumPowerPointTracking,简称MHT)方法可以使光伏电池持续输出最大功率。
研究了光伏系统中的最大功率控制部分,提出了MPPT控制器的设计,介绍了几种常用的MPPT方法,其中重点研究了电导增量(IncrementalConductance,简称INC)法。
给出了INC法的软件流程的设计,并在Matlab中建立了光伏电池的仿真模型。
最后通过实验验证了MPPT控制器的可行性,其MPPT的响应速度和控制精度均达到了预期要求。
关键词:太阳能发电;光电池/最大功率点跟踪中图分类号:TM625文献标识码:A文章编号:1000-100X(2009)11-0021—03ResearchonMaximum(NanjingPowerPointTrackingMethodforPhotovoltaicSystemGUoYong。
SUNChao。
CHENXinUniversityofAeronaiaicsandAstronautics,Nanjingare210016,China)toAbstract:Themaximumpowerpointtracking(MPPT)techniquesvoltaicarrayoutputpowerdependsonusedinphotovoltaicsystemsmaximizethephoto-panelstemperatureandirradianeeconditions.Thepartofmaximumpowerpoint(MPP)forthephotovohaicsystemisresearched.ThenthesystemdesignofphotovoltaicMPPTcontrollerisproposed,someMPPTmeansforphotovoltaiccellarepresentedintroduced,focusingontheincrementalconductance(INC).ThesoftwareflowchartisandthephotovohaiccellmodelforsimulationiscreatedinMadab.Atlast,theexperimentalresultshowsthespeedandcontrolprecisionmeetfeasibilityofthisphotovohaieMPPTcontroller,theresponsetheexpectations.Keywords:solarenergygeneration;photovoltaiearray,maximumpowerpointtracking1引言随着时代的发展,人类对能源的需求越来越多,然而煤、石油、天然气等传统能源是有限的,只有开发新能源才是解决能源问题的根本。
光伏系统最大功率点跟踪算法的研究摘要最大功率点跟踪系统对提高光伏系统整体工作效率具有重要作用。
在对比分析登山算法及三点比较算法各自特点的基础上,本文提出了一种兼顾跟踪效率和精度的改进算法。
关键词光伏系统;最大功率点跟踪;算法Research of Tracking Algorithm of Maximum Power Point for Photovoltaic SystemWANG XuDepartment of Physics and Information Engineering,Huaihua University,Huaihua 418008Abstract The maximum power point tracking (MPPT) symtem is important for improving the efficiency of the photovoltaic system.In this paper,on the basis of comparative analysis characteristics of mountain climbing algorithm and three point algorithm,a improved algorithm is proposed to cover tracking efficiency and accuracy.Keywords photovoltaic system; tracking algorithm of maximum power point; Algorithm0 引言面对传统能源的日益枯竭以及自然环境的不断恶化,人类急需寻找一种环保、低碳、可再生利用的清洁能源,以降低对传统能源的依赖。
在众多新能源中,太阳能因其储量丰富、分布广泛、清洁环保而备受人们关注。
在太阳能的利用方式中,光伏发电是最有效也是目前应用最为广泛的方式之一。
储能电池组系统模块最大功率点跟踪算法研究储能电池组系统的最大功率点跟踪(Maximum Power Point Tracking,简称MPPT)算法是提高储能系统效率的关键技术之一。
随着可再生能源的普及和储能技术的发展,储能系统的需求日益增长。
在实际应用中,如何有效地跟踪和控制储能电池组系统的最大功率点,成为提高系统运行效率和延长电池寿命的重要课题。
首先,需要了解储能电池组系统及其最大功率点跟踪原理。
储能电池组系统由多个电池模块组成,每个电池模块又包含多个电池单体。
电池单体的特性曲线通常呈现非线性的V-I(电压-电流)特性,且每个电池单体的特性存在一定的差异。
电池组系统通过串联或并联多个电池单体来提高电压和容量,进而满足储能需求。
储能电池组系统的最大功率点跟踪算法主要是通过调整电池组系统电流和电压之间的关系,以获取最大功率点。
最大功率点通常位于电池特性曲线的斜率为零的位置,即功率对应的电流和电压满足一定的关系。
常见的储能电池组系统模块最大功率点跟踪算法包括Perturb and Observe(P&O)算法、Incremental Conductance(INC)算法和模糊控制算法等。
这些算法在实际应用中各有优劣,需要根据实际情况选择合适的算法。
P&O算法是最为简单且常用的最大功率点跟踪算法之一。
该算法通过不断调整电压或电流,以观察功率变化的趋势来寻找最大功率点。
其原理是在不同的电压和电流值下,比较该点与上一个点的功率差异,向功率增加的方向调整,直到达到最大功率点。
然而,P&O算法在动态性能和稳定性方面存在一定的局限性,容易受到光照变化的影响,导致功率跟踪不稳定的问题。
INC算法是P&O算法的改进版本,能更好地适应不同光照条件下的最大功率点跟踪。
INC算法基于电流的导数来推断功率的变化趋势,并相应地调整电压。
相比于P&O算法,INC算法更加精确和稳定。
但是,INC算法对电池模型的要求较高,在电池参数变化较大时,可能导致跟踪不准确的问题。
大气质量(AM)Air Mass (AM)直射阳光光束透过大气层所通过的路程,以直射太阳光束从天顶到达海平面所通过的路程的倍数来表示。
当大气压力P=1.013巴,天空无云时,海平面处的大气质量为1。
在任何地点,大气质量的值可以从以下公式算出:大气质量=其中,P为当地的大气压力,以巴表示。
Po 等于1.013巴θ为太阳高度角AM1.5条件AM1.5 condition系指在大气质量为1.5时,标定地面用太阳电池所规定的测试光源的辐照度和光谱分布(其中包括大气浑浊度、沉积水蒸气含量,臭氧含量等一组条件)。
太阳高度角solar clevation angle太阳光线与观测点处水平面的夹角,称为该观测点的太阳高度角。
辐照度irradiance系指照射到单位表面积上的辐射功率(W/m2)。
总辐照(总的太阳辐照)total irradiation (total insolation)在一段规定的时间内,(根据具体情况而定为每小时,每天、每周、每月、每年)照射到某个倾斜表面的单位面积上的太阳辐照。
直射辐照度direct irradiance照射到单位面积上的,来自太阳圆盘及其周围对照射点所张的圆锥半顶角为8o的天空辐射功率。
散射辐照度diffuse irradiance除去直射太阳辐照的贡献外,来自整个天空,照射到单位面积上的辐射功率。
太阳常数solar constant在地球的大气层外,太阳在单位时间内投射到距太阳平均日地距离处垂直于射线方向的单位面积上的全部辐射能,称为太阳常数,常用毫瓦/厘米2或瓦/米2来表示。
环境温度ambient temperature是光伏发电器周围空气的温度。
在一个通风而能避开阳光,天空和地面辐射的箱体内测量。
电池额定工作温度nominal operating cell temperature系指在辐照度为800Wm-2、环境气温20℃,风速Lms-1,电气开路在中午时太阳光垂直照射于敞开安装的框架,这个标准参考环境中,组件内太阳电池的平均平衡温度。
太阳能发电系统中的最大功率点跟踪技术在太阳能发电系统中,最大功率点跟踪(Maximum Power Point Tracking, MPPT)技术是一项重要的研究课题。
太阳能电池的输出电压与环境光强、温度等因素有关,而发电系统的效率取决于电池输出的最大功率。
因此,为了最大限度地提高太阳能发电系统的效率,确保高效率的能量转换和系统的长期稳定运行,MPPT技术应运而生。
MPPT技术是通过对太阳能电池组进行电压和电流的调整,使得系统工作在太阳能电池的最大功率点处。
太阳能电池的输出功率与其电流和电压的乘积有关,即P=I*V。
在太阳能电池的I-V特性曲线中,最大功率点是该曲线上功率最大的点,实现这个点上的功率输出是MPPT算法的核心目标。
MPPT技术的核心思想是实时监测、计算和跟踪太阳能电池组的工作状态,以调整电压和电流,使得系统工作在最大功率点处。
为了实现MPPT技术,研究人员提出了许多方法和算法,常见的有Incremental Resistance(增量电阻法)、Perturbation & Observation(扰动观察法)和模糊控制法等。
增量电阻法是最早提出的一种MPPT方法,该方法通过对太阳能电池组的电压进行微小变化,并测量此时太阳能电池的输出功率变化,根据增量功率与增量电阻之间的关系判断最大功率点位置。
虽然该方法原理简单,但在快速变化的工况下,其响应速度较慢。
扰动观察法是另一种常见的MPPT方法,该方法通过逐步增加或减少太阳能电池的工作点电压,并观察功率的变化情况,根据功率变化趋势确定最大功率点位置。
该方法相对于增量电阻法有着更快的响应速度和更高的精度,但在光照强度变化剧烈的环境下,可能无法快速找到最大功率点。
除了上述两种方法外,模糊控制法也广泛应用于MPPT技术中。
模糊控制利用模糊逻辑推理来实现对电池组的电压和电流进行调整,以使得系统电池工作在最大功率点处。
该方法通过建立模糊控制规则和输入输出模糊化来实现MPPT功能,并具有较好的适应性和鲁棒性。
风力发电系统最大功率点跟踪控制方法研究综述摘要:为充分利用风能,需要捕获风电系统的最大功率点。
由于风速的随机性与风电系统的非线性,最大功率点捕获控制比较困难,也是风力发电的热点问题之一。
介绍了多种常用的最大功率跟踪方法的原理,说明了各种方法的优、缺点,指出了最大功率点跟踪方法的发展趋势,对最大功率点跟踪方法的选择和研究有一定的参考指导价值。
关键词:风力发电系统;最大功率跟踪;最优叶尖速比法;功率信号反馈法;爬山搜索法Review on the Method of Tracking the Maximum Power Pointin Wind Power Generation SystemMa-yan、Wang-haiyun(Electrical Engineering Col lege,Xinjiang University,Urumqi,Xinjiang 830008) Abstract:In order to utilize the wind power sufficiently,it is necessary to capture the maximum power point in wind power generation system.Due to the randomness of the wind speed and the nonlinearity of the wind powergeneration system,capturing the maximum power point is very difficult and is also one of the hot issues in wind power generation.In this paper,the principles of several common methods to track the maximum power point were presented;the advantages and disadvantages were discussed;the development trend of the method to track the maximum power point was pointed out.All these had referential and instructive values for the selection and investigation of the maximum power point tracking method.Key words:wind power generation system;tracking the maximum power point;optimal tip speed ratiomethod;power signal feedback;climbing search method0 引言能源是支持经济发展的重要因素和战略资源,人类社会发展的历史与能源开发和利用水平密切相关。
最大功率点跟踪控制的方法最大功率点 (Maximum Power Point) 跟踪控制(MPPT)是指在太阳能电池阵列中,通过一定的电路和控制策略,实现扫描整个太阳能电池阵列,从中找到当前工作状态下的最大功率点,并最终控制整个太阳能电池阵列工作在该最大功率点处,从而使得太阳能电池的输出功率最大化,以提高太阳能发电的效率和经济性。
最大功率点跟踪控制技术是太阳能电池阵列控制的重要技术,不仅可以将太阳能电池的输出功率最大化,同时还能提高系统的可靠性、稳定性和使用寿命等方面的性能。
下面将介绍最大功率点跟踪控制的几种方法。
1. 模拟式最大功率点跟踪控制模拟式最大功率点跟踪控制是最早出现的一种方法,也是相对简单的一种方法。
该方法的核心是通过调节单片机的PWM信号,控制电荷控制器输出电压和电流,使得电荷控制器输出的功率达到最大值。
但是,该方法存在着效率低下、稳定性差、不够灵活等缺点。
2. 开环跟踪方法开环跟踪方法是指进行一定的计算得到最大功率点的位置,然后使用控制器直接控制输出电压和电流,以使得太阳能电池处于最大功率点。
该方法具有工作简单、可靠性高等优点,但是由于无法根据输出功率对最大功率点进行跟踪调整,同时还容易受到天气和环境等因素的影响,存在着功率损失和不够灵活等缺点。
3. 闭环反馈跟踪方法闭环反馈跟踪方法是一种对于开环跟踪的改进方法。
在闭环反馈方式下,控制器会根据实际输出功率来调节工作点,以精准地跟踪到最大功率点。
基于闭环反馈思想,目前常见的控制器有基于模糊控制、神经网络控制和PID控制等,这些控制器的应用难度和控制效果各不相同。
例如,模糊控制器可以灵活应对光照强度和温度变化等复杂的环境因素,但需要充分的实验数据和模型的准确性作为基础。
神经网络控制器具有良好的适应性和泛化能力,但是需要大量的数据训练和计算资源,并且难以进行解释。
PID控制器具有成熟的算法和实现方法,但对电流、电压等参数的变化较为敏感,需要进行较为精确的参数调节,因此需要一定的实际操作经验和技术支持。
Abstract--The power available at the output of photovoltaic cells keeps changing with solar insolation and ambient temperature because photovoltaic cells exhibit a nonlinear current-voltage characteristic. So photovoltaic cells’ maximum power point varies with solar insolation and ambient temperature. With the improved efficiencies of power electronics converters, it is now possible to operate photovoltaic power systems at its maximum power point (MPP) in order to improve the overall system efficiency. This paper presents a fuzzy control method for tracking maximum power point in photovoltaic power systems and the control system is established simultaneously. In this paper, simulation model of photovoltaic system’s maximum power point tracking based on the fuzzy control method is developed in the MATLAB software. The results of simulation show that the fuzzy control algorithm significantly improves the efficiency during the tracking phase as compared to a conventional algorithm about maximum power point tracking (MPPT) in photovoltaic power systems. It is especially suitable for fast changing environmental conditions. Furthermore, the proposed algorithm is simple and can be easily implemented with any fast micro processor such as a digital signal processor.Index Terms--Fuzzy control, maximum power point tracking (MPPT), photovoltaic power systems, simulation.I. I NTRODUCTIONITH the quick development of society, the rapid trendof industrialization of nations and increased interest inenvironmental issues has recently to consideration of the use of renewable forms such as solar energy and wind energy. Photovoltaic (PV) generation is becoming increasingly important as a renewable source since it offers many advantages such as incurring no fuel costs, not being polluting, requiring little maintenance, and emitting no noise, among others [1]. PV arrays produce electric power directly from sunlight. With the advent of silicon P-N junction during the 1950s, the photoelectric current was able to produce power due to the inherent voltage drop across the junction [2]. This gives the well-known nonlinear relationship between the current and voltage of the photovoltaic cell. From this nonlinear relationship of the photovoltaic cell, it can be observed that there is a unique point, under given illumination, at whi ch the cell produces maxi mum power, the so-called Jiyong Li is with the College of Electrical Engineering, Hohai University, Nanjing, 210098 China (e-mail: ji_yong_li@).Honghua Wang is with the College of Electrical Engineering, Hohai University, Nanjing, 210098 China (e-mail: wanghonghua@). maximum power point (MPP). This point occurs when the rate of change of the power with respect to the voltage is equal to zero [3]. T he output power of PV cell varies with depending mainly on the level of solar radiation and ambient temperature corresponding to a specific weather condition. The MPP will change with external environment of PV cell. An important consideration in achieving high efficiency in PV power generation system is to match the PV source and load impedance properly for any weather conditions, thus obtaining maximum power generation. The technique process of maximum power point is been tracking which is called maximum power point tracking (MPPT).In order to gain maximum power, MPPT is an essential part of a PV generation system. Because of the nonlinear voltage-current characteristics of PV cells, the power versus voltage (P–V) curve in solar cells has more complicated nonlinear relationship when solar illumination and ambient temperature change, so the MPP is difficult to solve analytically, and therefore numerous techniques have been proposed to realize MPPT. These MPPT methods vary in complexity, sensors required, convergence speed, cost, range of effectiveness, implementation hardware, popularity, and in other respects. Some methods applied in PV system are the constant voltage method, the perturb-and-observe (P&O or hill-climbing, because hill climbing and P&O methods are different ways to envision the same fundamental method.) method, the incremental conductance method, and so on.From the power versus voltage characteristic curve of PV cell, it can be observed that the MPP is in the neighborhood of a constant voltage when solar illumination is changing and temperature’s change is omitted. So the MPP’s voltage V m can be designed to be constant. This is the constant voltage tracking (CVT) method [4]. Although the CVT method is very simple, however, the constant voltage can’t track MPP when temperature changes, so the constant voltage method is not often used in the true MPPT strategy. From the characteristic curves of PV cell, it can be seen that incrementing (decrementi ng) the voltage i ncreases (decreases) the power when operating on the left of the MPP and decreases (increases) the power when on the right of the MPP. Therefore, i f there i s an i ncrease i n power, the subsequent perturbati on should be kept the same to reach the MPP and i f there i s a decrease i n power, the perturbati on should be reversed [5]. Small perturbations are introduced in the system in order to vary the operating point such that the MPP is achieved. However, this method has several drawbacks such as slow tracking speed and oscillations about MPP, making it less favorable for rapidly changing environmental conditions. AndMaximum Power Point Tracking of Photovoltaic Generation Based on the FuzzyControl MethodJiyong Li, and Honghua WangWthis method can appear fallacious tracking when there is a sudden change in irradiance. The incremental conductance (INC) method is based on the fact that the slope of the PV array power curve is zero at the MPP, positive on the left of the MPP, and negative on the right [5], as given bydP/dV=0, at MPP dP/dV>0, left of MPP dP/dV<0, right of MPP ⎧⎪⎨⎪⎩(1) By derivation, it can be gained the relationship between the instantaneous conductance (I/V ) and the incremental conductance (ΔI /ΔV ). The MPP can be tracked by comparingI /V to ΔI /ΔV. It can be supposed thatV ref equals to V MPP at the MPP. Once the MPP is reached, the operation of the PV array is maintained at this point unless a change in ΔI is noted. The algorithm decrements or increments V ref to track the new MPP when atmospheric conditions change. However, from derivation of the INC method, it can be seen that the INC method has no consideration about change of temperature.In fact, because changes i n the env ironment have uncertai nty, changes of load and output characteri sti c of PV cell have more nonl i near feature, so above convent ional tracking methods have more difficult to track real MPP.Fuzzy control has adaptive characteristic in nature, and can achieve robust response of a system with uncertainty, parameter variation and load disturbance. It has been broadly used to control ill-defined, nonlinear or imprecise system [6]. Fuzzy logic controllers have the advantages of working with imprecise inputs, not needing an accurate mathematical model, and handling nonlinearity. Fuzzy control has been successfully applied in many fields, such as industry controls. Fuzzy control does not require accurate models of control object. To overcome the limitation of the above conventional tracking methods, fuzzy control is applied to deal with MPPT of PV generation system in this paper. With this technique, not only can the real MPP be readily tracked but also fast dynamic responses can be achieved.II. C HARACTERISTIC OF P HOTOVOLTAIC C ELLPhotovolta c cells cons st of a s l co n P-N junction that when exposed to light releases electrons arou nd a closed electrical circuit. From this premise the circuit equivalent of a PV cell can be modeled through the circuit shown in Fig. 1. Electrons from the cell are exci ted to hi gher energy levels when a collision with a photon occurs. These electrons are free to move across the junct on and create a current. Th s s modeled by the l i ght generated current source (I ph ). The intrinsic P-N junction characteristic is introduced as a diode inthe circuit equivalent [7].Fig. 1. Photovoltaic cell equivalent circuitThe photo current I ph generated in the PV cell isproportional to level of solar illumination. I is the output current of photovoltaic cell. The current (I d ) through the bypass diode varies with the junction voltage V j and the cellreverse saturation current I 0. V is the output of the photovoltaiccell. R sh and R s are the parallel and series resistances, respectively. Parallel resistance R sh is very large while the series resistance R s is small. When the number of cell in series is n s , and the number of cell in parallel is n p . There are relevant mathematical equations expressing as following:(/)0/[1]s s q V n IR s snkTp ph p shV n IR I n I n I eR ++=−−−(2) ()()1000ph sc T ref SI I C T T =+− (3) Where 11[()]300(gref qE nkT Td refT I I eT −=, 191.602210q C −=× is theelectronic charge, n is the emission coefficient of diodes, 2311.380710JK k −−=× is Boltzmann’s constant, T is ambienttemperature in Kelvin, and ref Tis reference absolute temperature. sc Iis the short current, S is the level of solar illumination, g E is the energy of the band gap for silicon which is (1~3) eV, T C is the short-circuit-current temperaturecoefficient(=0.0016A/K), do I is the reverse current of diode. And From equation (2) and (3), it is known that the characteristic of PV will be changed when S and T change. Changes in these variables S and T cause the current-voltage (I-V ) curves of photovoltaic array to change as well. As illustrated in Fig. 2, where S symbolizes the solar illumination, S variation from 200W/m 2 to 1000W/m 2 is reported, and temperature T is constant 40℃. Besides the solar illumination, another important factor influencing the characteristics of a photovoltaic module is ambient temperature, as shown in Fig. 3, where the solar illumination is constant 1000W/m 2, and temperature T is changing from 20℃ to 100℃.Fig. 2. Simulate current versus voltage curves of PV array influenced bysolar illuminationFig. 3. Simulated current versus voltage curves of PV array influencedby temperatureThe output power of a PV array is the product of current I and terminal voltage V ; thus(/)20/[1]s s q V n IR s sp ph p shV n VIR P n VI n VI eR ++=−−− (4)From above equation, it can be known that the solar illumination and ambient temperature will influence the output power of a PV module. T he output power of a PV changes with the solar illumination’s variation when temperature is constant 40℃, as shown in Fig. 4, and the characteristic ofoutput power changes with the ambient temperature’s variation when the solar illumination is constant 1000W/m 2, asshown in Fig. 5.Fig. 4. Power versus voltage curves influence by the solar illuminationFig. 5. Power versus voltage curves influence by temperatureFrom Fig. 4 and Fig. 5, it can be seen that the output power of a PV module is influenced by the solar illumination and ambient temperature. So the MPP will be change whenperipheral condition is changed. Especially, the solar illumination and temperature changes at the same time, MPP is more difficult to search by above convent i onal track i ng methods. In order to quick and accurate track MPP under any weather conditions, a new technique for tracking MPP of photovoltaic (PV) generation based on fuzzy control method is proposed in this paper.III. A N EW MPPT M ETHOD W ITH F UZZY C ONTROL In recent years, fuzzy logic controllers have been widely used for industrial processes owing to their heuristic nature associated with simplicity and effectiveness for both linear and nonlinear systems [8]. A MPP search based on fuzzy heuristic rules, which does not need any parameter information, consists of a stepwise adaptive search, leads to fast convergence and is sensorless with respect to sunlight and temperature measurements [9]. The control objective is to track and extract maximum power from the PV arrays for a given solar insolation level. The maximum power corresponding to the optimum operating point is determined for a different solar insolation level and temperature.The fuzzy controller consists of three functional blocks: A) Fuzzification, B) Fuzzy rule algorithm and C) Defuzzification. These functions are described as follows:A. FuzzificationThe fuzzy control requires that variable used in describing the control rules has to be expressed in terms of fuzzy set notations with linguistic labels. In this paper, the fuzzy control MPPT method has two input variables, namely ΔP(k) and ΔU(k), at a sampling instant k. The output variable is ΔU(k+1), which is voltage’s increase of PV array at next sampling instant k+1. The variable ΔP(k) and ΔU(k) are expressed as follows:ΔP(k)=P(k)-P(k-1) (5) ΔU(k)=U(k)-U(k-1) (6)where P(k) and U(k) are the power and voltage of PV array, respectively. So, ΔP(k) and ΔU(k) are zero at the maximum power point of a PV array.In Fig. 6, the membership functions of the input variable ΔP(k) which is assigned five fuzzy sets, including positive big(PB), positive small (PS), zero (ZE), negative small (NS), andnegative big (NB). The membership functions are denser at the center in order to provide more sensitivity against variationFig. 6. The membership function of input ΔP(k)In Fig. 7, the membership functions of the input variable ΔU(k) which is assigned three fuzzy sets, including positive (P), zero (Z), and negative(N).Fig. 7. The membership function of input ΔU(k)Fig. 8 shows the membership functions of the output variable ΔU(k+1) which is assigned seven fuzzy sets, including positive big (PB), positive middle (PM), positive small (PS), zero (ZE), negative small (NS), negativemiddle(NM), and negative big (NB). Fig. 8. The membership function of input ΔU(k+1) B. Fuzzy rule algorithmThe rule base that associates the fuzzy output to the fuzzy inputs is derived by understanding the system behavior. In this paper, the fuzzy rules are designed to incorporate thefollowing considerations keeping in view the overall trackingperformance.1) If the last change in voltage ΔU(k) has caused the powerto rise, keep moving the next change in voltage ΔU(k+1)in the same direction by tuning duty ratio of converter toachieve, otherwise, if it has caused the power to drop,move it in the opposite direction.2) Owing to the fact that the characteristic curves might change with temperature and sunlight level, leading to anoverall shift of the optimum point.3) Because the optimum point tends to satisfy the conditionəP/əU =0, the system might recognize any large plateau as a maximum power region and stop. The some rules have been identified for avoiding the stabilizing effect in a region other than that of true peak power when power is zero. 4) It is necessary to provide the system with a rule thatstabilizes the point of operation at a peak power point. Taking the above points into consideration the fuzzy rules are derived and the corresponding rule base is given in Table I.TABLE IRAs a fuzzy i nference method, Mamdani ’s method i s used with max---min operation fuzzy combination law in this paper.To satisfy different conditions and gain better tracking performance, several possible combinations of the degree of supports are with varying strengths to the corresponding rules.Fig. 9. A three-dimensional view of the fuzzy surface for MPPT C. DefuzzificationAfter the rules have been evaluated, the last step to complete the fuzzy control algorithm is to calculate the crisp output of the fuzzy control with the process of defuzzification. The well-known center of gravity method for defuzzification is used in this paper. It computes the center of gravity from the final fuzzy space, and yields a result which is highly related to all of the elements in the same fuzzy set [10]. The crisp valueof control output ΔU(k+1) is computed by the followingequation: ni i=1ni i=1w U U=w i ΔΔ∑∑ (7)Where n is the maximum number of effective rules, w i isthe weighting factor, and ΔU i is the value corresponding to themembership function of ΔU. Then, the final control voltage isobtained by adding this change to the previous value of thecontrol voltage:U(k+1)=U(k) + ΔU(k+1) (8)Using the steps mentioned above, the fuzzy controller canbe implemented in real time for MPPT.IV. S IMULATION R ESULTSAs mentioned previously, since fuzzy control is with adaptive characteristics, uncertainties and variations can be readily accommodated. In this paper, Fig. 10 illustrates aFig. 10. A control flowchart for MPPT with fuzzy controlThe CVT can’t track MPP when solar illumination changes because voltage of maximum power point (Vm) is constant, so the CVT is no t o ften used in the true MPPT strategy. The P&O metho d has several drawbacks such as slo w tracking speed and oscillations about MPP, and this method can appear fallacius tracking when there is a sudden change in irradiance. Compared to the fixed size INC MPPT method, the variable step size INC MPPT algorithm is able to improve the dynamic and steady state perfo rmance o f the PV system simultaneously.Thus, in order to verify the performance of the fuzzy control MPPT method proposed in this paper, this paper compares the perfo rmance o f the fuzzy co ntro l MPPT metho d with the variable step size INC MPPT method. According to the flowchart, the co rresponding simulation model is built inMatlab/Simulink so ftware. The specificatio ns o f PV arraymodel in simulation are listed in Table II. The simulations are configured under exactly the same conditions to compare the performances.TABLE IIPV S IMULATION M ODULE S PECIFICATIONOpen circuit voltage 20.9VShort circuit current 3.0Athe number of cell in series 15the number of cell in parallel 1Simulatio n has been perfo rme d when solar illumination changes from 400 W/m2 to 1000 W/m2 at 0.03s and changes back to 400 W/m2 at 0.1s, temperature (T) rises from 40℃ to 60℃ at 0.06s at the same time, as can be seen in Fig. 11.Fig. 11. The change of solar illumination in simulationFig. 12. The current, voltage and output power of PV array based on MPPTwith variable size step INCFig. 13. The current, voltage and output power of PV array based on MPPTwith fuzzy controlFig. 12 shows curves of current, voltage and output powerof PV array based on MPPT with the variable size step INC. And Fig. 13 illustrates curves of current, voltage and output power of PV array based on MPPT with the fuzzy control.TABLE IIIT HE T RACKING P ERFORMANCE C OMPARISON B ETWEEN V ARIABLE S TEP S IZEINC AND F UZZY C ONTROL MPPT M ETHODSMPPTMethodTracking time of PV power with circumstance step change400 1000W/m2at 0.03s40℃ 60℃at 0.06s1000 400W/m2at 0.1sVariablesize INC0.037s 0.004s 0.0025sFuzzycontrol0.032s 0.0005s 0.0004s From Fig. 12, Fig. 13, and table III, co mpare to variable step size INC MPPT metho d, it can be known that fuzzy control MPPT algo rithm can fast track MPP in vo ltage, current, and power sides. So the fuzzy control MPPT methodis able to impro ve the dynam ic and steady state performanceof the PV system simultaneously. MPPT fuzzy logic controllers have been shown to perform well under varying atmospheric conditions both solar illumination and temperature.V. C ONCLUSIONA complete fuzzy logic solar array maximum power tracking controller has been designed and simulated in the software in this paper. Simulation results show fast convergence to the MPP and minimal fluctuation about it. Fuzzy controlled the maximum power point of a PV module at given atmospheric conditions very fast and efficiently. The sudden change in atmospheric conditions shifts the maximum power point abruptly which is tracked accurately by this controller. If practically implemented, this method can increase the efficiency of the PV system by quite a large scale. Since the proposed approach requires only the measurement of PV array output current and voltage, not the measurement of solar irradiation level and temperature, it decreases the number and cost of equipment as well as the design complexity. So theproposed algorithm is simple and can be easily implemented on any fast controller such as the digital signal processor. The advantages of the fuzzy controller are that the control algorithm gives fast convergence and robust performance against parameter variation, and can accept noisy and inaccurate signals. The system was found to reliably stabilize the maximum power transfer in all operating conditions, and it is ready to be fitted in a larger installation.R EFERENCES[1]Vineeta Agarwal, and Alck Vishwakarma, "A Comparative Study ofPWM Schemes for Grid Connected PV Cell," in Proc. 2007 IEEE The 7th International Conference on Power Electronics and Drive Systems, pp. 1769-1775.[2]Cuauhtemoc Rodriguez, and Gehan A. J Amaratunga, "AnalyticSolution to the Photovoltaic Maximum Power Point Problem," IEEE Transactions on Circuit and Systems, Vol. 54, No. 9, pp. 2054–2060, September 2007.[3]J. Nelson, The Physics of Solar Cells. London, U.K.: Imperial CollegePress, 2003.[4]Z. M. Salameh, D, Fouad, and A. William, "Step-down maximum powerpoint tracker for photovoltaic systems," Solar Energy, Vol. 46, No. 5, pp.279-282, 1991.[5]Trishan Esram, and Patrick L. Chapman, "Comparison of PhotovoltaicArray Maximum Power Point Tracking Techniques," IEEE Transactions on Energy Conversion, vol. 22, No. 2, pp. 439-449, June. 2007.[6]Tsai-Fu Wu, Chien-Hsuan Chang, and Yu-Kai Chen, "A Fuzzy-Logic-Controlled Single-Stage Converter for PV-Powered Lighting System Application," IEEE Transactions on Industrial Electronics, Vol. 47, No.2, pp.287-296, April 2000.[7]Nicola Femia, Giovanni Petrone, Giovanni Spagnuolo, and MassimoVitelli, " Optimization of Perturb and Observe Maximum Power Point Tracking Method," IEEE Trans. on Power Electronic, Vol. 20, No. 4, pp.963- 972, July 2005.[8]Mummadi Veerachary, Tomonobu Senjyu, and Katsumi Uezato,"Feedforward Maximum Power Point Tracking of PV Systems Using Fuzzy Controller," IEEE Transactions on Aerospace and Electronic System, Vol. 38, No. 3, pp. 969-981, July 2002. [9]M.Godoy Simoes, and N.N.Franceschetti, "Fuzzy optimisation basedcontrol of a solar array system," IEEE Proc.-Electr. Power Appl., Vol.146, No. 5, pp.552-558, Sepetember 1999.[10]Mummadi Veerachary, Tomonobu Senjyu, and Katsumi Uezato,"Neural-Network-Based Maximum-Power-Point Tracking of Coupled-Inductor Interleaved-Boost-Converter-Supplied PV System Using Fuzzy Controller," IEEE Transactions on Induetrial Electronics, Vol. 50, No. 4, pp.749-758, August 2003.Jiyong Li was born in Zunyi in China, on December1, 1975. He received the B.S. degree in vehicleengineering from Lanzhou Jiaotong University,Lanzhou, China, and M.S. degree in systemengineering from Southwest Jiaotong University,Chengdu, China, in 1999, and 2005, respectively. Heis currently working toward the Ph.D. degree inHohai University, Nanjing, China.His employment experience included theSouthwest Jiaotong University. His special fields ofinterest included the application of control techniques, the control technology of power electronics and applications of renewable energy sources.Honghua Wang was born in taizhou in China, in1963. He received the M.S. degree in industrialautomation from South China University ofTechnology, Guangzhou, China, and Ph.D degree inElectrical engineering from Zhejiang University,Hangzhou, China, in 1992, and 1997, respectively.He is currently the professor in Hohai University,China. His research interests include powerelectronic application, motion control system,intelligent control technique, and new type dc and acdrives.。
光伏发电系统的最大功率点跟踪作者:洪晓燕李佳鹏卢奇李凯来源:《机电信息》2020年第30期摘要:通過对光伏电气特性的分析,建立其数学模型,描绘出光伏电池在不同温度及光照强度下的特性曲线,基于特性曲线应用变步长扰动观察法对其最大功率点进行跟踪比较。
经过仿真验证得出,变步长扰动观察法有着跟踪速度较快的优势,同时在达到最大功率点时相对稳定,进而有效提高了系统的输出效率。
关键词:最大功率点跟踪;光伏电池;扰动观察法;仿真0 引言一般将阻抗加在光伏矩阵和负载间来进行最大功率点跟踪的方法称为“最大功率点跟踪控制法”(Maximum Power Point Tracking,MPPT)。
作为光伏发电系统中的核心技术,相关研究人员对此提出了大量的MPPT算法,包括智能算法和传统算法。
其中,传统方法因其控制简单的优势而被广泛应用,其主要方法有扰动观察法[1-2]和增量电导法[3]。
现有的算法都存在自身的优缺点,因而需要对各类算法的优缺点和适用条件进行深入了解及对比分析,从而更有效地应用于光伏发电系统。
现有MPPT算法的应用前提都是假设光伏阵列受到的光照均匀,但是实际光伏阵列被遮挡的概率很大。
在光伏阵列中,如果出现了局部遮阴情况,就会在输出特性中出现多峰状现象。
在这种困境下,基于寻优单峰的传统MPPT算法会暴露难以搜寻到全局最优的缺陷,因此对于性能更为优良的MPPT算法的研究具有重要意义。
1 光伏电池数学模型及特性曲线图1为光伏电池等效模型[4],该图中的电流源Iph表示光生电流,Rsh代表等效并联电阻,Rs代表串联电阻,U、I分别代表输出电压、输出电流。
它们之间的特性关系如下:当出现光照充足情况时,光生电流会远大于(U+IRs)/Rsh,因此忽略式(1)中此部分,化简为:式(2)会有一定的技术问题,比如相关参数不易获得,而且会出现数据和厂家提供的参数数据不符合的现象。
基于以上问题,本文通过建立新的实际模型,再选择性地结合厂家提供的具体参数,从而具体地研究分析了光伏电池的输出特性。
光伏发电系统最大功率点跟踪算法的研究刘军;张成林【摘要】In photovoltaic systems, photovoltaic cell output characteristics are affected greatly by light intensity and environmental temperature, with significant nonlinear characteristics. In order to improve the utilization efficiency of photovoltaic cells, it requires fast and accurate tracking and controlling the maximum power point. This paper carried out a detailed analysis on short-circuit current law and the disturbance observation, and finally combine the advantages of both methods proposed the dual-mode maximum power point tracking method, which has a fast tracking the changes of the external environment, without oscillation at the maximum power point, high utilization of the advantages of photovoltaic cells. In addition, it will not lose the ability to control MPPT in the case of rapid change of the sunshine.%在光伏发电系统中,光伏电池输出特性受光照强度及环境温度影响很大,具有明显的非线性特征.为了提高光伏电池的利用效率,需要对光伏电池的最大功率点进行快速准确地跟踪控制.本研究对短路电流法与扰动观察法进行了详细的分析,最后结合两种方法的优点,提出了双模式最大功率点跟踪方法,该方法具有跟踪外部环境变化快,最大功率点无振荡现象,对光伏电池利用率高的优点.此外,日照变化剧烈情况下该方法不会失去MPPT控制的能力.【期刊名称】《青岛科技大学学报(自然科学版)》【年(卷),期】2012(033)001【总页数】4页(P78-81)【关键词】光伏发电系统;MPPT;短路电流法;扰动观察法;双模式【作者】刘军;张成林【作者单位】青岛科技大学自动化与电子工程学院,山东青岛266042;青岛科技大学自动化与电子工程学院,山东青岛266042【正文语种】中文【中图分类】TK513光伏电池的输出电压和输出电流随着太阳辐照度和电池结温的变化具有强烈的非线性,因此,在特定的工作环境下存在着一个唯一的最大功率输出点(MPP)。
最大功率点跟踪算法最大功率点跟踪算法是一种用于优化太阳能光伏系统性能的关键算法。
太阳能光伏系统的最大功率点是指在给定光照强度下能够输出最大功率的工作点。
最大功率点跟踪算法的目标是调整太阳能光伏系统的工作点,以确保系统能够始终在最大功率点工作。
最大功率点跟踪算法可以通过监测光照强度和电流电压来实现。
一种常用的算法是Perturb and Observe (P&O) 算法。
该算法通过周期性地微调工作点,观察功率是否增加,以确定最优工作点。
当系统处于最大功率点附近时,微调会逐渐减小,以保持系统在最大功率点附近。
另一种常用的算法是Incremental Conductance (IncCond) 算法。
该算法通过检测电流和电压的变化率来判断当前工作点相对于最大功率点的位置。
如果当前工作点在最大功率点的左侧,算法会增加工作点以接近最大功率点;如果在右侧,则减小工作点。
通过周期性地调整工作点,系统可以逐渐趋向最大功率点。
这些最大功率点跟踪算法在太阳能光伏系统中具有重要的应用价值。
它们能够确保系统始终在最大功率点运行,提高系统的能源利用效率。
同时,它们具有实时性和响应速度快的特点,适用于不同光照条件下的功率跟踪。
最大功率点跟踪算法的发展趋势是结合智能化技术,如人工智能和机器学习,以进一步提高算法的性能和效率。
通过利用大数据和算法优化,可以更精确地预测最大功率点,并实现自动调节工作点,以适应实时变化的光照条件。
总结而言,最大功率点跟踪算法是太阳能光伏系统中的重要算法,通过调节工作点使系统始终在最大功率点运行。
P&O算法和IncCond算法是常用的最大功率点跟踪算法,它们能够提高系统的能源利用效率。
未来,结合智能化技术的发展将进一步优化最大功率点跟踪算法的性能。