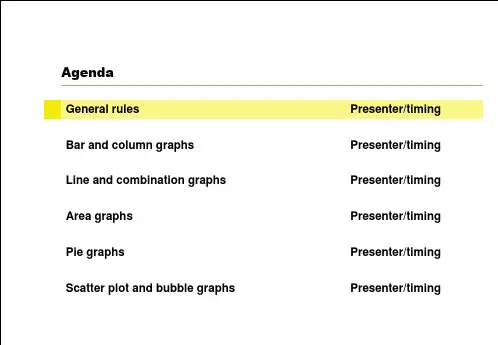
Agenda
Bar graph, 1 data series
Title, time period Subtitle
Axis title
Axis title
Source: Text is Arial, 8-point, plain; a semicolon should separate each item; the line shoLeabharlann ld end in a period.
All numbers in the graph (data and axis labels) should be the same size. Text labels may be smaller if necessary
Do not add unit symbols (e.g., $ or M) to the axis labels (except for %). Set the intervals to the largest reasonable value possible
When necessary, give the total for the column in a separate box
Title, time period Subtitle
Axis title
Axis title
100% stacked bar graph
Source: Text is Arial, 8-point, plain; a semicolon should separate each item; the line should end in a period.
If a given data element is too small to fit a data label, place the label outside in a separate text box


