现代投资组合理论与投资分析 第七章 答案
- 格式:doc
- 大小:260.50 KB
- 文档页数:12

第七章证券组合管理理论一、单项选择题1、证券组合管理理论最早由美国著名经济学家( )于1952年系统提出。
A.詹森B.特雷诺C.夏普D.马柯威茨2、适合入选收入型组合的证券有( )。
A.高收益的普通股B.优先股C.高派息风险的普通股D.低派息、股价涨幅较大的普通股3、以未来价格上升带来的价差收益为投资目标的证券组合属于( )。
A.收入型证券组合B.平衡型证券组合C.避税型证券组合D.增长型证券组合4、关于证券组合管理方法,下列说法错误的是( )。
A.根据组合管理者对市场效率的不同看法,其采用的管理方法可大致分为被动管理和主动管理两种类型B.被动管理方法是指长期稳定持有模拟市场指数的证券组合以获得市场平均收益的管理方法C.主动管理方法是指经常预测市场行情或寻找定价错误证券,并借此频繁调整证券组合以获得尽可能高的收益的管理方法D.采用主动管理方法的管理者坚持买入并长期持有的投资策略5、在证券组合管理的基本步骤中,注意投资时机的选择是( )阶段的主要工作。
A.确定证券投资政策B.进行证券投资分析C.组建证券投资组合D.投资组合的修正6、威廉·夏普、约翰·林特耐和简·摩辛分别于1964年、1965年和1966年提出了著名的( )。
A.资本资产定价模型B.套利定价模型C.期权定价模型D.有效市场理论7、史蒂夫·罗斯突破性地提出了( )。
A.资本资产定价模型B.套利定价理论C.期权定价模型D.有效市场理论8、某投资者买入证券A每股价格l4元,一年后卖出价格为每股16元,其间获得每股税后红利0. 8元,不计其他费用,投资收益率为( )。
A.14%B.17.5%C.20%D.24%9、完全负相关的证券A和证券B,其中证券A的期望收益率为16%,标准差为6%,证券B的期望收益率为20%,标准差为8%。
如果投资证券A、证券B的比例分别为30%和70%,则证券组合的标准差为( )。

课后习题1.简述债券的定义及种类。
2.影响债券定价的因素有哪些?这些因素如何影响债券价值的?3.简述债券定价原理。
4.简述常见的债券收益率。
5.什么是债券的时间价值?6.假定A公司发行了两种具有相同息票率和到期日的债券,一种是可赎回的,而另一种是不可赎回的,哪一种售价更高?7.有一30年期、息票率为8%的债券,计算其在市场半年利率为3%时的价格。
比较利率下降所造成的资本利得和当利率上升到5%时的资本损失。
8.两种10年期债券的到期收益率目前均为7%,各自的赎回价格皆为1100美元。
其中之一的息票率为6%,另一种为8%。
为简单起见,假定在债券的预期支付现值超过赎回价格时立即赎回。
如果市场利率突然降至6%,每种债券的资本利得分别是多少?第七章本章习题答案1. 债券(bond)是以借贷协议形式发行的证券。
借者为获取一定量的现金而向贷者发行(如出售)债券,债券是借者的“借据”。
这张借据使发行者有法律责任,需在指定日期向债券持有人支付特定款额。
典型的息票债券使发行者有义务在债券有效期内向持有人每半年付息一次,这叫做息票支付,因为在计算机发明之前,大多数债券带有息票,投资者将其剪下并寄给发行者索求利息。
债券到期时,发行者再付清面值(par value, face value)。
债券的息票率(coupon rate)决定了所需支付的利息:每年的支付按息票率乘以债券面值计算。
息票率、到期日和面值是债券契约(bond indenture)的各个组成部分,债券契约是债券发行者与持有者之间的合约。
政府债券的发行主体是政府。
政府债券是政府主体为筹措财政资金,以政府信用为基础向社会发行,承诺到期还本付息的一种债券凭证。
政府债券又分为中央政府债券和地方政府债券。
中央政府债券又称为国债。
公司债券,是公司按照法定程序发行,约定在一定期限内还本付息的债权债务凭证。
公司债券代表着发债的公司和投资者之间的一种债权债务关系。
债券持有人是公司的债权人, 不是所有者,无权参与或干涉公司经营管理,但债券持有人有权按期收回本息。
现代投资组合理论与投资分析---------------I09660112 09数学与应用数学一班 冯晨本学期,我们跟着骆桦老师学习投资组合,收获良多。
让我们知道什么是投资组合,如何利用投资组合来使我们的投资风险降到最低。
还有很多知识,如有效投资、投资组合分析、资本资产定价模型、套利定价模型、公司两阶段增长模型、期权定价理论等等,很多很多。
下面是本学期期末任务,分四个部分:1、对资本资产定价模型的认识课本上使用简单方法和严格方法推导,我们可以得到资本资产定价模型相同的结果如下:()i M F i F R R R R β=+-其中i R 是资产i 的预期回报率,FR 是无风险回报率,i β是贝塔系数,即资产i 的系统性风险, M R 是市场m 的预期市场回报率,M F R R - 是市场风险溢价(market risk premium ),即预期市场回报率与无风险回报率之差。
这个关系式是金融领域最重要的发现之一。
这个方程也称为证券市场线,描述了经济中所有资产与投资组合的期望收益率的关系。
任何资产或投资组合的收益率,无论是否是有效率的收益率,都可以由这一关系确定。
这里,M R 和FR 并不是我们所要考察的资产的函数,所以任意两个资产的期望收益率的关系可以简单的归因于它们具有不同的贝塔值,并且贝塔值越高则均衡收益率也越高。
这里的贝塔值是系统风险的度量指标,这是由于非系统风险总可以通过分散投资还消除的。
资本资产定价模型的应用。
资本资产定价模型主要应用于资产估值和资源配置等方面。
1资产估值是指应用资本资产定价模型可以估计一个证券的均衡状态的价格,将这个价格与现行的实际市场价格相比就可以知道这个证券是否偏离均衡价格,如果偏离,那么后续必定会回归到均衡价,利用这一点,我们便可获得超额收益。
2资源配置的应用就是根据对市场走势的预测来选择具有不同贝塔系数的证券或组合以获得较高收益或规避市场风险。
证券市场线表明,贝塔系数反映证券或组合对市场变化的敏感性,因此,当有很大把握预测牛市到来时,应选择那些高贝塔系数的证券或组合。
第1章投资环境一、单选题1. B2.B3.A4.C5.B6. B7.D8.B9.D 10.B二、多选题1. CD2.ABCD3.ABCD4.ACD5.BCD6. ABC7.ABD8.ABCD9.BCD 10.ABC三、判断题1.非2.是3.非4.是5.是6.非7.是8.非9.非 10.是四、简答题:1、从三方面来区分:(1)实物资产是能够为社会经济提供产品与服务能力的资产,包括土地、建筑物、知识、用于生产的机器设备等;金融资产不能直接对社会生产产生作用,只能简介推动社会生产,比如带来公司所有权和经营权的分离,金融资产包括股票、债券。
(2)实物资产是创造收入的资产,而金融资产只能定义为收入或财富在投资者之间的分配。
(3)实物资产和金融资产可以在资产负债表中区分开来。
实物资产一般只能在资产负债表一边的资产方出现,而金融资产可以在资产负债表的两栏出现。
2、证券化要求拥有大量的潜在投资者。
要吸引他们,资本市场需要:(1)一个安全的行业法规体系、较低的税赋和可能的严格管制;(2)相当发达的投资银行业;(3)高度发达的经纪行和金融交易体系;(4)高度发达的信息系统,尤其是在财务披露方面。
这些都是一个高度发达的金融市场的必备(实际也是构成)条件。
3、证券化导致非中介化;也就是说,它提供给市场参与者一种无须经过中介机构的方法。
例如,抵押支撑的证券将资金融通到房地产市场而无须银行或储蓄机构从它们的自有资产中提供贷款。
随着证券化的进程,金融中介必须增加它在其他方面的业务能力,例如提供金融服务或向消费者和小企业提供短期资金的融通。
4、资产在初级市场被初次销售,发行公司收到销售净收入。
同一资产的每一次后续销售都发生在次级市场,从二次销售中得到的收入由卖主获得而不是由原始发行者获得。
投资银行家通常使在初级市场上销售的操作便利化,各种有组织的兑换和场外交易市场是次级市场的例子。
5、经纪人市场是指中间人不持有资产,只是将买主和卖主聚集到一起,以佣金为收入的市场,有组织的交换主要指经纪人市场。
第七章 货币需求一、概念题2.流动性陷阱(人大1999研):凯恩斯提出,货币需求是利率的减函数,即利率下降时货币需求会增加,然而利率下降到一定程度或者说到临界程度时,即债券价格上升到足够高度时,人们购买生息的债券会面临亏损的极大风险,这时,人们估计,如此高的债券价格只会下降,不会再上升,于是他们就会不肯再买债券,而宁肯保留货币在手中,在这样的情况下,货币供给的增加就不能使利率再向下降低,因为人们手中即使有多余的货币,再也不肯去买债券,从而使债券价格不会再上升,即利率不会再下跌,在这种情况下,就说经济正处于“流动性陷阱”之中,这时实行扩张货币政策就对利率和投资从而对就业和产出不会有效果。
4. 货币交易需求(南开1999研):指为满足日常交易活动所要求持有的货币余额。
它是凯恩斯在《就业、利息与货币通论》一书中首次提出来的。
货币交易需求主要决定于人们的收支水平和收支时距。
假定支出水平是收入的稳定函数,则货币交易需求也就是总收入的正相关函数,通常与收入水平呈相同方向变化。
收支时距也是影响货币交易需求的重要因素。
从本质上讲,货币交易需求来自收支时差,如果收入与支出是同步的,人们也将不会存在交易需求。
所以,在收入既定时,收支时距越长,货币交易需求越大;相反,收支时距越短,货币交易需求越小。
一般来说,满足交易动机的货币需求数量取决于收入水平,并与收入多少成正比,所以可将交易动机货币需求看作是收入的增函数。
同时,凯恩斯认为,货币交易需求取决于收入,而同利率无关。
早在40年代末,美国经济学家汉森(A ·H ·Hansen )在《货币理论和财政政策》一书中,就对凯恩斯的这一观点提出了质疑。
他指出,当利率上升到相当高的程度时,货币的交易余额也会具有利率弹性。
1952年,美国经济学家鲍莫尔(William Ballmol )发表了《现金的交易需求——存货的理论分析》一文,第一次深入地分析了交易性货币需求同利率之间的关系,从而提出了著名的“平方根定律”(The Square root Formula ),这一定律也称为鲍莫尔模型,交易性货币需求可写为ibT M C d 22==(式中T 表示某一时期可预见的交易支出,C 表示每次出售证券而获得的货币量,b 表示每次出售证券获取现金所需支出的手续费,i 表示市场利率),它表明:(1)货币的交易需求,并不与交易(收入)总量依同一比例变化,而是与交易总量的平方根依同一方向变化,这称为“平方根定律”;(2)货币的交易需求与利率有关,这就补充和发展了凯恩斯的货币需求理论;(3)由于存在着交易成本b,所以就需要持有一定货币。

第一章一、单项选择题1.下列选项中,()不是投资的特点。
A.投资通常是刚性兑付B.投资的复杂性和系统性C.投资周期相对较长D.投资项目实施的连续性和资金投入的波动性E.投资金融答案:A。
应为"投资具有风险性”。
2.下列选项中,()不是投资对经济增长的影响或作用的表现。
A.从资源配置角度看,投资影响经济结构,从而促进经济增长B.国民收入水平下降的年份,年度投资规模也相应减少,以保证人民生活水平改善的步伐C.从要素投入角度看,投资供给对经济增长有推动作用,增加生产资料供给,为扩大再生产提供物质条件D.从要素投入角度看,投资需求对经济增长有拉动作用,增加一笔投资会带来大于这笔投资额数倍的国民收入增加答案:B。
B为投资的特点之三。
年度投资规模的增长具有波动性。
年度投资规模与国民经济形势和国民收入多少密切相关。
二、多项选择题1.投资的要素包括()。
A.投资主体B.投资客体C.投资目的D.投资方式E.投资金额答案:ABCD。
2.投资学的研究方法包括()。
A.理论与实践相结合B.实证分析与规范分析相结合C.历史分析与比较分析相结合D.系统分析与定量分析相结合E.静态分析与动态分析相结合答案:ABCDE。
三、判断题1.从1992年开始,尽管我国经济体制改革不断深入,但社会各界对投资概念、投资范围的认识并未变化,投资只包括直接投资,即将资金直接投入建设项目形成固定资产和流动资产。
()答案:错。
解释:投资概念、投资范围的认识也不断深化,投资包括直接投资也包括间接投资,即购买有价证券,形成金融资产。
2.无论哪一种方式的金融投资,都是货币资金转化为金融资产,没有直接实现实物资产的增加。
现实生活中实物投资与金融投资具有相互依存和相互促进的关系,金融投资以实物投资为基础,除了某些特殊的金融投资外,并不转化为实物投资。
()答案:对。
3.尽管社会主义市场经济不断发展与完善,但我国原有的以国家投资为主的投融资格局仍未被打破。
Elton, Gruber, Brown, and GoetzmannModern Portfolio Theory and Investment Analysis, 7th EditionSolutions to Text Problems: Chapter 6Chapter 6: Problem 1The simultaneous equations necessary to solve this problem are:5 = 16Z1 + 20Z2 + 40Z37 = 20Z1 + 100Z2 + 70Z313 = 40Z1 + 70Z2 + 196Z3The solution to the above set of equations is:Z1 = 0.292831Z2 = 0.009118Z3 = 0.003309This results in the following set of weights for the optimum (tangent) portfolio:X1 = .95929 (95.929%)X2 = .02987 (2.987%)X3 = .01084 (1.084%The optimum portfolio has a mean return of 10.146% and a standard deviation of 4.106%.Chapter 6: Problem 2The simultaneous equations necessary to solve this problem are:11 -R F = 4Z1 + 10Z2 + 4Z314 -R F = 10Z1 + 36Z2 + 30Z317 -R F = 4Z1 + 30Z2 + 81Z3The optimum portfolio solutions using Lintner short sales and the given values for R F are: R F = 6% R F = 8% R F = 10%Z 1 3.510067 1.852348 0.194631Z 2-1.043624 -0.526845 -0.010070 Z 3 0.348993 0.214765 0.080537 X 1 0.715950 0.714100 0.682350X 2-0.212870 -0.203100 -0.035290 X 3 0.711800 0.082790 0.282350Tangent (Optimum) Portfolio Mean Return 6.105% 6.419% 11.812%Tangent (Optimum) Portfolio Standard Deviation 0.737% 0.802% 2.971%Chapter 6: Problem 3Since short sales are not allowed, this problem must be solved as a quadratic programming problem. The formulation of the problem is:PFP XR R σθ-=maxsubject to:11=∑=Ni iX0≥i X ∀ iChapter 6: Problem 4This problem is most easily solved using The Investment Portfolio software that comes with the text, but, since all pairs of assets are assumed to have the same correlation coefficient of 0.5, the problem can also be solved manually using the constant correlation form of the Elton, Gruber and Padberg “Simple Techniques” described in a later chapter.To use the software, open up the Markowitz module, select “file” then “new” then “group constant correlation” to open up a constant correlation table. Enter the input data into the appropriate cells by first double clicking on the cell to make it active. Once the input data have been entered, click on “optimizer” and then “run optimizer” (or simply cl ick on the optimizer icon). At that point, you can either select “full Markowitz” or “simple method.”If you select “full Markowitz,” you then select “short sales allowed/riskless lending and borrowing” and then enter 4 for both the lending and borrowin g rate and click “OK.” A graph of the efficient frontier then appears. You may then hit the “Tab” key to jump to the tangent portfolio, then click on “optimizer” and then “show portfolio” (or simply click on the “show portfolio” icon) to view and print the composition (investment weights), mean return and standard deviation of the tangent (optimum) portfolio.If instead you select “simple method,” you then select “short sales allowed with riskless asset” and enter 4 for the riskless rate and click “OK.” A table showing the investment weights of the tangent portfolio then appears.Regardless of the method used, the resulting investment weights for the optimum portfolio are as follows:Asset i X i1 -5.999%2 -17.966%3 21.676%4 0.478%5 -29.585%6 12.693%7 -59.170%8 -14.793%9 3.442%10 189.224%Given the above weights, the optimum (tangent) portfolio has a mean return of 18.907% and a standard deviation of 3.297%. The efficient frontier is a positively sloped straight line starting at the riskless rate of 4% and extending through thetangent portfolio (T) and out to infinity:Chapter 6: Problem 5Since the given portfolios, A and B, are on the efficient frontier, the GMV portfolio can be obtained by finding the minimum-risk combination of the two portfolios:31202163620162222-=⨯-+-=-+-=A B B A A B B GMVA X σσσσσ3111=-=GMVA GMVB X XThis gives %33.7=GMV R and %83.3=GMV σAlso, since the two portfolios are on the efficient frontier, the entire efficient frontier can then be traced by using various combinations of the two portfolios, starting with the GMV portfolio and moving up along the efficient frontier (increasing the weight in portfolio A and decreasing the weight in portfolio B). Since X B = 1 - X A the efficient frontier equations are:()()A A B A A A P X X R X R X R -⨯+=-+=18101()()()()A A A A A BA AB A A A P X X X X X X X X -+-+=-+-+=14011636121222222σσσσSince short sales are allowed, the efficient frontier will extend beyond portfolio A and out toward infinity. The efficient frontier appears as follows:。

课后习题1.简述债券的定义及种类。
2.影响债券定价的因素有哪些?这些因素如何影响债券价值的?3.简述债券定价原理。
4.简述常见的债券收益率。
5.什么是债券的时间价值?6.假定A公司发行了两种具有相同息票率和到期日的债券,一种是可赎回的,而另一种是不可赎回的,哪一种售价更高?7.有一30年期、息票率为8%的债券,计算其在市场半年利率为3%时的价格。
比较利率下降所造成的资本利得和当利率上升到5%时的资本损失。
8.两种10年期债券的到期收益率目前均为7%,各自的赎回价格皆为1100美元。
其中之一的息票率为6%,另一种为8%。
为简单起见,假定在债券的预期支付现值超过赎回价格时立即赎回。
如果市场利率突然降至6%,每种债券的资本利得分别是多少?第七章本章习题答案1. 债券(bond)是以借贷协议形式发行的证券。
借者为获取一定量的现金而向贷者发行(如出售)债券,债券是借者的“借据”。
这张借据使发行者有法律责任,需在指定日期向债券持有人支付特定款额。
典型的息票债券使发行者有义务在债券有效期内向持有人每半年付息一次,这叫做息票支付,因为在计算机发明之前,大多数债券带有息票,投资者将其剪下并寄给发行者索求利息。
债券到期时,发行者再付清面值(par value, face value)。
债券的息票率(coupon rate)决定了所需支付的利息:每年的支付按息票率乘以债券面值计算。
息票率、到期日和面值是债券契约(bond indenture)的各个组成部分,债券契约是债券发行者与持有者之间的合约。
政府债券的发行主体是政府。
政府债券是政府主体为筹措财政资金,以政府信用为基础向社会发行,承诺到期还本付息的一种债券凭证。
政府债券又分为中央政府债券和地方政府债券。
中央政府债券又称为国债。
公司债券,是公司按照法定程序发行,约定在一定期限内还本付息的债权债务凭证。
公司债券代表着发债的公司和投资者之间的一种债权债务关系。
债券持有人是公司的债权人, 不是所有者,无权参与或干涉公司经营管理,但债券持有人有权按期收回本息。

证券投资分析章节试题库及答案(7、8、9章)历年真题精选第7章证券组合管理理论一、单选题(以下备选答案中只有一项最符合题目要求)1.对于偏好均衡型证券组合的投资者来说,为增加基本收益,投资于()是合适的。
A.较高票面利率的附息债券B.期权C.较少分红的股票D.股指期货2.下列各项中标志着现代证券组合理论开端的是()。
A.证券组合选择B.套利定价理论C.资本资产定价模型D.有效市场理论3.在证券组合投资理论的发展历史中,提出简化均值方差模型的单因素模型的是()。
A.夏普B.法玛C.罗斯D.马柯威茨4.资本资产定价模型可以简写为()。
A.AprB.CAPMC.APMD.CATM5.组建证券投资组合时,个别证券选择是指()。
A.考察证券价格的形成机制,发现价格偏高价值的证券B.预测个别证券的价格走势及其波动情况,确定具体的投资品种C.对个别证券的基本面进行研判D.分阶段购买或出售某种证券6.证券组合管理方法对证券组合进行分类所依据的标准之一是()。
A.证券组合的期望收益率B.证券组合的风险C.证券组合的投资目标D.证券组合的分散化程度7.现有一个由两证券W和Q组成的组合,这两种证券完全正相关。
它们的投资比重分别为0.90和0.10。
如果W的期望收益率和标准差都比Q的大,那么()。
A.该组合的标准差一定大于Q的标准差B.该组合的标准差不可能大于Q的标准差C.该组合的期望收益率一定等于Q的期望收益率D.该组合的期望收益率一定小于Q的期望收益率8.某投资者拥有由两个证券构成的组合,这两种证券的期望收益率、标准差及权数分别为如下表所示数据,那么,该组合的标准差()。
A.等于25%B.小于25%C.可能大于25%D.一定大于25%9.证券组合的可行域中最小方差组合()。
A.可供厌恶风险的理性投资者选择B.其期望收益率最大C.总会被厌恶风险的理性投资者选择D.不会被风险偏好者选择10.现代组合投资理论认为,有效边界与投资者的无差异曲线的切点所代表的组合是该投资者的()。

金融风险管理第七章答案1什么是信用转移矩阵?信用转移矩阵是根据借款人的信用质量变动的历史数据建立起来的信用等级转移的概率矩阵。
矩阵中的概率反映了从经验的水平看,不同信用质量的借款人在下一年保持原状、升级、降级或者违约的相应的概率。
信用转移矩阵为贷款管理着提供了管理信用风险的参照。
2如何设定贷款集中限制?金融机构在管理一个贷款组合的时候,往往需要对贷款组合中的单个借款人或部门设立最大贷款规模或者最大贷款比例限制,以控制其在贷款组合中的风险集中程度。
对一个企业设置贷款集中限制需要事先进行综合评估。
比如,评估企业目前的资产组合的现值,考察企业的商业计划或者财务分析人员对企业未来经营状况的预测等方面都是最终限额决策的依据。
3.简述现代投资组合理论的基本思想,其在信用风险管理中的局限性是什么?现代投资组合理论起源于马柯维茨在1952年发表的一篇名为《资产组合选择》的论文,此后,现代投资组合理论的思想成为现代金融理论的基石。
马柯维茨建立了一个单期的投资模型,即投资者在t=0时刻购买一个投资组合,在t=1时刻卖出,把收回的钱用于消费或在投资。
同时,以预期收益率和收益率的标准差来描述一个证券的所有特征,并在此基础上建立方差分析模型。
由于证券组合中具有一系列不同风险――收益特征的证券,不同的比例安排会影响整个组合的风险――收益状况。
人们能通过购买多种证券,在风险与收益的权衡下找到一个属于自己的最优组合,实现在给定收益水平下的最小风险,或者给定风险水平下的最大收益。
在厌恶风险的前提下,不同投资者的风险――收益效用曲线是不同的。
因而对于同一条有效边界,不同的效用曲线与之相切得到不同的最优投资组合安排。
如果在一个资产组合中的各单项资产的收益率相关系数越小,或者为负,则会减小整个资产组合的风险程度。
对于一个资产组合的管理者来说,善于利用资产之间的相关性,就可以显著降低风险。
MPT为贷款组合管理者对风险――收益的权衡提供了一个即为有用的框架。
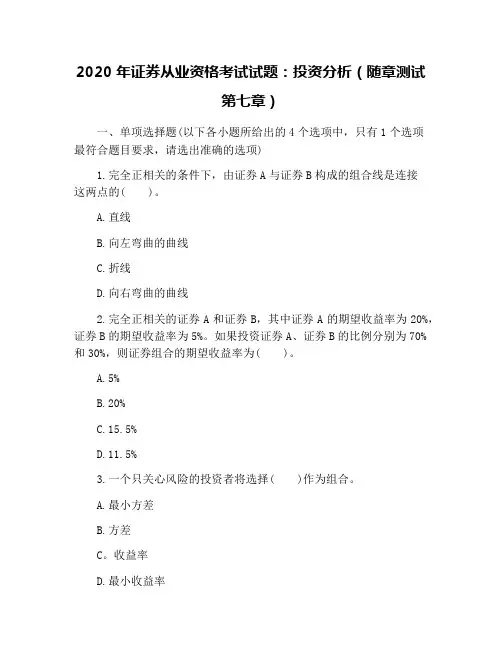
2020年证券从业资格考试试题:投资分析(随章测试第七章)一、单项选择题(以下各小题所给出的4个选项中,只有1个选项最符合题目要求,请选出准确的选项)1.完全正相关的条件下,由证券A与证券B构成的组合线是连接这两点的( )。
A.直线B.向左弯曲的曲线C.折线D.向右弯曲的曲线2.完全正相关的证券A和证券B,其中证券A的期望收益率为20%,证券B的期望收益率为5%。
如果投资证券A、证券B的比例分别为70%和30%,则证券组合的期望收益率为( )。
A.5%B.20%C.15.5%D.11.5%3.一个只关心风险的投资者将选择( )作为组合。
A.最小方差B.方差C。
收益率D.最小收益率4.关于β系数,下列说法错误的是( )。
A.β系数是由时间创造的B.β系数是衡量证券承担系统风险水平的指数C.β系数的绝对值数值越小,表明证券承担的系统风险越小D.β系数反映证券或组合的收益水平对市场平均收益水平变化的敏感性5.与市场组合的夏普指数相比。
一个高的夏普指数表明( )。
A.该组合位于市场线上方,该管理者比市场经营得差B.该组合位于市场线上方,该管理者比市场经营得好C.该组合位于市场线下方,该管理者比市场经营得差D.该组合位于市场线下方,该管理者比市场经营得好6.关于证券组合,下列说法准确的是( )。
A.证券组合是收益的组合B.证券组合是效率的组合C.组合是无差异曲线与有效边界的交点所表示的组合D.相较于其他有效组合,证券组合所在的无差异曲线的位置7.下列因素中,与久期之间呈相同关系的是( )。
A.票面利率B.到期期限C.市场利率D.到期收益率8.下列选项中,不属于投资者在构建证券投资组合时需要注意的问题是( )。
A.投资目标选择B.个别证券选择C.投资时机选择D.投资多元化9.假设某投资者2020年1月31日买入某公司股票每股价格2.6元,2020年1月30日卖出价格为3.5元,其间获得每股税后红利0.4元,不计其他费用,该投资者的投资收益率为( )。
1. Because very few securities will exhibit perfectly positive correlation,diversification will tend to reduce portfolio risk. Thus, for any given level of expected return, one would expect that portfolios will exhibit lower risk (lie further to the west in the feasible set) than individual portfolios (which will therefore lie to the east in the feasible set).2. Diversified portfolios are more efficient than individual securities. That is,diversified portfolios provide the investor with higher expected returns for given levels of risk and/or lower risk for given levels of expected return when compared with individual securities.Diagrammatically, individual securities will lie in the eastern portion of the feasible set. Hence they are dominated by diversified portfolios, which lie in the northwestern portion of the feasible set, including those on the efficient set.3. The macroeconomic forces that impact the U.S. economy tend to have a strongeffect on the earnings (and, hence, stock prices) of all domestic corporations, although the magnitude of this effect will vary among industries and specific firms.For example, a recession causes most companies to experience a downturn in earnings. While some companies may be more severely affected than others, nevertheless, the broad influence of a recession on general economic activity likely results in most companies' stocks performing poorly.Companies whose stocks would be expected to have a high positive covariance are auto and steel companies. When auto sales are strong (weak), the demand for steel generally rises (falls). The earnings of companies in both industries would rise and fall at roughly the same time and this movement would likely be anticipated by the earlier rise and fall of their stocks' prices.Companies whose stocks would be expected to have a low covariance are banks and gold mining firms. Rising interest rates and poor business conditions generally produce declining bank earnings. At the same time, a pessimistic economic outlook often causes investors to increase their demand for gold, which increases the price of gold and, therefore, the earnings of gold mining firms. The result is that the stock prices of banks and gold mining firms will not likely move in the same direction.4. It is the fact that all stocks do not have high positive covariances that causesdiversification to benefit the investor. That is, by diversifying, investors can reduce portfolio risk and thereby create more efficient portfolios. If stocks did have high positive covariances, then holding a well-diversified portfolio would not result in meaningful reductions in risk relative to holding individual securities.5. If the security in question had significant negative correlation with the rest of thesecurities in the portfolio, Mule might consider purchasing it even though it had anegative expected return. The diversifying nature of the security might reduce the risk of the portfolio sufficiently to make it attractive despite its inferior return potential.6. Given the expected returns and variance-covariance estimates for all securities, aninvestor can construct the efficient set. This information, combined with the unique risk-return preferences of the investor, allows the investor to determine his or her optimal portfolio. Diagrammatically, this optimal portfolio lies at the point of tangency between the investor's indifference curves and the efficient set.7. The standard deviation of a two-security portfolio is given by:[]σσσρσσp A A B B A B AB A B X X X X =++22122/In Dode's case:= [(.35)²(20)² + (.65)²(25)² + 2(.35)(.65)(20)(25)12]½= [49 + 264 + 22812]½The portfolio's standard deviation will be at a minimum when the correlation between securities A and B is -1.0. That is:= [49 + 264 - 228]½= 9.2%The portfolio's standard deviation will be at a maximum when the correlation between securities A and B is +1.0. That is: = [49 + 264 + 228]½= 23.3%17. The beta of a portfolio is defined as the weighted average of the componentsecurities' betas. In the case of Siggy's portfolio:ββP i i i X ==∑13= (.30 ⨯ 1.20) + (.50 ⨯ 1.05) + (.20 ⨯ 0.90)= 1.07Further, the standard deviation of a portfolio can be expressed as:()σβσσεp P I p =+22212/= [(1.07)²(18)² + (.30)²(5.0)² +(.50)²(8.0)²+ (.20)²(2.0)²]½= [370.9 + 2.3 + 16.0 + 0.2]½= [389.4]½ = 19.7%18.The total risk of a portfolio can be expressed as: σβσσεp p I p =+222Further, the unique risk (σεp 2) is the weighted average of the unique risks of the portfolio's individual securities. In the case of the first portfolio with four equal-weighted securities:()()σεp i 2221430025=⨯=∑..= 56.25 ⨯ 4 = 225.0Therefore the total risk of the first portfolio is:0.225)20()00.1(2221+⨯=σ= 625.01 = 25.0%In the case of the second portfolio with ten equal-weighted securities:()()σεp i 22211030010=⨯=∑..= 9.0 ⨯ 10 = 90.0Therefore the total risk of the second portfolio is:σ222210020900=⨯+(.)().= 490.02 = 22.1%。
金融风险管理第七章答案1什么是信用转移矩阵?信用转移矩阵是根据借款人的信用质量变动的历史数据建立起来的信用等级转移的概率矩阵。
矩阵中的概率反映了从经验的水平看,不同信用质量的借款人在下一年保持原状、升级、降级或者违约的相应的概率。
信用转移矩阵为贷款管理着提供了管理信用风险的参照。
2如何设定贷款集中限制?金融机构在管理一个贷款组合的时候,往往需要对贷款组合中的单个借款人或部门设立最大贷款规模或者最大贷款比例限制,以控制其在贷款组合中的风险集中程度。
对一个企业设置贷款集中限制需要事先进行综合评估。
比如,评估企业目前的资产组合的现值,考察企业的商业计划或者财务分析人员对企业未来经营状况的预测等方面都是最终限额决策的依据.3.简述现代投资组合理论的基本思想,其在信用风险管理中的局限性是什么?现代投资组合理论起源于马柯维茨在1952年发表的一篇名为《资产组合选择》的论文,此后,现代投资组合理论的思想成为现代金融理论的基石。
马柯维茨建立了一个单期的投资模型,即投资者在t=0时刻购买一个投资组合,在t=1时刻卖出,把收回的钱用于消费或在投资。
同时,以预期收益率和收益率的标准差来描述一个证券的所有特征,并在此基础上建立方差分析模型.由于证券组合中具有一系列不同风险――收益特征的证券,不同的比例安排会影响整个组合的风险――收益状况.人们能通过购买多种证券,在风险与收益的权衡下找到一个属于自己的最优组合,实现在给定收益水平下的最小风险,或者给定风险水平下的最大收益。
在厌恶风险的前提下,不同投资者的风险――收益效用曲线是不同的。
因而对于同一条有效边界,不同的效用曲线与之相切得到不同的最优投资组合安排。
如果在一个资产组合中的各单项资产的收益率相关系数越小,或者为负,则会减小整个资产组合的风险程度.对于一个资产组合的管理者来说,善于利用资产之间的相关性,就可以显著降低风险。
MPT为贷款组合管理者对风险――收益的权衡提供了一个即为有用的框架。
Elton, Gruber, Brown, and GoetzmannModern Portfolio Theory and Investment Analysis , 7th EditionSolutions to Text Problems: Chapter 7Chapter 7: Problem 1We will illustrate the answers for stock A and the market portfolio (S&P 500); the answers for stocks B and C are found in an identical manner.The sample mean monthly return on stock A is:%946.21294.048.775.1207.118.197.879.216.357.112.427.1505.1212121=-+++---++-+==∑=t AtA RRThe sample mean monthly return on the market portfolio (the answer to part 1.E) is:%005.31215.147.216.646.311.277.643.441.448.441.299.528.1212121=-+++--+++++==∑=t m tm RRUsing data given in the problem and the above two sample mean monthly returns, we have the following: Month tAAt R R - ()2AAtR R-mm t R R - ()2mmtR R-()()mm t A AtR R R R--1 9.104 82.883 9.275 86.026 84.442 12.324 151.881 2.985 8.910 36.793 -7.066 49.928 -0.595 0.354 4.2 4 -1.376 1.893 1.475 2.176 -2.03 5 0.214 0.046 1.405 1.974 0.3 6 -5.736 32.902 1.425 2.031 -8.17 7 -11.916 141.991 -9.775 95.551 116.48 8 -4.126 17.024 -5.115 26.163 21.19 -1.876 3.519 0.455 0.207 -0.85 10 9.804 96.118 3.155 9.954 30.93 11 4.534 20.557 -0.535 0.286 -2.43 12-3.886 15.101 -4.155 17.264 16.15Sum0.00613.840.00250.90296.91The sample variance and standard deviation of the stock A’s monthly return are:()15.511284.6131212122==-=∑=t AAtAR Rσ%15.715.51==A σThe sample variance (the answer to part 1.F) and standard deviation of the market portfolio’s monthly return are:()91.201290.2501212122==-=∑=t mm tmR Rσ%57.491.20==m σThe sample covariance of the returns on stock A and the market portfolio is:()()[]74.241291.29612121==--=∑=t mm t A AtAm R R R RσThe sample correlation coefficient of the returns on stock A and the market portfolio (the answer to part 1.D) is:757.057.415.774.24=⨯==mA Am Am σσσρThe sample beta of stock A (the answer to part 1.B) is:183.191.2074.242===mAm A σσβThe sample alpha of stock A (the answer to part 1.A) is:%609.0%005.3183.1%946.2-=⨯-=-=m A A A R R βαEach month’s sample residual is security A’s actual return that month minus the return that month predicted by the regression. The regression’s predic ted monthly return is: mt A A edict ed t A R R βα-=Pr ,,The sample residual for each month t is then: edict ed t A At At R R Pr ,,-=εSo we have the following:Month tAt R edict edt A R Pr,,At ε2At ε112.05 13.92 -1.873.5 2 15.27 6.48 8.79 77.26 3 -4.12 2.24 -6.36 40.45 4 1.57 4.69 -3.12 9.73 5 3.16 4.61 -1.45 2.1 6 -2.79 4.63 -7.42 55.06 7 -8.97 -8.62 -0.35 0.12 8 -1.18 -3.11 1.93 3.72 9 1.07 3.48 -2.41 5.81 10 12.756.68 6.07 36.84 117.48 2.31 5.17 26.73 12 -0.94 -1.97 1.02 1.04Sum: 0.00 262.36Since the sample residuals sum to 0 (because of the way the sample alpha and beta are calculated), the sample mean of the sample residuals also equals 0 and the sample variance and standard deviation of the sample residuals (the answer to part 1.C) are: ()863.211236.26212121211212===-=∑∑==t Att AAtAεεεσε%676.4863.21==A εσRepeating the above analysis for all the stocks in the problem yields: Stock A Stock B Stock Calpha -0.609% 2.964%-3.422%beta 1.183 1.021 2.322correlation with market 0.757 0.684 0.652standard deviation of sample residuals * 4.676% 4.983% 12.341%with %005.3=m R and 91.202=m σ.*Note that most regression programs use N - 2 for the denominator in the sample residual variance formula and use N - 1 for the denominator in the other variance formulas (where N is the number of time series observations). As is explained in the text, we have instead used N for the denominator in all the variance formulas. To convert the variance from a regression program to our results, simply multiply the variance by eitherNN 2- orNN 1-.Chapter 7: Problem 2 A. A.1portfolio from Problem 1 we have:%946.2005.3183.1609.0=⨯+-=A RSimilarly:%032.6=B R ; %556.3=C RThe Sharpe single-index model's formula for a security's variance of return is:2222i m i i εσσβσ+=Using the beta and residual standard deviation for stock A along with the variance of return on the market portfolio from Problem 1 we have:14.51676.491.20183.1222=+⨯=A σSimilarly: 62.462=b σ; 0.2652=c σ A.2From Problem 1 we have:%946.2=A R ; %031.6=B R ; %554.3=C R15.512=A σ; 61.462=B σ; 0.2652=C σ B. B.1According to the Sharpe single-index model, the covariance between the returns on a pair of assets is:2m j i ij SIM σββσ=Using the betas for stocks A and B along with the variance of the market portfolio from Problem 1 we have:254.2591.20021.1183.1=⨯⨯=AB SIM σSimilarly:433.57=AC SIM σ; 568.49=BC SIM σThe formula for sample covariance from the historical time series of 12 pairs of returns on security i and security j is:()()12121∑=--=t j jt i itij R R R RσApplying the above formula to the monthly data given in Problem 1 for securities A, B and C gives:462.18=AB σ; 618.61=AC σ; 085.54=BC σ C. C.1Using the earlier results from the Sharpe single-index model, the mean monthly return and standard deviation of an equally weighted portfolio of stocks A, B and C are:%18.4%556.331%032.631%946.231=⨯+⨯+⨯=P R%348.857.493143.573125.253120.2653162.463115.5131222222=⎪⎪⎭⎫⎝⎛⨯⎪⎭⎫⎝⎛+⨯⎪⎭⎫ ⎝⎛+⨯⎪⎭⎫ ⎝⎛⨯+⨯⎪⎭⎫ ⎝⎛+⨯⎪⎭⎫ ⎝⎛+⨯⎪⎭⎫ ⎝⎛=P σ C.2Using the earlier results from the historical data, the mean monthly return and standard deviation of an equally weighted portfolio of stocks A, B and C are:%18.4%554.331%031.631%946.231=⨯+⨯+⨯=P R%374.808.543162.613146.183120.2653162.463115.5131222222=⎪⎪⎭⎫⎝⎛⨯⎪⎭⎫ ⎝⎛+⨯⎪⎭⎫ ⎝⎛+⨯⎪⎭⎫ ⎝⎛⨯+⨯⎪⎭⎫⎝⎛+⨯⎪⎭⎫ ⎝⎛+⨯⎪⎭⎫ ⎝⎛=P σThe slight differences between the answers to parts A.1 and A.2 are simply due to rounding errors. The results for sample mean return and variance from either the Sharpe single-index model formulas or the sample-statistics formulas are in fact identical.The answers to parts B.1 and B.2 differ for sample covariance because the Sharpe single-index model assumes the covariance between the residual returns of securities i and j is 0 (cov(εi εj ) = 0), and so the single-index form of sample covariance of total returns is calculated by setting the sample covariance of the sample residuals equal to 0. The sample-statistics form of sample covariance of total returns incorporates the actual sample covariance of the sample residuals.The answers in parts C.1 and C.2 for mean returns on an equally weighted portfolio of stocks A, B and C are identical because the Sharpe single-index model formula for the mean return on an individual stock yields a result identical to that of the sample-statistics formula for the mean return on the stock.The answers in parts C.1 and C.2 for standard deviations of return on an equally weighted portfolio of stocks A, B and C are different because the Sharpe single-index model formula for the sample covariance of returns on a pair of stocks yields a result different from that of the sample-statistics formula for the sample covariance of returns on a pair of stocks.Chapter 7: Problem 3Recall from t he text that the Vasicek technique’s forecast of security i ’s beta (2i β) is:121212112121212i i i i i βσσσβσσσβββββββ⨯++⨯+=where 1β is the average beta across all sample securities in the historical period (in this problem referred to as the “market beta”), 1i β is the beta of security i in thehistorical period, 21βσ is the variance of all the sample securities’ betas in the historical period and 21i βσ is the square of the standard error of the estimate of betafor security i in the historical period.If the standard errors of the estimates of all the betas of the sample securities in the historical period are the same, then, for each security i , we have:a i =21βσ where a is a constant across all the sample securities.Therefore, we have for any security i :()111212112121i i i X X aa aβββσσβσββββ-+=⨯++⨯+=This shows that, under the assumption that the standard errors of all historical betas are the same, the forecasted beta for any security using the Vasicek technique is a simple weighted average (proportional weighting) of 1β (the “market beta”) and 1i β (the security’s historical beta), where the weights are the same for each security.Chapter 7: Problem 4Letting the historical period of the year of monthly returns given in Problem 1 equal 1 (t = 1), then the forecast period equals 2 and the Blume forecast equation is:1260.041.0i i ββ+=Using the earlier answer to Problem 1 for the estimate of beta from the historical period for stock A along with the above equation we obtain the stock’s forecasted beta:120.1183.160.041.060.041.012=⨯+=+=A A ββSimilarly:023.12=B β; 803.12=C βChapter 7: Problem 5 A.%4.13=B R ; %4.7=C R ; %2.11=D R B.σ2B = 43.25; σ2C = 20; σ2D = 36.25 C.σAC = 30; σAD = 33.75; σBC = 26; σBD = 29.25; σCD = 18Chapter 7: Problem 6 A.Recall that the formula for a portfolio's beta is: i N is the number of assets in the portfolio.Since there are four assets in Problem 5, N = 4 and X i equals 1/4 for each asset in。
1、现代投资组合理论的创始者是()。
A.尤金.珐玛B.威廉.夏普C.哈里.马科维茨D.斯蒂芬.罗斯正确答案:C2、马科维茨描述的投资组合理论主要关注于()。
A.积极的资产管理以扩大收益B.系统风险的减少C.非系统风险的确认D.分散化对投资组合风险的影响正确答案:D3、风险的存在意味着(A.投资者将受损B.收益的标准差大于期望价值C.多于一种结果的可能性D.最后的财富大于初始财富正确答案:C4、市场风险也可解释为()。
A.个别风险,不可分散化的风险B.个别风险,可分散化的风险C.系统风险,可分散化的风险D.系统风险,不可分散化的风险5、美国“9·11”事件发生后引起的全球股市下跌的风险属于()。
A.非系统性风险B.信用风险C.流动性风险D.系统性风险正确答案:D6、风险资产组合的方差是()。
A.组合中各个证券方差的加权和B.组合中各个证券协方差的加权和C.组合中各个证券方差的和D.组合中各个证券方差和协方差的加权和正确答案:D7、(),投资组合风险就越低。
A.相关系数越低,分散化就越有效B.协方差为负,相关系数就越大C.协方差为正,相关系数就越小D.相关系数越高,分散化就越有效正确答案:A8、下面对投资组合分散化的说法哪些是正确的?()A.适当的分散化可以减少或消除系统风险B.分散化减少投资组合的期望收益,因为它减少了投资组合的总体风险C.除非投资组合包含至少30只个股,分散化降低风险的好处不会充分显现D.当把越来越多的证券加入投资组合时,总体风险一般会以递减的速率下降9、当其他条件相同,分散化投资在哪种情况下最有效?()A.组成证券的收益不相关B.组成证券的收益正相关C.组成证券的收益负相关D.组成证券的收益很高正确答案:C10、以下关于最小方差组合的陈述哪些是正确的?()A.它的期望收益比无风险利率低B.它的方差小于其他证券或组合C.它包含所有证券D.它可能是最优风险组合正确答案:B11、1963年,()发表《对于“资产组合”分析的简化模型》,在该文中提出单指数模型。
投资组合课后题及答案P62Q9. Mr. Franklin is 70 years of age, is in excellent health, pursues a simple but active lifestyle, and has no children. He has interest in a private company for $90 million and has decided that a medical research foundation will receive half the proceeds now; it will also be the primary beneficiary of his estate upon his death. Mr. Franklin is committed to the foundation’s well-being because he believes strongly that, through it, a cure will be found for the disease that killed his wife. He now realizes that an appropriate investment policy and asset allocations are required if his goals are to be met through investment of his considerable assets. Currently, the following assets are available for use in building an appropriate portfolio:$45.0 million cash (from sale of the private company interest, net of pending;$45 million gift to the foundation);10.0 million stocks and bonds ($5 million each);9.0 million warehouse property (now fully leased);1.0 million Franklin residence;$65.0 million total available assetsa. Formulate and justify an investment policy statement setting forth the appropriate guidelines within which future investment actions should take place. Your policy statement must encompass all relevant objective and constraint considerations.b. Recommend and justify a long-term asset allocation that is consistent with the investment policy statement you created in Part a. Briefly explain the key assumptions you made in generating your allocation.答案a.由以上可知,Mr. Franklin丧偶、无子、70岁、身体健康、拥有大笔流动性较好资产、愿意将其部分现金资产捐献给医学研究基金会、在其去世后其房产也留给这家基金会、无负债、处在较高的纳税等级、缺乏资产管理技术、当前没有特定的支出负担、当前对于资产的流动性没有特殊要求。
2015年证券从业资格考试内部资料2015证券投资分析第七章 证券组合管理理论知识点:无差异曲线特征● 定义:无差异曲线有六个特征● 详细描述:(1)无差异曲线是由左至右向上弯曲的曲线。
(2)每个投资者的无差异曲线形成密布整个平面又互不相交的曲线簇。
(3)同一条无差异曲线上的组合给投资者带来的满意程度相同。
(4)不同无差异曲线上的组合给投资者带来的满意程度不同。
(5)无差异曲线的位置越高,其上的投资组合带来的满意程度就越高。
(6)无差异曲线向上弯曲的程度大小反映投资者承受风险的能力强弱。
例题:1.追求收益且厌恶风险的投资者的无差异曲线具有的特征是( )。
A.无差异曲线是由左至右向下弯曲的曲线B.同一条无差异曲线上的投资组合给投资者带来的满意程度相同C.不同无差异曲线上的投资组合给投资者带来的满意程度相同D.无差异曲线布满整个平面并相交正确答案:B解析:无差异曲线是由左至右向上弯曲的曲线;不同无差异曲线上的投资组合给投资者带来的满意程度不同;无差异曲线布满整个平面但是不相交。
2.在以期望收益率为纵轴、标准差为横轴的坐标平面上,在同一条无差异曲线上,改变证券期望收益率()该投资者的满意程度。
A.会增加B.会减少C.不改变D.不确定正确答案:C解析:同一条无差异曲线,投资者的满意程度是相同的。
3.根据现代组合选择理论,下列说法正确的有()。
A.不同投资者因为偏好态度不同,会拥有不同的无差异曲线簇B.无差异曲线的陡峭程度不反映投资者的偏好个性C.对于不知足且厌恶风险的投资者而言,随着风险水平增加,投资者要求的边际补偿率越来越大D.多个证券组合可行域的形状不仅与组合内证券的期望收益、风险和相关性有关,还依赖组合中证券的投资权重正确答案:A,C,D解析:无差异曲线越陡表明投资者对风险越厌恶。
4.一般来说,()是马柯威茨均值方差模型中的投资者无差异曲线的特征。
A.无差异曲线向左上方倾斜B.无差异曲线向右上方倾斜C.无差异曲线是一条水平直线D.同一投资者的无差异曲线之间互不相交正确答案:B,D解析:无差异曲线都具有如下六个特点:(1)无差异曲线是由左至右向上弯曲的曲线。
Elton, Gruber, Brown, and GoetzmannModern Portfolio Theory and Investment Analysis , 7th EditionSolutions to Text Problems: Chapter 7Chapter 7: Problem 1We will illustrate the answers for stock A and the market portfolio (S&P 500); the answers for stocks B and C are found in an identical manner.The sample mean monthly return on stock A is:%946.21294.048.775.1207.118.197.879.216.357.112.427.1505.1212121=-+++---++-+==∑=t AtA RRThe sample mean monthly return on the market portfolio (the answer to part 1.E) is:%005.31215.147.216.646.311.277.643.441.448.441.299.528.1212121=-+++--+++++==∑=t m tm RRUsing data given in the problem and the above two sample mean monthly returns, we have the following: Month tAAt R R - ()2AAtR R-mm t R R - ()2mmtR R-()()mm t A AtR R R R--1 9.104 82.883 9.275 86.026 84.442 12.324 151.881 2.985 8.910 36.793 -7.066 49.928 -0.595 0.354 4.2 4 -1.376 1.893 1.475 2.176 -2.03 5 0.214 0.046 1.405 1.974 0.3 6 -5.736 32.902 1.425 2.031 -8.17 7 -11.916 141.991 -9.775 95.551 116.48 8 -4.126 17.024 -5.115 26.163 21.19 -1.876 3.519 0.455 0.207 -0.85 10 9.804 96.118 3.155 9.954 30.93 11 4.534 20.557 -0.535 0.286 -2.43 12-3.886 15.101 -4.155 17.264 16.15Sum0.00613.840.00250.90296.91The sample variance and standard deviation of the stock A’s monthly return are:()15.511284.6131212122==-=∑=t AAtAR Rσ%15.715.51==A σThe sample variance (the answer to part 1.F) and standard deviation of the market portfolio’s monthly return are:()91.201290.2501212122==-=∑=t mm tmR Rσ%57.491.20==m σThe sample covariance of the returns on stock A and the market portfolio is:()()[]74.241291.29612121==--=∑=t mm t A AtAm R R R RσThe sample correlation coefficient of the returns on stock A and the market portfolio (the answer to part 1.D) is:757.057.415.774.24=⨯==mA Am Am σσσρThe sample beta of stock A (the answer to part 1.B) is:183.191.2074.242===mAm A σσβThe sample alpha of stock A (the answer to part 1.A) is:%609.0%005.3183.1%946.2-=⨯-=-=m A A A R R βαEach month’s sample residual is security A’s actual return that month minus the return that month predicted by the regression. The regression’s predic ted monthly return is: mt A A edict ed t A R R βα-=Pr ,,The sample residual for each month t is then: edict ed t A At At R R Pr ,,-=εSo we have the following:Month tAt R edict edt A R Pr,,At ε2At ε112.05 13.92 -1.873.5 2 15.27 6.48 8.79 77.26 3 -4.12 2.24 -6.36 40.45 4 1.57 4.69 -3.12 9.73 5 3.16 4.61 -1.45 2.1 6 -2.79 4.63 -7.42 55.06 7 -8.97 -8.62 -0.35 0.12 8 -1.18 -3.11 1.93 3.72 9 1.07 3.48 -2.41 5.81 10 12.756.68 6.07 36.84 117.48 2.31 5.17 26.73 12 -0.94 -1.97 1.02 1.04Sum: 0.00 262.36Since the sample residuals sum to 0 (because of the way the sample alpha and beta are calculated), the sample mean of the sample residuals also equals 0 and the sample variance and standard deviation of the sample residuals (the answer to part 1.C) are: ()863.211236.26212121211212===-=∑∑==t Att AAtAεεεσε%676.4863.21==A εσRepeating the above analysis for all the stocks in the problem yields: Stock A Stock B Stock Calpha -0.609% 2.964%-3.422%beta 1.183 1.021 2.322correlation with market 0.757 0.684 0.652standard deviation of sample residuals * 4.676% 4.983% 12.341%with %005.3=m R and 91.202=m σ.*Note that most regression programs use N - 2 for the denominator in the sample residual variance formula and use N - 1 for the denominator in the other variance formulas (where N is the number of time series observations). As is explained in the text, we have instead used N for the denominator in all the variance formulas. To convert the variance from a regression program to our results, simply multiply the variance by eitherNN 2- orNN 1-.Chapter 7: Problem 2 A. A.1portfolio from Problem 1 we have:%946.2005.3183.1609.0=⨯+-=A RSimilarly:%032.6=B R ; %556.3=C RThe Sharpe single-index model's formula for a security's variance of return is:2222i m i i εσσβσ+=Using the beta and residual standard deviation for stock A along with the variance of return on the market portfolio from Problem 1 we have:14.51676.491.20183.1222=+⨯=A σSimilarly: 62.462=b σ; 0.2652=c σ A.2From Problem 1 we have:%946.2=A R ; %031.6=B R ; %554.3=C R15.512=A σ; 61.462=B σ; 0.2652=C σ B. B.1According to the Sharpe single-index model, the covariance between the returns on a pair of assets is:2m j i ij SIM σββσ=Using the betas for stocks A and B along with the variance of the market portfolio from Problem 1 we have:254.2591.20021.1183.1=⨯⨯=AB SIM σSimilarly:433.57=AC SIM σ; 568.49=BC SIM σThe formula for sample covariance from the historical time series of 12 pairs of returns on security i and security j is:()()12121∑=--=t j jt i itij R R R RσApplying the above formula to the monthly data given in Problem 1 for securities A, B and C gives:462.18=AB σ; 618.61=AC σ; 085.54=BC σ C. C.1Using the earlier results from the Sharpe single-index model, the mean monthly return and standard deviation of an equally weighted portfolio of stocks A, B and C are:%18.4%556.331%032.631%946.231=⨯+⨯+⨯=P R%348.857.493143.573125.253120.2653162.463115.5131222222=⎪⎪⎭⎫⎝⎛⨯⎪⎭⎫⎝⎛+⨯⎪⎭⎫ ⎝⎛+⨯⎪⎭⎫ ⎝⎛⨯+⨯⎪⎭⎫ ⎝⎛+⨯⎪⎭⎫ ⎝⎛+⨯⎪⎭⎫ ⎝⎛=P σ C.2Using the earlier results from the historical data, the mean monthly return and standard deviation of an equally weighted portfolio of stocks A, B and C are:%18.4%554.331%031.631%946.231=⨯+⨯+⨯=P R%374.808.543162.613146.183120.2653162.463115.5131222222=⎪⎪⎭⎫⎝⎛⨯⎪⎭⎫ ⎝⎛+⨯⎪⎭⎫ ⎝⎛+⨯⎪⎭⎫ ⎝⎛⨯+⨯⎪⎭⎫⎝⎛+⨯⎪⎭⎫ ⎝⎛+⨯⎪⎭⎫ ⎝⎛=P σThe slight differences between the answers to parts A.1 and A.2 are simply due to rounding errors. The results for sample mean return and variance from either the Sharpe single-index model formulas or the sample-statistics formulas are in fact identical.The answers to parts B.1 and B.2 differ for sample covariance because the Sharpe single-index model assumes the covariance between the residual returns of securities i and j is 0 (cov(εi εj ) = 0), and so the single-index form of sample covariance of total returns is calculated by setting the sample covariance of the sample residuals equal to 0. The sample-statistics form of sample covariance of total returns incorporates the actual sample covariance of the sample residuals.The answers in parts C.1 and C.2 for mean returns on an equally weighted portfolio of stocks A, B and C are identical because the Sharpe single-index model formula for the mean return on an individual stock yields a result identical to that of the sample-statistics formula for the mean return on the stock.The answers in parts C.1 and C.2 for standard deviations of return on an equally weighted portfolio of stocks A, B and C are different because the Sharpe single-index model formula for the sample covariance of returns on a pair of stocks yields a result different from that of the sample-statistics formula for the sample covariance of returns on a pair of stocks.Chapter 7: Problem 3Recall from t he text that the Vasicek technique’s forecast of security i ’s beta (2i β) is:121212112121212i i i i i βσσσβσσσβββββββ⨯++⨯+=where 1β is the average beta across all sample securities in the historical period (in this problem referred to as the “market beta”), 1i β is the beta of security i in thehistorical period, 21βσ is the variance of all the sample securities’ betas in the historical period and 21i βσ is the square of the standard error of the estimate of betafor security i in the historical period.If the standard errors of the estimates of all the betas of the sample securities in the historical period are the same, then, for each security i , we have:a i =21βσ where a is a constant across all the sample securities.Therefore, we have for any security i :()111212112121i i i X X aa aβββσσβσββββ-+=⨯++⨯+=This shows that, under the assumption that the standard errors of all historical betas are the same, the forecasted beta for any security using the Vasicek technique is a simple weighted average (proportional weighting) of 1β (the “market beta”) and 1i β (the security’s historical beta), where the weights are the same for each security.Chapter 7: Problem 4Letting the historical period of the year of monthly returns given in Problem 1 equal 1 (t = 1), then the forecast period equals 2 and the Blume forecast equation is:1260.041.0i i ββ+=Using the earlier answer to Problem 1 for the estimate of beta from the historical period for stock A along with the above equation we obtain the stock’s forecasted beta:120.1183.160.041.060.041.012=⨯+=+=A A ββSimilarly:023.12=B β; 803.12=C βChapter 7: Problem 5 A.%4.13=B R ; %4.7=C R ; %2.11=D R B.σ2B = 43.25; σ2C = 20; σ2D = 36.25 C.σAC = 30; σAD = 33.75; σBC = 26; σBD = 29.25; σCD = 18Chapter 7: Problem 6 A.Recall that the formula for a portfolio's beta is: i N is the number of assets in the portfolio.Since there are four assets in Problem 5, N = 4 and X i equals 1/4 for each asset in。