曼昆经济学原理第七版第二章
- 格式:pdf
- 大小:2.75 MB
- 文档页数:40
曼昆经济学原理(双语)带你读《经济学原理》,每日更新,欢迎来主页查看。
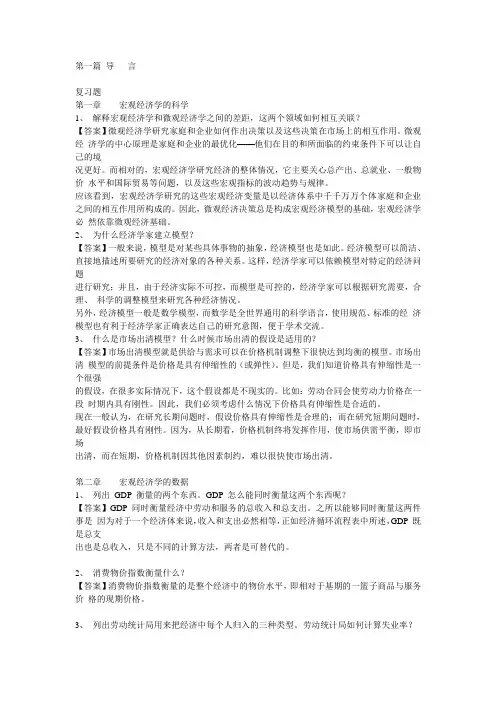
翻译部分经本人校对修改,本文仅供学习交流使用,版权归相关权利人所有!第二章像经济学家一样思考2.6Our Second Model: The Production Possibilities Frontier我们的第二个模型:生产可能性边界Most economic models, unlike the circular-flow diagram, are built using the tools of mathematics. Here we use one of the simplest such models, called the production possibilities frontier, to illustrate some basic economic ideas.与循环流向图不同,大多数经济模型都是用数学工具来建立的。
这里我们考虑一个最简单的这类模型,这个模型称为生产可能性边界,并运用这个模型去阐明一些基本经济思想。
Although real economies produce thousands of goods and services, let’s consider an economy that produces only two goods—cars and computers. Together, the car industry and the computer industry use all of the economy’s factors of production. The production possibilities frontieris a graph that shows the various combinations of output—in this case, cars and computers— that the economy can possibly produce given the available factors of production and the available production technology that firms use to turn these factors into output.虽然现实世界生产成千上万种物品与劳务,但我们设想一个只生产两种物品——汽车与电脑——的经济。
c.Real GDP falls because with fewer workers on the job, firms produce less. Thisaccurately reflects a fall in economic well-being.d.Real GDP falls because the firms that lay off workers produce less. This decreaseseconomic well-being because workers’ incomes fall (the income side), and there are fewer goods for people to buy (the expenditure side).e.Real GDP is likely to fall, as firms shift toward production methods that producefewer goods but emit less pollution. Economic well-being, however, may rise. The economy now produces less measured output but more clean air; clean air is not traded in markets and, thus, does not show up in measured GDP, but is neverthe-less a good that people value.f.Real GDP rises because the high-school students go from an activity in which theyare not producing market goods and services to one in which they are. Economic well-being, however, may decrease. I n ideal national accounts, attending school would show up as investment because it presumably increases the future produc-tivity of the worker. Actual national accounts do not measure this type of invest-ment. Note also that future GDP may be lower than it would be if the students stayed in school, since the future work force will be less educated.g.Measured real GDP falls because fathers spend less time producing market goodsand services. The actual production of goods and services need not have fallen, however. Measured production (what the fathers are paid to do) falls, but unmea-sured production of child-rearing services rises.9.As Senator Robert Kennedy pointed out, GDP is an imperfect measure of economic per-formance or well-being. In addition to the left-out items that Kennedy cited, GDP also ignores the imputed rent on durable goods such as cars, refrigerators, and lawnmowers;many services and products produced as part of household activity, such as cooking and cleaning; and the value of goods produced and sold in illegal activities, such as the drug trade. These imperfections in the measurement of GDP do not necessarily reduce its usefulness. As long as these measurement problems stay constant over time, then GDP is useful in comparing economic activity from year to year. Moreover, a large GDP allows us to afford better medical care for our children, newer books for their education, and more toys for their play. Finally, countries with higher levels of GDP tend to have higher levels of life expectancy, better access to clean water and sanitation, and higher levels of education. GDP is therefore a useful measure for comparing the level of growth and development across countries.。
曼昆《经济学原理(微观经济学分册)》(第7版)课后习题详解第1章经济学十大原理一、概念题1.稀缺性(scarcity)答:经济学研究的问题和经济物品都是以稀缺性为前提的。
稀缺性指在给定的时间内,相对于人的需求而言,经济资源的供给总是不足的,也就是资源的有用性与有限性。
人类消费各种物品的欲望是无限的,满足这种欲望的物品,有的可以不付出任何代价而随意取得,称之为自由物品,如阳光和空气;但绝大多数物品是不能自由取用的,因为世界上的资源(包括物质资源和人力资源)是有限的,这种有限的、为获取它必须付出某种代价的物品,称为“经济物品”。
正因为稀缺性的客观存在,地球上就存在着资源的有限性和人类的欲望与需求的无限性之间的矛盾。
经济学的一个重要研究任务就是:“研究人们如何进行抉择,以便使用稀缺的或有限的生产性资源(土地、劳动、资本品如机器、技术知识)来生产各种商品,并把它们分配给不同的社会成员进行消费。
”也就是从经济学角度来研究使用有限的资源来生产什么、如何生产和为谁生产的问题。
2.经济学(economics)答:经济学是研究如何将稀缺的资源有效地配置给相互竞争的用途,以使人类的欲望得到最大限度满足的科学。
时下经常见诸国内报刊文献的“现代西方经济学”一词,大多也都在这个意义上使用。
自从凯恩斯的名著《就业、利息和货币通论》于1936年发表之后,西方经济学界对经济学的研究便分为两个部分:微观经济学与宏观经济学。
微观经济学是以单个经济主体(作为消费者的单个家庭或个人,作为生产者的单个厂商或企业,以及单个产品或生产要素市场)为研究对象,研究单个经济主体面对既定的资源约束时如何进行选择的科学。
宏观经济学则以整个国民经济为研究对象,主要着眼于对经济总量的研究。
3.效率(efficiency)答:效率指人们在实践活动中的产出与投入之比值,或者是效益与成本之比值,如果比值大,效率就高;反之,比值小,效率就低。
效率与产出或者收益的大小成正比,而与成本或投入成反比,也就是说,如果想提高效率,必须降低成本或投入,提高收益或产出。

曼昆的经济学原理第七版入门曼昆的经济学原理第七版是一本经济学入门教材,内容涵盖了经济学的基本原理和概念。
本文将围绕此书展开,介绍该书的主要内容和特点。
第一章:经济学原理与经济学思维本章介绍了经济学的定义和研究对象,强调了经济学思维的重要性。
经济学是一门研究人们如何利用稀缺资源来满足无限的需求的学科,经济学原理则是指导经济决策和行为的基本规律。
第二章:供给与需求本章介绍了供给和需求的基本概念和关系。
供给是指生产者愿意提供的商品或服务的数量,需求是指消费者愿意购买的商品或服务的数量。
供给和需求的平衡决定了市场价格和数量。
第三章:市场机制本章介绍了市场机制的作用和运行方式。
市场机制是指通过供求关系来调节资源配置和价格形成的一种自由市场机制。
市场机制能够有效地分配资源,提高经济效益。
第四章:弹性与供求本章介绍了价格弹性和收入弹性的概念和计算方法。
价格弹性是指商品需求或供给对价格变化的敏感程度,收入弹性是指商品需求对收入变化的敏感程度。
弹性分析有助于了解市场的灵活性和调节能力。
第五章:消费者、生产者和效率本章介绍了消费者和生产者的行为和决策过程,以及市场效率的概念和评价方法。
消费者和生产者的行为决定了市场供求关系,市场效率则是指在给定资源条件下实现最大福利的能力。
第六章:供给、需求和政府政策本章介绍了政府在市场经济中的角色和政策工具。
政府通过税收、补贴、价格管制等手段来影响市场供求关系,实现经济调控和公共利益。
第七章:市场结构本章介绍了不同市场结构的特点和运行机制。
市场结构包括完全竞争市场、垄断市场、垄断竞争市场和寡头垄断市场。
不同市场结构对供给、需求和价格形成有不同的影响。
第八章:劳动市场本章介绍了劳动力市场的特点和运行机制。
劳动力市场是指劳动力供给和需求的市场,劳动力市场的供求关系决定了劳动力的价格和就业情况。
第九章:资本市场本章介绍了资本市场的特点和运行机制。
资本市场是指资本供给和需求的市场,资本市场的运行对企业投资和融资活动起到重要作用。
曼昆《经济学原理(微观经济学分册)》(第7版)课后习题详解第1章经济学十大原理一、概念题1.稀缺性(scarcity)答:经济学研究的问题和经济物品都是以稀缺性为前提的。
稀缺性指在给定的时间内,相对于人的需求而言,经济资源的供给总是不足的,也就是资源的有用性与有限性。
人类消费各种物品的欲望是无限的,满足这种欲望的物品,有的可以不付出任何代价而随意取得,称之为自由物品,如阳光和空气;但绝大多数物品是不能自由取用的,因为世界上的资源(包括物质资源和人力资源)是有限的,这种有限的、为获取它必须付出某种代价的物品,称为“经济物品”。
正因为稀缺性的客观存在,地球上就存在着资源的有限性和人类的欲望与需求的无限性之间的矛盾。
经济学的一个重要研究任务就是:“研究人们如何进行抉择,以便使用稀缺的或有限的生产性资源(土地、劳动、资本品如机器、技术知识)来生产各种商品,并把它们分配给不同的社会成员进行消费。
”也就是从经济学角度来研究使用有限的资源来生产什么、如何生产和为谁生产的问题。
2.经济学(economics)答:经济学是研究如何将稀缺的资源有效地配置给相互竞争的用途,以使人类的欲望得到最大限度满足的科学。
时下经常见诸国内报刊文献的“现代西方经济学”一词,大多也都在这个意义上使用。
自从凯恩斯的名著《就业、利息和货币通论》于1936年发表之后,西方经济学界对经济学的研究便分为两个部分:微观经济学与宏观经济学。
微观经济学是以单个经济主体(作为消费者的单个家庭或个人,作为生产者的单个厂商或企业,以及单个产品或生产要素市场)为研究对象,研究单个经济主体面对既定的资源约束时如何进行选择的科学。
宏观经济学则以整个国民经济为研究对象,主要着眼于对经济总量的研究。
3.效率(efficiency)答:效率指人们在实践活动中的产出与投入之比值,或者是效益与成本之比值,如果比值大,效率就高;反之,比值小,效率就低。
效率与产出或者收益的大小成正比,而与成本或投入成反比,也就是说,如果想提高效率,必须降低成本或投入,提高收益或产出。
第一篇导言复习题第一章宏观经济学的科学1、解释宏观经济学和微观经济学之间的差距,这两个领域如何相互关联?【答案】微观经济学研究家庭和企业如何作出决策以及这些决策在市场上的相互作用。
微观经济学的中心原理是家庭和企业的最优化——他们在目的和所面临的约束条件下可以让自己的境况更好。
而相对的,宏观经济学研究经济的整体情况,它主要关心总产出、总就业、一般物价水平和国际贸易等问题,以及这些宏观指标的波动趋势与规律。
应该看到,宏观经济学研究的这些宏观经济变量是以经济体系中千千万万个体家庭和企业之间的相互作用所构成的。
因此,微观经济决策总是构成宏观经济模型的基础,宏观经济学必然依靠微观经济基础。
2、为什么经济学家建立模型?【答案】一般来说,模型是对某些具体事物的抽象,经济模型也是如此。
经济模型可以简洁、直接地描述所要研究的经济对象的各种关系。
这样,经济学家可以依赖模型对特定的经济问题进行研究;并且,由于经济实际不可控,而模型是可控的,经济学家可以根据研究需要,合理、科学的调整模型来研究各种经济情况。
另外,经济模型一般是数学模型,而数学是全世界通用的科学语言,使用规范、标准的经济模型也有利于经济学家正确表达自己的研究意图,便于学术交流。
3、什么是市场出清模型?什么时候市场出清的假设是适用的?【答案】市场出清模型就是供给与需求可以在价格机制调整下很快达到均衡的模型。
市场出清模型的前提条件是价格是具有伸缩性的(或弹性)。
但是,我们知道价格具有伸缩性是一个很强的假设,在很多实际情况下,这个假设都是不现实的。
比如:劳动合同会使劳动力价格在一段时期内具有刚性。
因此,我们必须考虑什么情况下价格具有伸缩性是合适的。
现在一般认为,在研究长期问题时,假设价格具有伸缩性是合理的;而在研究短期问题时,最好假设价格具有刚性。
因为,从长期看,价格机制终将发挥作用,使市场供需平衡,即市场出清,而在短期,价格机制因其他因素制约,难以很快使市场出清。
经济学原理曼昆第七版
经济学原理第七版
作者:尼贝尔·尼尔·曼昆
第一章经济学:研究如何做出决策
第二章限制、选择与经济学方法
第三章供求与市场机制
第四章市场调节与市场失灵
第五章良好的市场模型
第六章量度经济中的成本
第八章市场结构与垄断力量
第九章公共物品与公共选择
第十章国际贸易与全球化
第十一章失业与通胀
第十二章总供给与总需求
附录A 经济学背后的数学
附录B 读懂并且写好图表和数据
附录C 通货膨胀的度量
附录D 生活经济学、酬代计划与法规政策附录E 设计损害酬代计划与确认损害赔偿附录F 公民的纳税与福利
参考文献
索引。
经济学原理曼昆7版
经济学原理曼昆7版是一本经济学教材,涵盖了许多重要的经济学原理和理论。
本书介绍了供求关系、市场机制、成本与效益分析、市场失灵等经济学基本概念和理论。
以下是本书中一些重要的内容概述。
第一章介绍了经济学的基本原理和方法。
经济学是研究人类行为与稀缺资源分配的科学。
第二章探讨了机会成本和边际分析的概念。
机会成本是指为了获得某种东西而放弃的其他机会的成本。
第三章讲解了供求关系和市场机制。
供给曲线和需求曲线的相互作用决定了市场价格和数量的均衡。
第四章研究了消费者行为和边际效用。
消费者追求效用最大化,通过边际效用来决策。
第五章介绍了生产成本和供应决策。
生产过程中的不同要素和其边际成本对供应决策产生影响。
第六章分析了市场失灵和政府干预的问题。
市场失灵可能导致资源分配的效率低下,需要政府干预来修正。
第七章探讨了企业组织和市场结构。
不同的市场结构会影响市场表现和企业行为。
经济学原理曼昆7版通过讲解这些原理和理论,帮助读者理解经济活动和市场机制,培养经济学思维和分析问题的能力。
2 像经济学家一样思考每个研究领域都有自己的语言和思考方式:数学家谈论公理、积分和向量空间;心理学家谈论自我、本我和认知的不一致性;律师谈论案发现场、侵权行为和约定的禁止翻供。
经济学家也没有什么不同。
供给、需求、弹性、比较优势、消费者剩余和无谓损失等此类术语都是经济学家语言的一部分。
在以后各章节中,你将遇到许多新术语,还会碰上经济家以特定方式使用的一些熟悉的词汇。
乍一年,这种新语言似乎有一种不必要的神秘。
但是,正如你将了解到的,它的价值在于能够为你提供一种关于你所生活的世界的新的、有用的思维方式。
本书惟一一个最重要的目的就是帮助你学会经济学家的思维方式。
当然,正如你不可能在一夜之间成为一个数学家、心理学家或律师一样,学会像经济学家一样思考也需要一些时间。
但本书通过把理论、案例研究和新闻中的经济学事例结合起来,将给你提供充分发展和实践这种技能的机会。
在深入了解经济学的本质和细节之前,综述一下经济学家如何研究这个世界是有帮助的。
因此,本章将讨论这个领域的方法论。
经济学家处理所遇到的问题有何独特之处?像经济学家一样思考是什么意思?2.1作为科学家的经济学家经济学家努力以科学的客观性来探讨他们的主题。
他们研究经济的方法与物理学家研究物质和生物学家研究生命的方法一样:先提出理论、收集数据、分析数据,以努力证明或否定他们的理论。
对初学者来说,声称经济学是门科学似乎有点不可思议。
经济学家毕竟不用试管或望远镜进行研究工作。
但是,科学的本质是科学方法——冷静地建立并检验有关世界如何运行的各种理论。
这种研究方法适用于研究一国经济,就像适用于研究地心引力或生物进化一样。
正如阿尔伯特●爱因斯坦(Albert Einstein)曾经提出的:“所有科学不过是日常思考的提炼而已”。
虽然爱因斯坦的评论对诸如经济学的社会科学和诸如物理学的自然科学同样适用,但许多人并不习惯用科学家的眼光去观察社会。
接下来我们将讨论经济学家运用科学的逻辑来考察经济如何运行的一些方法。
E conomics Principles ofN. Gregory MankiwThinking Likean EconomistSeventh EditionCHAPTER 2 W o j c i e c h (G e r s o n ((183111901)(W o j c i e c h (G e r s o n ((183111901)(In this chapter,look for the answers to these questions • What are economists’ two roles? How do they differ? • What are models? How do economists use them? • What are the elements of the Circular-Flow Diagram? What concepts does the diagram illustrate?• How is the Production Possibilities Frontier relatedto opportunity cost? What other concepts does it illustrate?• What is the difference between microeconomics andmacroeconomics? Between positive and normative?The Economist as Scientist! Economists play two roles:1. Scientists: try to explain the world2. Policy advisors: try to improve it! In the first, economists employ thescientific method,the dispassionate development and testing of theories about how the world works.3Assumptions & Models! Assumptions simplify the complex world,make it easier to understand.! Example: To study international trade,assume two countries and two goods.Unrealistic, but simple to learn andgives useful insights about the real world.! Model: a highly simplified representation ofa more complicated reality.Economists use models to study economic issues.4Our First Model:The Circular-Flow Diagram! The Circular-Flow Diagram: a visual model of the economy, shows how dollars flow through markets among households and firms! Two types of “actors”:! households! firms! Two markets:! the market for goods and services! the market for “factors of production”9Factors of Production! Factors of production: the resources the economy uses to produce goods & services, including! labor! land! capital (buildings and machines used inproduction)10Households:! Own the factors of production,sell/rent them to firms for income! Buy and consume goods & services FirmsHouseholds Firms:! Buy/hire factors of production,use them to produce goodsand services! Sell goods & services11Markets for Factors of Production HouseholdsFirms Markets for Goods & ServicesOur Second Model:The Production Possibilities Frontier ! The Production Possibilities Frontier (PPF): a graph that shows the combinations oftwo goods the economy can possibly produce given the available resources and the available technology! Example:! Two goods: computers and wheat! One resource: labor (measured in hours)! Economy has 50,000 labor hours per monthavailable for production.13A C T I V E L E A R N I N G1Points off the PPFA.On the graph, find the point that represents(100 computers, 3000 tons of wheat), label it F.Would it be possible for the economy to produce this combination of the two goods?Why or why not?B.Next, find the point that represents(300 computers, 3500 tons of wheat), label it G.Would it be possible for the economy to producethis combination of the two goods?The PPF: What We Know So Far Points on the PPF (like A – E)! possible! efficient: all resources are fully utilizedPoints under the PPF (like F)! possible! not efficient: some resources underutilized(e.g., workers unemployed, factories idle) Points above the PPF (like G)! not possible19The PPF and Opportunity Cost! Recall: The opportunity cost of an itemis what must be given up to obtain that item.! Moving along a PPF involves shifting resources (e.g., labor) from the production of one good to the other.! Society faces a tradeoff: Getting more of one good requires sacrificing some of the other.! The slope of the PPF tells you the opportunity cost of one good in terms of the other.20Economic growth shifts the PPF outward.The Shape of the PPF! The PPF could be a straight line or bow-shaped. ! Depends on what happens to opportunity costas economy shifts resources from one industryto the other.! If opp. cost remains constant,PPF is a straight line.(In the previous example, opp. cost of acomputer was always 10 tons of wheat.)! If opp. cost of a good rises as more of the goodis produced, PPF is bow-shaped….25At A, opp. cost of mtn bikes is low.B At B , opp. cost of mtn bikes is high.Why the PPF Might Be Bow-Shaped! So, PPF is bow-shaped when different workers have different skills, different opportunity costs of producing one good in terms of the other.! The PPF would also be bow-shaped when there is some other resource, or mix of resources with varying opportunity costs(E.g., different types of land suited fordifferent uses).29The PPF: A Summary! The PPF shows all combinations of two goods that an economy can possibly produce,given its resources and technology.! The PPF illustrates the concepts oftradeoff and opportunity cost,efficiency and inefficiency,unemployment, and economic growth.! A bow-shaped PPF illustrates the concept of increasing opportunity cost.31Microeconomics and Macroeconomics! Microeconomics is the study of how households and firms make decisions and how they interact in markets.! Macroeconomics is the study of economy-wide phenomena, including inflation, unemployment, and economic growth.! These two branches of economics are closely intertwined, yet distinct—they address different questions.32Summary• As scientists, economists try to explain the world using models with appropriate assumptions. • Two simple models are the Circular-Flow Diagram and the Production Possibilities Frontier.• Microeconomics studies the behavior of consumers and firms, and their interactions in markets. Macroeconomics studies the economy as a whole.• As policy advisers, economists offer advice onhow to improve the world.Graphing: a brief review! Graphs purposes:! Visually express ideas that might be less clear ifdescribed with equations or words! Powerful way of finding and interpreting patterns ! Graphs of a single variable! Pie chart! Bar graph! Time-series graph42Types of Graphs (a)Figure A-1The pie chart in panel (a) shows how the U.S. national income in 2011 was derivedfrom various sources.Figure A-1 Types of Graphs (b)The bar graph in panel (b) compares the 2011 average income in four countries.Types of Graphs (c)Figure A-1The time-series graph in panel (c) shows the productivity of labor in U.S.businesses from 1950 to 2010.Graphing: a brief review! Graphs of two variables: the coordinate system ! Display two variables on a single graph! Scatterplot! Ordered pairs of points! x-coordinate– Horizontal location! y-coordinate– Vertical location46Using the Coordinate SystemGrade point average is measured on the vertical axis and study time on thehorizontal axis. Albert E., Alfred E., and their classmates are represented by variouspoints. We can see from the graph that students who study more tend to get higher grades.Graphing: a brief review! Curves in the coordinate system! Data! Number of novels purchased! Price of novels! Income! Demand curve! Effect of a good s price! On the quantity of the good consumers want tobuy! For a given income48Table A-1Novels Purchased by EmmaThis table shows the number of novels Emma buys at various incomes and prices. For any given level of income, the data on price and quantity demanded can be graphed to produce Emmas demand curve for novels, as shown in Figures A-3 and A-4.Graphing: a brief review! Negatively related variables! The two variables move in opposite direction! Downward sloping curve! Positively related variables! The two variables move in the same direction! Upward sloping curve! Movement along a curve! Shifts in a curve50! Slope! Fairly flat upward-sloping line! Slope is a small positive number! Steep upward-sloping line! Slope is a large positive number! Downward sloping line! Slope is a negative number! Horizontal line! Slope is zero! Vertical line: infinite slope54。