瞬时弹性成像技术诊断肝纤维化课件
- 格式:ppt
- 大小:9.03 MB
- 文档页数:36

瞬时弹性成像对病毒性肝炎肝纤维化的诊断价值浅析宋洋【期刊名称】《中国实验诊断学》【年(卷),期】2014(000)009【总页数】2页(P1520-1521)【作者】宋洋【作者单位】吉林省肝胆病医院,吉林长春 130062【正文语种】中文目前,慢性肝炎肝纤维化诊断的金标准仍然是经皮肝穿刺病理组织学检查,但因为病理穿刺本身作为有创性检查存在一定并发症及相关风险,很难多次进行。
肝纤维化程度作为一项对慢性肝病防治及预后评价具有重要意义的指标,理应尽可能及时和准确的评估[1]。
肝脏瞬时弹性成像(Fibroscan,FS)是一种新型的建立在超声诊断基础上的快速、便捷、非创伤性肝纤维化检测方法,其主要原理是应用一维脉冲超声切割波在肝组织内运行的速度换算成弹力数值,数值越大,反映弹性波的传播越快。
FS主要检测肝组织的硬度值(liver stiffness measurement,LSM)作为反映肝纤维化程度的重要指标,因此,本研究对我院临床诊断的慢性乙型肝炎患者分别行FS检测的同时,进行肝穿刺病理组织学检查,将LSM与病理结果进行对比分析,评价其对慢性乙型肝炎肝纤维化的诊断价值,现报道如下。
1 资料与方法1.1 临床资料随机选取我院2009年1月-2013年8月慢性乙型肝炎患者89例,其中男性58例,女性31例,年龄在22-56岁之间,平均30.32±11.45岁。
并排除患有其他腹腔器官相关并发症,或曾经进行过腹部手术的患者。
1.2 方法1.2.1 肝脏硬度检测采用法国Echosens公司生产的测定肝组织弹性的专用仪器,嘱咐患者平卧位,双手置于头部,向左侧倾斜使肋间隙增宽,检测点选择在右侧腋前线至腋中线第7、8、9肋间间隙,探头与肝右叶表面垂直按动按钮,通过使用50Hz的低频脉冲振动波,连续有效的检测10次,取中位数为最终测定结果,并且以弹性值(KPa)来表示,最后检测要求成功率要大于60%,偏差要小于中位数据1/3。
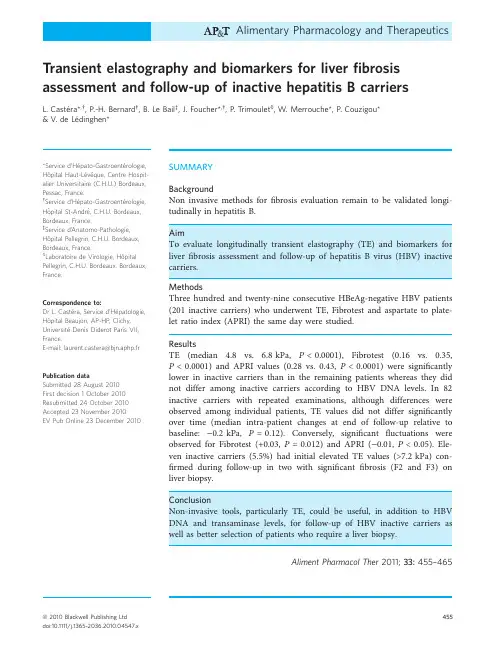
Transient elastography and biomarkers for liverfibrosis assessment and follow-up of inactive hepatitis B carriers L.Caste´ra*, ,P.-H.Bernard ,B.Le Bailà,J.Foucher*, ,P.Trimoulet§,W.Merrouche*,P.Couzigou*&V.de Le´dinghen**Service d’He´pato-Gastroente´rologie, Hoˆpital Haut-Le´veˆque,Centre Hospit-alier Universitaire(C.H.U.)Bordeaux, Pessac,France.Service d’He´pato-Gastroente´rologie, Hoˆpital St-Andre´,C.H.U.Bordeaux, Bordeaux,France.àService d’A natomo-Pathologie,Hoˆpital Pellegrin,C.H.U.Bordeaux, Bordeaux,France.§Laboratoire de Virologie,Hoˆpital Pellegrin,C.H.U.Bordeaux,Bordeaux, France.Correspondence to:Dr L.Caste´ra,Service d’He´patologie, Hoˆpital Beaujon,AP-HP,Clichy, Universite´Denis Diderot Paris VII, France.E-mail:laurent.castera@bjn.aphp.frPublication dataSubmitted28August2010First decision1October2010 Resubmitted24October2010 Accepted23November2010EV Pub Online23December2010SUMMARYBackgroundNon invasive methods forfibrosis evaluation remain to be validated longi-tudinally in hepatitis B.AimTo evaluate longitudinally transient elastography(TE)and biomarkers for liverfibrosis assessment and follow-up of hepatitis B virus(HBV)inactive carriers.MethodsThree hundred and twenty-nine consecutive HBeAg-negative HBV patients (201inactive carriers)who underwent TE,Fibrotest and aspartate to plate-let ratio index(APRI)the same day were studied.ResultsTE(median 4.8vs. 6.8kPa,P<0.0001),Fibrotest(0.16vs.0.35, P<0.0001)and APRI values(0.28vs.0.43,P<0.0001)were significantly lower in inactive carriers than in the remaining patients whereas they did not differ among inactive carriers according to HBV DNA levels.In82 inactive carriers with repeated examinations,although differences were observed among individual patients,TE values did not differ significantly over time(median intra-patient changes at end of follow-up relative to baseline:)0.2kPa,P=0.12).Conversely,significantfluctuations were observed for Fibrotest(+0.03,P=0.012)and APRI()0.01,P<0.05).Ele-ven inactive carriers(5.5%)had initial elevated TE values(>7.2kPa)con-firmed during follow-up in two with significantfibrosis(F2and F3)on liver biopsy.ConclusionNon-invasive tools,particularly TE,could be useful,in addition to HBV DNA and transaminase levels,for follow-up of HBV inactive carriers as well as better selection of patients who require a liver biopsy.Aliment Pharmacol Ther2011;33:455–465ª2010Blackwell Publishing Ltd455 doi:10.1111/j.1365-2036.2010.04547.xAlimentary Pharmacology and TherapeuticsINTRODUCTIONChronic hepatitis B virus(HBV)infection with negative Hepatitis B e antigen(HBeAg)is becoming the predomi-nant type of chronic HBV infection worldwide,1as well as in France.2The clinical spectrum of HBeAg-negative chronic HBV infection may range from the inactive chronic HBsAg carrier state,characterised by persistently normal alanine aminotransferase(ALT)values,low or undetectable viremia and no liver injury to active chronic hepatitis B(CHB)with elevated ALT activity,high HBV DNA levels and active liver histological lesions.It is important and sometimes difficult to distinguish true inactive carriers(IC)from patients with active HBeAg-negative CHB in whom phases of spontaneous remission may occur.3IC have a good prognosis with a very low risk of complications and need just to be followed up regularly.1Differential diagnosis with CHB is based lar-gely on careful monitoring of ALT activity,serum HBV DNA levels and liver histology.Although liver biopsy remains the reference method for assessment of liver dis-ease severity in chronic HBV infection,it is currently not recommended in IC.4,5In addition,liver biopsy is a painful and an invasive procedure6,7with rare but potentially life-threatening complications8,9and prone to sampling errors.10,11These limitations have stimu-lated the search for new non-invasive approaches.12–14A variety of methods including the measurement of liver stiffness,using transient elastography(TE)and biomar-kers,ranging from routinely available nonpatented scores such as APRI to more complex patented algorithms such as the Fibrotest(FT),have been proposed for the non-invasive assessment of hepaticfibrosis,mainly in chronic hepatitis C.15–20Validation of these methods in hepatitis B is ongoing21–24but longitudinal data are still pending. The aim of this longitudinal study was to evaluate the value of TE and biomarkers(FT and APRI)for liver fibrosis assessment and follow-up of HBV IC. PATIENTS AND METHODSPatientsBetween June2003and June2009,412patients were referred to our centre for HBeAg-negative HBV infec-tion.The diagnosis of chronic HBV infection was based on the presence in serum of HBsAg and anti-HBe anti-bodies for more than6months.Patients with other viral infection[HIV(n=11),HCV(n=7),HDV(n=5)], other causes of liver disease(n=17)and unsuccessful liver stiffness measurements(n=43)were excluded from the study.Finally,329patients were analysed.Two hundred and one patients were considered as IC on the basis of persistently normal ALT and AST and HBV DNA <105copies⁄mL(<20000IU⁄mL)on at least two deter-minations during the past6months which corresponded to the IC definition when the study was initiated.25The remaining patients(n=128)were considered as HBeAg-negative chronic hepatitis(CHB).IC patients were also analysed according to the new HBV DNA threshold of 2000IU⁄mL proposed by EASL guidelines in2009.4All patients were enrolled after giving their written informed consent to the study which was approved by the Local Ethics Committee.Liver histology and staging of liverfibrosisLiver biopsy was performed according to clinical needs by senior operators using the Menghini technique with a 1.6-mm-diameter needle(Hepafix;Braun,Melsungen, Germany).Biopsy specimens werefixed in formalin and embedded in paraffin.All biopsy specimens were analy-sed by the same trained pathologist blinded to the results of non-invasive tests.Liverfibrosis and necroinflammatory activity were evaluated semi-quantitatively according to the METAVIR scoring system.26,27Fibrosis was staged on a0–4scale, as follows:F0,nofibrosis;F1,portalfibrosis without septa;F2,portalfibrosis and few septa;F3,numerous septa without cirrhosis;F4,cirrhosis.Activity was graded as follows:A0,none;A1,mild;A2,moderate;A3,severe.Two clinically relevant end points were chosen:signif-icantfibrosis(F‡2)and cirrhosis(F4).The presence of significantfibrosis in HBV patients is considered a hall-mark of a progressive liver disease and an indication for antiviral treatment and the presence of cirrhosis triggers screening for complications such as oesophageal varices and hepatocellular carcinoma.4Liver stiffness measurementLiver stiffness measurements were performed using TE (FibroScan;Echosens,Paris,France).Details of the tech-nical background and examination procedure have been previously described.28Ten successful measurements were performed on each patient.The success rate was calculated as the number of validated measurements divided by the total number of measurements.The results were expressed in kilopascals(kPa).The median value of successful measurements was considered representative of the liver stiffness in a given patient, according to the manufacturer’s recommendations[inter-quartile range(IQR)<30%of the median value and suc-cess rate>60%].Unsuccessful results were defined asL.C a s t e´r a e t a l.456Aliment Pharmacol Ther2011;33:455–465ª2010Blackwell Publishing Ltdeither failure(no valid measurement)or unreliable results(valid measurements<10or success rate<60%or IQR>30%of median value).29The cut-offs used for diagnosing significantfibrosis and cirrhosis were those proposed by Marcellin et al.21in French patients(7.2 and11.0kPa respectively).Liver stiffness measurements were repeated over time(every6–12months)since2005in IC patients, particularly in those with initial elevated liver stiffness values(>7.2kPa).In case of elevated liver stiffness values on at least two examinations,a liver biopsy was proposed.Serum biomarkersThe parameters allowing the calculation of FT and APRI were determined in the same laboratory on blood sam-pled at the time of TE.The FT score was purchased from Biopredictive website(http://www.biopredictive. com).The APRI was calculated according to the original formula as follows:AST levels divided by its upper nor-mal limit⁄platelet count(109⁄L)·100.18The cut-offs used for diagnosing significantfibrosis and cirrhosis were those from original publications:FT values>0.48and >0.74respectively;19APRI values<0.5or‡1.5and<1or ‡2respectively.18Statistical analysisPatient characteristics are given as meanÆs.d.or as median and range as parisons between groups were performed using nonparametric tests, including the Mann–Whitney test(two groups)or the Kruskal–Wallis test(three groups).Comparisons between groups for qualitative data were performed using Chi-squared test or Fisher’s exact test when necessary.Table1|Characteristics of the 329HBeAg-negative patients at the time offibrosis evalua-tion according to their status: inactive carriers and chronic active hepatitis(CHB)patientsHBeAg-negativeT otal(n=329)Inactivecarriers(n=201)HBeAg-negativeCHB patients(n=128)P Gender(male)62%54%76%<0.0001 Age(years)39Æ1436Æ1244Æ16<0.0001 BMI(kg⁄m2)24.0Æ3.923.7Æ3.824.4Æ4.1N.S. ALT(IU⁄L)(n<50)46Æ7027Æ1175Æ106<0.0001 AST(IU⁄L)(n<50)37Æ4127Æ855Æ61<0.0001 Platelets(109⁄L)227Æ72237Æ67213Æ790.004 HBV DNA(IU⁄mL) 2.7Æ17.1·106 1.5Æ2.7·1037.4Æ27.9·1060.0002 BMI,body mass index;ALT,alanine aminotransferase;AST,aspartate aminotransferase; HBV,hepatitis B virus.Table2|Diagnostic performances of transient elastography(TE),Fibrotest(FT)and APRI in the60patients with a liver biopsyMethod AUROC(95%CI)Endpoint Cut-offsSe(%)Sp(%)PPV(%)NPV(%)+LR)LRCorrectlyclassified(%)TE0.76(0.63–0.90)F‡2>7.1kPa*68638342 1.840.5167FT0.71(0.58–0.85)>0.4861819043 3.210.4867APRI0.66(0.50–0.82)<0.562643864 1.720.59‡1.51410010030Infinite0.8627TE0.89**(0.80–0.98)F4>9.6kPa*87805995 4.350.1682>11.0kPa73876591 5.310.3183FT0.74(0.58–0.90)>0.7447916784 5.200.5880APRI0.79(0.67–0.91)<1.047804482 2.350.66‡2.013965076 3.250.9063*Optimised cut-offs in our population.**P<0.03vs.FT.N o n-i n v a s i v efib r o s i s m a r k e r s i n H B V i n a c t i v e c a r r i e r sAliment Pharmacol Ther2011;33:455–465457ª2010Blackwell Publishing LtdIntra-group comparisons were made using Wilcoxon’s test for paired data.Tests were two-tailed and P-values <0.05were considered significant.Receiver operating characteristics(ROC)curves were constructed.Sensitivity(Se),specificity(Sp),positive and negative predictive values(PPV and NPV),positive like-lihood ratio(+LR)and negative likelihood ratio()LR) were calculated using cut-offs previously described for significantfibrosis and cirrhosis for TE,FT and APRI. Also for TE,cut-offs were established in our population according to ROC curve in order to maximise Se and Sp. Areas under ROC curve(AUROC)were calculated using the trapezoidal parisons of AUROCs were done using the method described by Hanley and McNeil for correlated data.30Initially,we compared all AUROCs, and in case of rejection of the null hypothesis(all AUROCs are equal),differences were searched for by two-by-two comparisons,using Bonferroni adjustment for multiple pairwise comparisons.Analyses were per-formed using SPSS software(Statistical Systems,Kayville, UT,USA)and STATA V8.0(Stata Statistical Software, release8.0;StataCorp,College Station,TX,USA). RESULTSPatientsThe baseline characteristics of the329patients are shown in Table1.There were205men(62%),and their mean age was39Æ14years.Among these patients,60under-went a liver biopsy.The mean liver biopsy length was 22.6Æ8.0mm.As expected,IC were significantly youn-ger(36Æ12vs.44Æ16years respectively,P<0.0001), were less often men(54%vs.76%respectively, P<0.0001)and had lower HBV DNA(1.5Æ2.7·103 vs.7.4Æ27.9·106IU⁄mL respectively,P=0.0002) than CHB patients.Cross-sectional studyComparative diagnostic performance of TE and biomar-kers forfibrosis staging.In the60patients who under-went a liver biopsy,activity grade andfibrosis score were as follows:A0–A1(n=25);A2(n=22);A3(n=13) and F0–F1(n=16);F2(n=16);F3(n=13);F4 (n=15).Diagnostic performances of TE and biomarkers are shown in Table2.TE,FT and APRI had similar performance for F‡2 [AUROC(95%CI):0.76(0.63–0.90),0.71(0.58–0.85) and0.66(0.50–0.82)respectively,P=N.S.].Conversely, for F4TE had better performance than FT[0.89(0.80–0.98)vs.0.74(0.58–0.90)respectively,P=0.03]but not different from APRI[0.89(0.80–0.98)vs.0.79(0.67–0.91)respectively,P=N.S.].The TE cut-offs optimised in our population were:7.1kPa for significantfibrosis (F‡2)and9.6kPa for cirrhosis(F4)respectively. Comparison of TE and biomarkers between IC and HBeAg-negative disease.IC had significantly lower liver stiffness values[median:4.8(4.1–5.8)vs.6.8(4.9–9.5)108121416(a)(b)(c)P < 0.0001P < 0.0001P < 0.0001Liverstiffnessvalues(kPa)246Inactive carriers(n = 201)CHB patients(n = 128)Inactive carriers(n = 201)CHB patients(n = 128)Inactive carriers(n = 201)CHB patients(n = 128)0.80.70.6Fibrotestvalues0.20.10.30.40.51.40.60.40.811.20.2APRIvaluesFigure1|Box plots of liver stiffness(a),Fibrotest(b), and APRI(c)values in the201IC patients and the128 CHB patients.The top and bottom of the boxes are the first and third quartiles respectively.The length of the box thus represents the IQR within which50%of the values were located.The line through the middle ofeach box represents the median.The error bars showthe minimum and maximum values(range).L.C a s t e´r a e t a l.458Aliment Pharmacol Ther2011;33:455–465ª2010Blackwell Publishing Ltd1M ⁄2521.63375367.40.120.244607.36.57.80.090.160.200.170.230.23357325F 22F ⁄2519.724<127.80.170.131824.15.8–0.220.14–0.190.17–32<12N o3M ⁄4927.135<127.80.200.241796.8––0.18––0.26––35<12N o4M ⁄3120.5183157.90.130.252535.9––0.22––0.32––23<12N o5M ⁄5223.44716008.00.430.082365.44.8–0.330.28–0.100.09–34973N o6M ⁄1821.8246628.20.110.413959.89.512.70.120.080.060.280.350.3621372F 37M ⁄5924.929<128.60.340.602476.3––0.30––0.51––20<12N o8M ⁄2224.62517828.80.160.541005.9––0.15––0.54––291239N o9M ⁄4523.4387749.40.140.311866.16.76.60.100.270.200.350.440.3838118N o10M ⁄2319.62193809.50.060.214166.96.8–0.130.12–0.170.20–99216N o11M ⁄2626.44056611.60.410.363295.85.34.90.300.420.580.430.350.4642715N oN o n -i n v a s i v e fib r o s i s m a r k e r s i n H B V i n a c t i v e c a r r i e r sAliment Pharmacol Ther 2011;33:455–465459ª2010Blackwell Publishing LtdkPa respectively;P<0.0001],FT values[median:0.16 (0.10–0.25)vs.0.35(0.19–0.60)respectively;P<0.0001] and APRI values[median:0.28(0.22–0.35)vs.0.43 (0.29–0.72)respectively;P<0.0001]than CHB patients (Figure1).Interestingly,11IC(5.5%)had elevated liver stiffness values(‡7.2kPa)suggestive of significantfibrosis (Table3).All were offered follow-up and their charac-teristics are detailed below in the longitudinal study chapter.Comparison of TE and biomarkers according to HBV DNA levels in IC.The distribution of serum HBV DNA levels among IC was as follows:undetectable(<12IU⁄mL),33 (16%);>12IU/mL and<2000IU⁄mL,139(65%)and >2000IU/mL and<20000IU⁄mL,39(19%).Patients with HBV DNA levels<2000IU⁄mL(81%)correspond to the recently proposed EASL definition for IC4whereas patients with HBV DNA levels<20000IU⁄mL corre-spond to the classical definition.25IC did not differ according to serum HBV DNA levels for baseline charac-teristics(age,gender,BMI,ALT and AST)as well as for liver stiffness values,FT and APRI values(Figure2). Longitudinal studyAmong the201IC,82underwent repeated TE and bio-markers determinations:two determinations(n=82, median interval of11.5months;range:3.3–26.8);three determinations(n=48,median23.1months;range: 10.1–34.7)and four determinations(n=27,median 34.4months;range:21.6–49.1).When pooling the differ-ent time points for the82patients,taking into account the last available time point(end of follow-up),the med-ian interval was:21.7months(range:3.3–49.1).These82 patients did not differ from the other IC for baseline characteristics(age,gender,BMI,ALT,AST,platelet count),FT and APRI except for liver stiffness values (median5.0vs.4.6kPa respectively,P=0.005).Indeed, as mentioned before,eleven of these patients had liver stiffness values>7.2kPa atfirst examination,suggestive of the presence of significantfibrosis.Their characteris-tics are detailed in Table3.These patients did not differ from the other190IC for most baseline characteristics(age,gender,BMI,ALT,AST and platelet count),FT and APRI,and TE success rate,except for the IQR⁄me-dian value ratio(mean0.21Æ0.08vs.0.16Æ0.07 respectively,P<0.03).During follow-up,liver stiffness values returned to values below7.2kPa in all patients except two.These two patients(number1and6)under-went liver biopsy.Patient number1had moderatefibro-sis(F2)whereas patient number6had severefibrosis (F3).Both were offered antiviral treatment.Table4shows the median intra-patient changes in liver stiffness,FT,APRI,AST,ALT and HBV DNA val-ues at different time points relative to baseline in the82 IC patients who underwent at least two determinations of non-invasive methods over time.Globally,the liver 43567HBV DNA<12 IU/mL(n = 33)HBV DNA12 < <2000 IU/mL(n = 129)HBV DNA2000 < <20 000 IU/mL(n = 39)HBV DNA<12 IU/mL(n = 33)HBV DNA12 < <2000 IU/mL(n = 129)HBV DNA2000 < <20 000 IU/mL(n = 39)HBV DNA<12 IU/mL(n = 33)HBV DNA12 < <2000 IU/mL(n = 129)HBV DNA2000 < <20 000 IU/mL(n = 39) Liverstiffnessvalues(kPa)120.40.5P = NSP = NSP = NSFibrotestvalues0.10.20.3APRIvalues0.20.30.40.50.1(a)(b)(c)Figure2|Box plots of liver stiffness(a),Fibrotest(b), and APRI(c)values in the201IC patients according to HBV DNA levels.The top and bottom of the boxes are thefirst and third quartiles respectively.The length of the box thus represents the IQR within which50%ofthe values were located.The line through the middle of each box represents the median.The error bars showthe minimum and maximum values(range).L.C a s t e´r a e t a l.460Aliment Pharmacol Ther2011;33:455–465ª2010Blackwell Publishing Ltdstiffness changes observed in82patients at the end of follow-up(last determination available)relative to base-line were not significant,although there was a trend towards a decrease in liver stiffness over time(median intra-patient changes at end of follow-up:)0.2()1.2to +0.7)kPa,P=0.12).As shown in Figure3a,there were differences among individual patients,however,the med-ian intra-patient liver stiffness changes relative to base-line were not significant:+0.1()0.9to+0.5)kPa (P=0.41)at second determination and)0.1()0.9to +0.5)kPa(P=0.33)at third determination(Table4). Similarly,no significant change was observed for AST, ALT and HBV DNA levels at the end of follow-up rela-tive to baseline(Table4).Conversely,a significant increase in FT values was observed over time:median of intra-patient changes in FT values at the end of follow-up relative to baseline [+0.03()0.04to+0.09),P=0.012;Table4).Patients had significantly higher values at the end of follow-up than at baseline[median0.19(0.12–0.32)vs.(0.16(0.10–0.24), P=0.012].Five patients(6%)had at baseline FT values suggestive of significantfibrosis(>0.48)but none of cir-rhosis(>0.74).During follow-up,FT values remained comprised between0.48and0.74in thesefive patients. As shown in Figure3b,there were important differences among individual patients and FT valuesfluctuated over time:as a result,median intra-patient FT changes relative to baseline were significant:+0.03()0.03to+0.07) (P=0.03)at second determination and+0.05()0.03to +0.11)(P=0.001)at third determination(Table4).As for APRI,there were also differences among indi-vidual patients and APRI valuesfluctuated over time (Figure3c).A significant decrease was observed over time:median of intra-patient changes at the end of fol-low-up relative to baseline[)0.01()0.07–+0.03), P<0.05;Table4].N o n-i n v a s i v efib r o s i s m a r k e r s i n H B V i n a c t i v e c a r r i e r sAliment Pharmacol Ther2011;33:455–465461ª2010Blackwell Publishing LtdDISCUSSIONThe results of the present study,based on a large series of consecutive HBeAg-negative HBV patients,suggest that non-invasive tools for liver fibrosis assessment,par-ticularly TE,may be useful for liver fibrosis assessment and follow-up of IC.Among the different available non-invasive methods,we chose to evaluate two different and complementary approaches:(i)a physical approach based on the mea-surement of liver stiffness using TE;(ii)a biological approach based on serum biomarkers including a pat-ented algorithm (FT)and a free nonpatented index (APRI).31These three non-invasive methods are by far the most widely used and validated.32–34In the cross-sectional part of the study,we first vali-dated the performances of TE,FT and APRI against liver biopsy for diagnosing significant fibrosis and cirrhosis in our population.TE had better diagnostic accuracy for cirrhosis (AUROC:0.89)than for significant fibrosis (0.76),as previously reported in hepatitis C 32and hepati-tis B.21,35,36Interestingly,the TE cut-off we found for significant fibrosis (7.1kPa)is similar to the one we pro-posed initially in chronic hepatitis C 16and close to those recently proposed in CHB by Marcellin et al.(7.2kPa),21as well as other groups.35,36As for cirrhosis,our cut-off (9.6kPa)is lower than in hepatitis C (12.5kPa)16but close to those proposed in hepatitis B.21,23,35,36The higher prevalence of macronodular cirrhosis in CHB than in hepatitis C as well as differences in the preva-lence of cirrhosis in the different studied populations may account for these differences.As for FT and APRI,their performances were in keeping with those previously reported in hepatitis B.24,37–39Interestingly,although performance did not differ among the three methods for the diagnostic accuracy of significant fibrosis,TE had better diagnostic accuracy than FT for cirrhosis,a finding consistent with our experience in patients with chronic hepatitis C.40In that respect,some authors have pro-posed algorithms combining TE with serum biomarkers to increase diagnostic accuracy for advanced fibrosis in patients with CHB.41Although liver biopsy remains important for deter-mining active disease,42it is not feasible or necessary to biopsy all HBeAg-negative patients with near normal ALT and relatively low HBV DNA levels.43Non-invasive tests could provide an additional adjunct for separating patients with inactive and minimal fibrosis from those for whom a liver biopsy could be mandated.Liver stiff-ness values in our series of 201IC were low and similar to those reported in two recent series of healthyindivid-2t i m e p o i n t s (n =82)E OF )0.2()1.2t o +0.7)0.12+0.03()0.04t o +0.09)0.012)0.01()0.07t o +0.03)<0.050.0()4.0t o +4.0)0.990.0()6.0t o +5.0)0.640.0()461t o +290)0.983t i m e p o i n t s (n =48)S e c o n d +0.1()0.9t o +0.5)0.41+0.03()0.03t o +0.07)0.03)0.02()0.06t o +0.02)0.020.0()5.5t o +3.0)0.28)2.0()9.0t o +2.0)0.10117.0()509t o +3230)0.14T h i r d)0.1()0.9t o +0.5)0.33+0.05()0.03t o +0.11)0.001)0.01()0.08t o +0.04)0.410.5()3.8t o +5.0)0.990.0()5.0t o +4.0)0.800.0()770t o +848)0.824t i m e p o i n t s (n =27)S e c o n d +0.2()0.8t o +0.9)0.980.00()0.04t o +0.06)0.550.00()0.06t o +0.04)0.452.0()4.0t o +4.0)0.600.0()3.0t o +7.0)0.90117.0()422t o +4076)0.18T h i r d)0.1()1.0t o +0.5)0.50+0.07(0.00t o +0.13)0.002+0.02()0.06t o +0.06)0.712.0()2.0t o +6.0)0.222.0()3.0t o +7.0)0.09)70.0()1786t o +91)0.21E OF ,e n d o f f o l l o w -u p ;P -v a l u e s a r e f o r i n t r a -p a t i e n t s c h a n g e s r e l a t i v e t o b a s e l i n e .L .C a s t e´r a e t a l .462Aliment Pharmacol Ther 2011;33:455–465ª2010Blackwell Publishing Ltduals with44and without45liver biopsy as well as in patients with chronic hepatitis C and persistently normal ALT.46In addition,liver stiffness values were signifi-cantly lower than in CHB patients and consistent with those previously reported in IC.36,47However,no serum fibrosis biomarker was evaluated in these two stud-ies.36,47Interestingly,both APRI and FT values were low in our IC as previously reported38and significantly lower than in CHB patients.As a new definition of IC has been recently proposed,4 we also examined the results of non-invasive tests according to HBV DNA levels.Approximately80%of our IC patients had HBV DNA levels<2000IU⁄mL,cor-responding to this new definition,afinding in keeping with those of a recent series of85IC where23%of patients had HBV DNA<2000IU⁄mL.48Interestingly, TE,FT and APRI values did not differ according to HBV DNA levels in IC whereas they were significantly higher in patients with HBV DNA>20000IU⁄mL.Such findings are consistent with those of Papatheodoridis et al.43showing that in patients with persistently normal ALT and HBV DNA<20000IU⁄L,the2000IU⁄L cut-off does not allow discriminating between patients with and without significantfibrosis on liver biopsy.In the second longitudinal part of the study,we thor-oughly evaluated the evolution of TE,FT and APRI over time by measuring median intra-patients changes at dif-ferent time points relative to baseline in82IC with repeated examinations(two to four examinations).Inter-estingly,although some differences were observed among individual patients(Figure3),liver stiffness values were stable over time,as were AST,ALT and HBV DNA lev-els.Conversely,significantfluctuations were observed with FT and APRI.We have no clear explanation for this latterfinding. In the only study were FT was assessed longitudinally in 160IC,38reproducibility was deemed excellent but no data were provided regarding the median or mean FT values over time.It is possible that some components of FT such as bilirubin levels or alpha-2-macroglobulin may fluctuate over time.49Similarly with APRI,AST and platelet mayfluctuate over time.Concerning TE,it has been shown to be highly reproducible50andfluctuations of liver stiffness over time are mainly related to acute inflammation or ALTflares,22,36,51which are usually not observed in IC.Interestingly,eleven out of201IC(5.5%)had baseline elevated liver stiffness values(>7.2kPa),suggestive of the presence of significantfibrosis.During follow-up,liver stiffness values returned to values below7.2kPa in all patients but two.It should be noted that when compared to the other IC,these11patients had significantly higher TE IQR⁄median value ratio.The importance of this ratio for accuracy of TE results has been recently emphas-ised.52Thisfinding suggests that when liver stiffness val-ues are elevated(>7.2kPa)in patients with a profile of IC,TE should be repeated before taking a liver biopsy, to make sure that IQR⁄median value ratio is satisfactory. Indeed,in the two patients with baseline elevated liver stiffness values confirmed on a second examination,liver biopsy revealed the presence of significantfibrosis in both cases(F2and F3),suggesting that TE in this con-text is a sensitive tool for detection of significantfibrosis. In conclusion,our results suggest that non-invasive tools for liverfibrosis assessment,particularly TE,could be useful,in addition to HBV DNA and transaminase levels,for follow-up of HBV IC as well as better selection of patients who require a liver biopsy. ACKNOWLEDGEMENTSDeclaration of personal interests:We are grateful to Dr Françoise Roudot-Thoraval for her helpful statistical comments on the article.Declaration of funding interests: None.REFERENCES1.Dienstag JL.Hepatitis B virus infection.N Engl J Med2008;359:1486–500. 2.Zarski JP,Marcellin P,Leroy V,et al.Characteristics of patients with chronic hepatitis B in France:predominant fre-quency of HBe antigen negative cases.J Hepatol2006;45:355–60.3.Brunetto MR,Oliveri F,Coco B,et al.Outcome of anti-HBe positive chronic hepatitis B in alpha-interferon treatedand untreated patients:a long termcohort study.J Hepatol2002;36:263–70.4.European Association for the Study ofthe Liver.EASL Clinical Practice Guide-lines:management of chronic hepatitisB.J Hepatol2009;50:227–42.5.Lok AS,McMahon BJ.Chronic hepatitisB:update2009.Hepatology2009;50:661–2.6.Castera L,Negre I,Samii K,et al.Pain experienced during percutaneousliver biopsy.Hepatology1999;30:1529–30.7.Castera L,Negre I,Samii K,et al.Patient-administered nitrous oxide⁄oxy-gen inhalation provides safe and effectiveanalgesia for percutaneous liver biopsy:arandomized placebo-controlled trial.AmJ Gastroenterol2001;96:1553–7.N o n-i n v a s i v efib r o s i s m a r k e r s i n H B V i n a c t i v e c a r r i e r sAliment Pharmacol Ther2011;33:455–465463ª2010Blackwell Publishing Ltd。
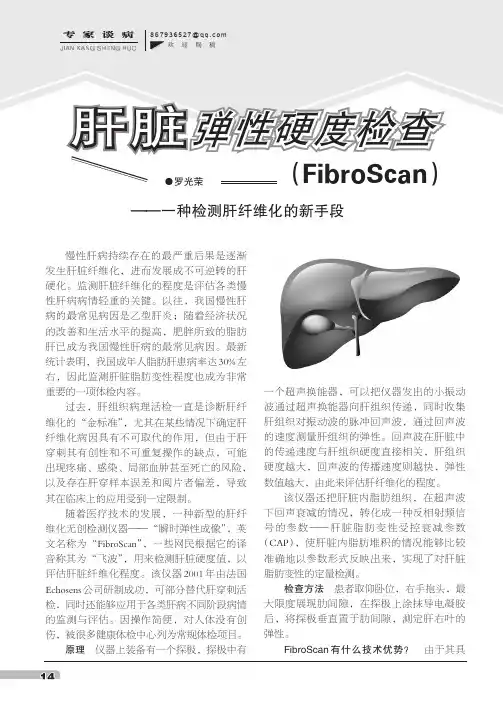
慢性肝病持续存在的最严重后果是逐渐发生肝脏纤维化,进而发展成不可逆转的肝硬化。
监测肝脏纤维化的程度是评估各类慢性肝病病情轻重的关键。
以往,我国慢性肝病的最常见病因是乙型肝炎;随着经济状况的改善和生活水平的提高,肥胖所致的脂肪肝已成为我国慢性肝病的最常见病因。
最新统计表明,我国成年人脂肪肝患病率达30%左右,因此监测肝脏脂肪变性程度也成为非常重要的一项体检内容。
过去,肝组织病理活检一直是诊断肝纤维化的“金标准”,尤其在某些情况下确定肝纤维化病因具有不可取代的作用,但由于肝穿刺其有创性和不可重复操作的缺点,可能出现疼痛、感染、局部血肿甚至死亡的风险,以及存在肝穿样本误差和阅片者偏差,导致其在临床上的应用受到一定限制。
随着医疗技术的发展,一种新型的肝纤维化无创检测仪器——“瞬时弹性成像”,英文名称为“FibroScan ”,一些网民根据它的译音称其为“飞波”,用来检测肝脏硬度值,以评估肝脏纤维化程度。
该仪器2001年由法国Echosens 公司研制成功,可部分替代肝穿刺活检,同时还能够应用于各类肝病不同阶段病情的监测与评估。
因操作简便,对人体没有创伤,被很多健康体检中心列为常规体检项目。
原理仪器上装备有一个探极,探极中有一个超声换能器,可以把仪器发出的小振动波通过超声换能器向肝组织传递,同时收集肝组织对振动波的脉冲回声波,通过回声波的速度测量肝组织的弹性。
回声波在肝脏中的传递速度与肝组织硬度直接相关,肝组织硬度越大,回声波的传播速度则越快,弹性数值越大,由此来评估肝纤维化的程度。
该仪器还把肝脏内脂肪组织,在超声波下回声衰减的情况,转化成一种反相射频信号的参数——肝脏脂肪变性受控衰减参数(CAP ),使肝脏内脂肪堆积的情况能够比较准确地以参数形式反映出来,实现了对肝脏脂肪变性的定量检测。
检查方法患者取仰卧位,右手抱头,最大限度展现肋间隙,在探极上涂抹导电凝胶后,将探极垂直置于肋间隙,测定肝右叶的弹性。
FibroScan 有什么技术优势?由于其具肝脏弹性硬度检查——一种检测肝纤维化的新手段(FibroScan )867936527@q q.c o m欢迎赐稿14有无创、简便、快速、易于操作、可重复性、安全性和耐受性好的特点,可以较好的判断肝脏纤维化和脂肪变严重程度,可部分取代肝穿刺活检,减少临床肝穿刺的需求,目前已被美国肝病学会(AASLD)、欧洲肝病学会(EASL)及中国慢性乙型肝炎防治指南,推荐为乙型、丙型肝炎病毒相关肝纤维化临床评估的重要手段。
瞬时弹性成像技术在慢性肝病肝纤维化诊断中的应用进展沈斐斐(综述);陆伦根(审校)【摘要】The liver fibrosis is closely related to the diagnosis and treatment of chronic liver diseases. Early diagnosis of liver fibrosis might help patients with compensated liver functions slow down to the decompensated period,and also reduce the incidence of hepatocellular carcinoma. Liver biopsy is considered as the gold standard to assess the extent of liver damage in patients with chronic liver disease,but it is invasive. Transient elastography is a relatively novel,safe,noninvasive technique to evaluate liver stiffness. It can not only monitor the progression of liver fibrosis dynamically,but also objectively evaluate the liver damage. It is now widely used in clinic. In this review,the value of transient elastography in diagnosis of liver fibrosis was discussed.%肝脏纤维化程度及进展与慢性肝脏疾病的诊断与治疗密切相关。


822020年第4卷第23期2020 V ol.4 No.23现代医学与健康研究Modern Medicine and Health Research□诊疗技术/Diagnostic Technique[3] 中华医学会妇产科学分会妇科内分泌学组. 异常子宫出血诊断与治疗指南[J]. 健康管理, 2017, 21(6): 74-79.[4] 王英. 宫腔镜对异常子宫出血的诊断价值[J]. 中外医学研究,2019, 17(34): 63-64.[5] 施佳伟. 宫腔镜技术在异常子宫出血患者诊疗中的应用价值[J].系统医学, 2020, 5(1): 130-133.[6] 王胜华, 饶友敏. 宫腔镜检查在异常子宫出血诊断中的应用[J].医疗装备, 2019, 32(23): 35-37.肝脏瞬时弹性成像技术诊断肝纤维化及血小板参数、凝血酶原时间与肝纤维化程度的相关性分析谢 静(常州市第三人民医院肝病科,江苏 常州 213001)摘要:目的 探讨肝脏瞬时弹性成像技术诊断肝纤维化及血小板参数、凝血酶原时间与肝纤维化程度的相关性。
方法 随机选取2018年1月至2020年6月常州市第三人民医院收治的80例慢性肝炎患者进行前瞻性研究,对其进行肝脏瞬时弹性成像技术检测、血浆指标检测,同时做病理穿刺活检检查。
观察患者病理分期检查结果;观察肝纤维化的有无对检查指标的影响;ROC 曲线分析肝脏瞬时弹性成像技术对肝纤维化分期的诊断效能;分析血小板参数、凝血酶原时间、肝脏硬度(LSM )值与肝纤维化程度的相关性。
结果 病理穿刺活检结果显示,80例患者中S0期6例,S1期18例,S2期20例,S3期21例,S4期15例;明显肝纤维化患者LSM 值、平均血小板体积、血小板分布宽度均高于无明显肝纤维化患者,凝血酶原时间长于无明显肝纤维化患者,血小板计数低于无明显肝纤维化患者;ROC 曲线分析,肝纤维化程度越高,曲线下面积(AUC )值越大,灵敏度及特异度越高;经Spearman 相关性分析显示,肝纤维化分期与LSM 值、平均血小板体积、血小板宽度及凝血酶原时间呈正相关,且与血小板计数呈负相关(r = 0.383、0.083、0.103、0.433、-0.517,均P <0.05)。