sas期末考试作业
- 格式:doc
- 大小:35.50 KB
- 文档页数:3
sas期末考试题一、选择题(每题3分,共30分)1. SAS系统中,用于读取数据集的语句是:A. proc print data=dataset;B. data=dataset;C. set dataset;D. read dataset;2. 在SAS中,以下哪个函数用于计算数据集的中位数?A. meanB. medianC. modeD. sum3. 如果需要在SAS中对数据进行排序,应该使用哪个过程?A. proc means;B. proc sort;C. proc print;D. proc univariate;4. 在SAS中,如何创建一个新的数据集?A. 使用proc step过程B. 使用data step过程C. 使用proc print过程D. 使用proc means过程5. SAS中,哪个语句用于将两个数据集合并?A. mergeB. appendC. combineD. join6. 在SAS中,如何将一个变量的值赋给另一个变量?A. setB. assignC. putD. set7. SAS中,哪个函数用于计算数据集的最大值?A. maxB. minC. rangeD. high8. 在SAS中,如何将一个数据集中的数据按特定变量分组?A. 使用by语句B. 使用where语句C. 使用if语句D. 使用select语句9. SAS中,哪个过程用于生成描述性统计量?A. proc means;B. proc print;C. proc univariate;D. proc sort;10. 在SAS中,如何将一个数据集的数据输出到一个新的文件中?A. 使用output out=语句B. 使用print to=语句C. 使用write to=语句D. 使用save to=语句二、简答题(每题5分,共20分)1. 描述SAS中数据步(data step)的主要功能,并给出一个简单的示例。

要求:打印,A4,单面或者双面均可。
第二页列出原题(直接拷贝),从第三页开始给出结果。
一般要求进行分析的要写出程序代码,给出主要或者关键的分析结果,并进行必要的解释和说明。
12月29日交给张海峰,过期不候。
1.对sasuser.gpa(1)用tabulate过程分析satm分布并简述结果;(2)计算hss、hsm和hse的相关系数;(3)绘制satm的直方图;(4)画satv对satm的散点图。
(gpa数据集在C:\Program Files\SAS Institute\SAS\V8\insight\sample文件夹下)提示:gpa(College Grade Point Average)大学平均成绩,hsm(High School Math Average)高中数学平均成绩,hss(High School Science Average)高中科学平均成绩,hse(High School English Average)高中英语平均成绩,satm(Math SAT Score)数学统计得分,satv(Verbal SAT Score)口语表达统计得分。
2. 某小麦良种的千粒重μ0=34g,现自外地引入一高产品种,在8个小区种植,得其千粒重(g)为:35.6、37.6、33.4、35.1、32.7、36.8、35.9、34.6,问新引入品种的千粒重与当地良种有无显著差异?(提示用mean过程做t检验)1.用tabulate过程绘制sasuser.gpa中gpa按性别分类及不分类的平均值、标准差,及男女生人数。
使用中文标签。
(gpa数据集在C:\Program Files\SAS Institute\SAS\V8\insight\sample文件夹下)提示:gpa(College Grade Point Average)大学平均成绩,hsm(High School Math Average)高中数学平均成绩,hss(High School Science Average)高中科学平均成绩,hse(High School English Average)高中英语平均成绩,satm(Math SAT Score)数学统计得分,satv(Verbal SAT Score)口语表达统计得分。
sas期末考试试题SAS期末考试试题一、选择题(每题2分,共20分)1. 在SAS中,以下哪个命令用于创建数据集?A. PROC SORTB. DATASETSC. SETD. INPUT2. 下列哪个选项不是SAS数据集中的变量属性?A. 长度B. 格式C. 标签D. 颜色3. SAS中的PROC FREQ过程用于:A. 描述性统计分析B. 频率分布分析C. 回归分析D. 时间序列分析4. 以下哪个命令用于在SAS中生成随机数?A. RANDB. RANDOMC. RNDD. UNIVARIATE5. 在SAS中,如何使用PROC GPLOT创建图形?A. 使用PLOT语句B. 使用SGPLOT过程C. 使用GPLOT语句D. 使用GRAPH语句二、简答题(每题10分,共30分)1. 解释SAS中的宏语言及其用途。
2. 描述如何使用SAS进行数据清洗的基本步骤。
3. 简述SAS中PROC UNIVARIATE过程的功能和应用场景。
三、编程题(每题25分,共50分)1. 编写SAS程序,从一个名为“sales_data”的数据集中提取出所有销售额超过平均销售额的产品,并计算这些产品的总销售额。
```sasdata sales_data;set sales_data;if sales > mean(sales);run;proc means data=sales_data mean;var sales;output out=avg_sales mean=avg_sales;run;data top_sales;set sales_data;where sales > avg_sales.avg_sales;run;proc sql;select sum(sales) into: total_salesfrom top_sales;quit;```2. 编写SAS程序,使用PROC REG过程对一个名为“education_data”的数据集进行线性回归分析,预测学生的考试成绩(变量名为“score”)基于其学习时间(变量名为“study_hours”)。
sas考试题库及答案1. 在SAS中,如何使用`proc print`步骤来输出数据集的前几行?A. 使用`proc print data=dataset;`命令B. 使用`proc print data=dataset firstobs=5;`命令C. 使用`proc print data=dataset first=5;`命令D. 使用`proc print data=dataset top;`命令正确答案是B。
2. 如果想要在SAS中创建一个数据集,并将某个变量的值替换为缺失值,应该如何操作?A. 使用`data`步骤和`if`语句B. 使用`data`步骤和`replace`函数C. 使用`proc sql`步骤D. 使用`proc means`步骤正确答案是A。
3. 在SAS中,如何将一个数据集的列名从`Var1`更改为`Variable1`?A. 使用`rename`语句:`rename Var1=Variable1;`B. 使用`rename`语句:`rename Variable1=Var1;`C. 使用`proc contents`步骤D. 使用`proc print`步骤正确答案是A。
4. 如何在SAS中使用`proc means`步骤来计算数据集的描述性统计量?A. 使用`proc means data=dataset;`命令B. 使用`proc means data=dataset N NMISS MEAN MEDIAN MAX MIN;`命令C. 使用`proc means data=dataset out=means;`命令D. 使用`proc means data=dataset out=means N NMISS MEAN MEDIAN MAX MIN;`命令正确答案是D。
5. 在SAS中,如何使用`proc sort`步骤对数据集进行排序?A. 使用`proc sort data=dataset;`命令B. 使用`proc sort data=dataset out=sorted_dataset;`命令C. 使用`proc sort data=dataset by variable;`命令D. 使用`proc sort data=dataset out=sorted_dataset by variable;`命令正确答案是D。

SAS期末作业:姓名:李珂专业:中科院文献情报中心图书馆学学号:201228015547003 班级:201209172011年我国各行业各地区就业情况分析1导言本文主要通过SAS软件,采用描述性统计方法和主成分分析的方法,对2011年我国31个地区12个行业的就业数据进行简单的统计分析,并试图得出一定的结论。
我国正处于社会的发展变革期,尤其是经济和文化的发展,各地区行业的就业情况也存在着一定的差异,差异中也可能暗含着一定的规律,所以本文通过对该情况数据的搜集、统计和分析,试图找出某种规律来得出一定结论。
其中,描述性统计主要是求均值、标准偏差、最大值和最小值。
主成分分析法是把多个指标化为少数几个综合指标的一种统计分析方法。
在多指标(变量)的研究中,往往由于变量个数太多, 彼此之间存在着一定的相关性,使得所观测的数据有信息的重叠,研究样本的分布规律比较麻烦。
主成分分析采取一种降维的方法,找出几个综合因子来代表原来众多的变量,使这些综合因子尽可能地反映原来变量的信息量,而且彼此之间互不相关,从而达到简化目的。
2.数据来源本文的数据来自于中国人口和就业统计年鉴(2011年),为了用SAS软件进行分析,首先可以将所下载数据转化为excel格式,再将经过格式统一的数据导入SAS软件,下面是原始数据和数据的导入过程。
(1)原始数据地区农林牧渔业采矿业制造业供应业建筑业运输业信息行业批零业住宿餐饮业金融业房地产业社会福利业北京11910 4419587909145000 284769379696349073441389 216043 233147 254171 20062天津1224 8222063748716401 78615 58147 21021 76822 33947 55258 23215 976河北581 14891275872635654 16543345417 29005 89277 13846 141260 13845 1018山西395 34636949389625191 85288 26274 11084 52872 18687 48270 17156 3330内蒙古7106 11473133157734002 94826 13429 6334 29932 10724 33399 6319 978辽宁6867 260978101216563301 13788966071 40186 108928 48949 101782 49045 8339吉林5236 11174443618128443 62984 29342 25877 49623 15930 37915 20539 3252黑龙江6698 22225344066831541 10293914704 24772 86955 11373 67151 17547 1018上海6809 479 125916014693 67694 21737446981 209677 91511 165603 84812 1054江苏3384 51244286257157866 35661811624146940 207300 81040 159461 45333 18324浙江1994 9869321301949066 143381797988 77553 238490 122620 199762 83622 8664安徽11 17039759775238499 26757247251 16183 66609 25181 75217 31221 8781福建6180 30264218446438220 39580938518 25672 77411 41588 62109 58516 2690江西3027 2424152769924672 62554 14388 10569 27573 7014 38299 8777 1780山东9147 175168289623856404 41366897724 33958 255052 57458 210344 61729 6879河南17904 370429130227881628 64150652224 24616 158144 49337 121988 68169 20070湖北1866 3333985949132531 44172969209 23565 134713 49415 63764 37760 6673湖南1704 5353778174534997 46407950823 21311 111246 57417 120223 65337 12652广东6097 17318416521359591 310309270138111686281777 179993 192466 195679 12286广西7734 1543741461719062 16090546460 14097 53910 25208 28227 24690 2814海南769 958 64926 4248 8624 23557 4878 21281 29950 8027 18917 412重庆2044 5456541527142322 32700840633 12134 79520 32188 66910 36407 1028四川1172 9562291462770909 52686355432 24253 94448 29921 77974 40154 3416贵州944 8552924219112439 58939 11724 9961 55330 17185 32100 27607 3154云南4537 9368640734535072 26415343749 21073 97317 40266 28383 31436 3927西藏267 9 1761 4 2392 94 8 691 15 1059 45 5陕西413 5261544439422333 10515723724 27393 55287 33037 65333 31131 4010甘肃1407 5328915935710514 60472 16657 7845 27178 8601 23977 9034 329青海3424 1149254472 2737 15539 5360 1446 9483 1910 2725 3684 951宁夏469 5106090227 15545 14827 2590 1994 7598 3509 10523 4993 26新疆5131 14196120718736582 98586 23823 9338 35750 11426 26430 15871 954(2)数据的导入过程新建一个名称为“jiuye”的数据集,并保存,下面是导入数据的代码:Data jiuye;Input regions$ agriculture mining manufacturing production construction transport IT wholesale hotels finance estate socialwelfare;Cards;北京11910 44195 879091 45000 284769 379696 349073 441389 216043 233147 254171 20062天津1224 82220 637487 16401 78615 58147 21021 76822 33947 55258 23215 976河北581 148912 758726 35654 165433 45417 29005 89277 13846 141260 13845 1018山西395 346369 493896 25191 85288 26274 11084 52872 18687 48270 17156 3330内蒙古7106 114731 331577 34002 94826 13429 6334 29932 10724 33399 6319 978辽宁6867 260978 1012165 63301 137889 66071 40186 108928 48949 101782 49045 8339吉林5236 111744 436181 28443 62984 29342 25877 49623 15930 37915 20539 3252黑龙江6698 222253 440668 31541 102939 14704 24772 86955 11373 67151 17547 1018上海6809 479 1259160 14693 67694 217374 46981 209677 91511 165603 84812 1054江苏3384 51244 2862571 57866 356618 116241 46940 207300 81040 159461 45333 18324浙江1994 9869 3213019 49066 1433817 97988 77553 238490 122620 199762 83622 8664安徽11 170397 597752 38499 267572 47251 16183 66609 25181 75217 31221 8781福建6180 30264 2184464 38220 395809 38518 25672 77411 41588 62109 58516 2690江西3027 24241 527699 24672 62554 14388 10569 27573 7014 38299 8777 1780山东9147 175168 2896238 56404 413668 97724 33958 255052 57458 210344 61729 6879河南17904 370429 1302278 81628 641506 52224 24616 158144 49337 121988 68169 20070湖北1866 33339 859491 32531 441729 69209 23565 134713 49415 63764 37760 6673湖南1704 53537 781745 34997 464079 50823 21311 111246 57417120223 65337 12652广东6097 17318 4165213 59591 310309 270138 111686 281777 179993 192466 195679 12286广西7734 15437 414617 19062 160905 46460 14097 53910 25208 28227 24690 2814海南769 958 64926 4248 8624 23557 4878 21281 29950 8027 18917 412重庆2044 54565 415271 42322 327008 40633 12134 79520 32188 66910 36407 1028四川1172 95622 914627 70909 526863 55432 24253 94448 29921 77974 40154 3416贵州944 85529 242191 12439 58939 11724 9961 55330 17185 32100 27607 3154云南4537 93686 407345 35072 264153 43749 21073 97317 40266 28383 31436 3927西藏267 9 1761 4 2392 94 8 691 15 1059 45 5陕西413 52615 444394 22333 105157 23724 27393 55287 33037 65333 31131 4010甘肃1407 53289 159357 10514 60472 16657 7845 27178 8601 23977 9034 329青海3424 11492 54472 2737 15539 5360 1446 9483 1910 2725 3684 951宁夏469 51060 90227 15545 14827 2590 1994 7598 3509 10523 4993 26新疆5131 141961 207187 36582 98586 23823 9338 35750 11426 26430 15871 954;Run;3.数据分析通过数据的导入,我们可以在SAS系统中找到该数据集,然后开始对数据的分析,我们将其分为两个部分:(1)描述性统计主要是对各行业的就业量进行均值计算,分析出各行业的就业量情况,代码如下:proc means data=jiuye;var regions$ agriculture mining manufacturing production construction transport IT wholesale hotels finance estate socialwelfare;run;输出结果如下:从图中可以看出各行业在各地区就业量的均值,其中均值最大的是manufacturing 即制造业,其次是construction即建筑业,排在第三位的是wholesale即批发零售行业,说明在这三个行业就业量比较高。
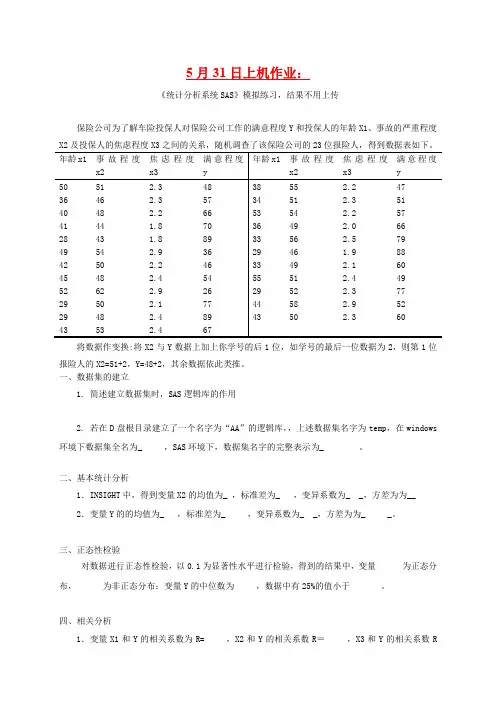
5月31日上机作业:《统计分析系统SAS》模拟练习,结果不用上传保险公司为了解车险投保人对保险公司工作的满意程度Y和投保人的年龄X1、事故的严重程度X2及投保人的焦虑程度X3之间的关系,随机调查了该保险公司的23位报险人,得到数据表如下。
将数据作变换:将X2与Y数据上加上你学号的后1位,如学号的最后一位数据为2,则第1位报险人的X2=51+2,Y=48+2,其余数据依此类推。
一、数据集的建立1. 简述建立数据集时,SAS逻辑库的作用2. 若在D盘根目录建立了一个名字为“AA”的逻辑库,,上述数据集名字为temp,在windows 环境下数据集全名为_ ,SAS环境下,数据集名字的完整表示为_ 。
二、基本统计分析1.INSIGHT中,得到变量X2的均值为_ ,标准差为_ ,变异系数为_ _,方差为为__ 2.变量Y的的均值为_ ,标准差为_ ,变异系数为_ _,方差为为_ _。
三、正态性检验对数据进行正态性检验,以0.1为显著性水平进行检验,得到的结果中,变量为正态分布,为非正态分布;变量Y的中位数为,数据中有25%的值小于。
四、相关分析1.变量X1和Y的相关系数为R= ,X2和Y的相关系数R=,X3和Y的相关系数R=,X2和X3的相关系数R= 。
2. 写出用相关系数说明问题时,要注意的几点,至少写出3点。
(答案供参考)答:1)相关系数很强并不表示变量间一定有因果关系,也可能是两个变量同时受第三个变量的影响而使他们有很强的相关;2)相关系数是说明线性联系程度的。
相关系数接近于0的变量间可能存在非线性联系(可能是曲线关系);3)有时个别极端数据可能影响相关系数;4)强相关并不表示一定存在因果关系;5)弱相关并不表示变量间不存在关系。
五、假设检验1.简述假设检验的基本思想。
在假设检验中,P值的含义是什么?(答案供参考)答:首先给定一个原假设H0,H0是关于总体参数的表述,与此同时存在一个与H0相对立的备择假设H1,H0与H1有且仅有一个成立;经过一次抽样,若发生了小概率事件(通常把概率小于0.05的事件称为小概率事件),可以依据“小概率事件在一次实验中几乎不可能发生”的理由,怀疑原假设不真,作出拒绝原假设H0,接受H1的决定;反之,若小概率事件没有发生,就没有理由拒绝H0,从而应作出拒绝H1的决定。
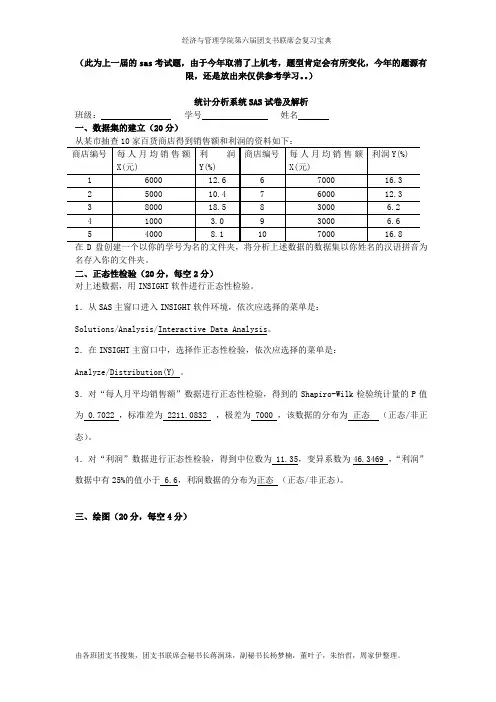
(此为上一届的sas考试题,由于今年取消了上机考,题型肯定会有所变化,今年的题源有限,还是放出来仅供参考学习。
)统计分析系统SAS试卷及解析班级:学号姓名一、数据集的建立(20分)在D盘创建一个以你的学号为名的文件夹,将分析上述数据的数据集以你姓名的汉语拼音为名存入你的文件夹。
二、正态性检验(20分,每空2分)对上述数据,用INSIGHT软件进行正态性检验。
1.从SAS主窗口进入INSIGHT软件环境,依次应选择的菜单是:Solutions/Analysis/Interactive Data Analysis。
2.在INSIGHT主窗口中,选择作正态性检验,依次应选择的菜单是:Analyze/Distribution(Y) 。
3.对“每人月平均销售额”数据进行正态性检验,得到的Shapiro-Wilk检验统计量的P值为 0.7022 ,标准差为 2211.0832 ,极差为 7000 ,该数据的分布为正态(正态/非正态)。
4.对“利润”数据进行正态性检验,得到中位数为 11.35,变异系数为46.3469 ,“利润”数据中有25%的值小于 6.6,利润数据的分布为正态(正态/非正态)。
三、绘图(20分,每空4分)在分析家中绘制上述图,相关的选项为:Point symbol: SQUARE,Connect lines: connect points with straight lines, line style: Solid, Number of minor horizontal tick marks: 1, Number of minor vertical tick marks: 0。
解析:①依次点击菜单”Solutions/Analysis/Analyst”进入分析家环境;②在分析家中打开数据集;③依次点击菜单”Graphs/Scatter Plots/ 2 dimensions”,在系统弹出的对话框中,作如下设置:(填空如上)四、相关分析(20分,每空3分,正确上传文件5分)1.在SAS的分析家中进行相关分析,得到两变量的相关系数为: 0.98738 ,检验概率为:<0.0001 ,你的结论是:两变量的相关关系为:密切相关。
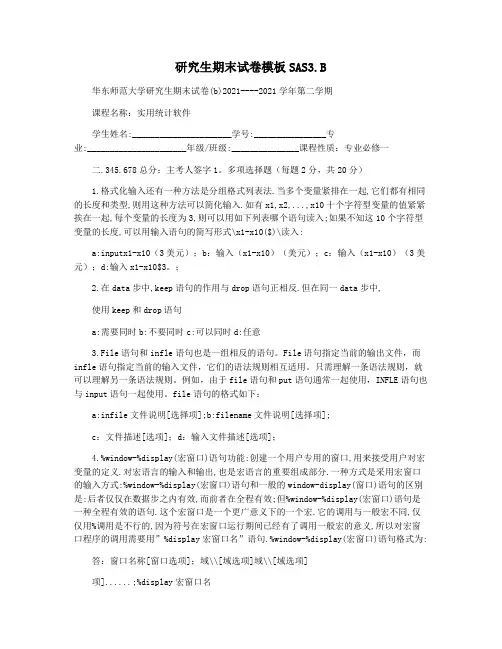
研究生期末试卷模板SAS3.B华东师范大学研究生期末试卷(b)2021----2021学年第二学期课程名称:实用统计软件学生姓名:______________________学号:________________专业:______________________年级/班级:_______________课程性质:专业必修一二.345.678总分:主考人签字1。
多项选择题(每题2分,共20分)1.格式化输入还有一种方法是分组格式列表法.当多个变量紧排在一起,它们都有相同的长度和类型,则用这种方法可以简化输入.如有x1,x2,...,x10十个字符型变量的值紧紧挨在一起,每个变量的长度为3,则可以用如下列表哪个语句读入;如果不知这10个字符型变量的长度,可以用输入语句的简写形式\x1-x10($)\读入:a:inputx1-x10(3美元);b:输入(x1-x10)(美元);c:输入(x1-x10)(3美元);d:输入x1-x10$3。
;2.在data步中,keep语句的作用与drop语句正相反.但在同一data步中,使用keep和drop语句a:需要同时b:不要同时c:可以同时d:任意3.File语句和infle语句也是一组相反的语句。
File语句指定当前的输出文件,而infle语句指定当前的输入文件,它们的语法规则相互适用。
只需理解一条语法规则,就可以理解另一条语法规则。
例如,由于file语句和put语句通常一起使用,INFLE语句也与input语句一起使用。
file语句的格式如下:a:infile文件说明[选择项];b:filename文件说明[选择项];c:文件描述[选项];d:输入文件描述[选项];4.%window-%display(宏窗口)语句功能:创建一个用户专用的窗口,用来接受用户对宏变量的定义.对宏语言的输入和输出,也是宏语言的重要组成部分.一种方式是采用宏窗口的输入方式:%window-%display(宏窗口)语句和一般的window-display(窗口)语句的区别是:后者仅仅在数据步之内有效,而前者在全程有效;但%window-%display(宏窗口)语句是一种全程有效的语句.这个宏窗口是一个更广意义下的一个宏.它的调用与一般宏不同,仅仅用%调用是不行的,因为符号在宏窗口运行期间已经有了调用一般宏的意义,所以对宏窗口程序的调用需要用”%display宏窗口名”语句.%window-%display(宏窗口)语句格式为:答:窗口名称[窗口选项];域\\[域选项]域\\[域选项]项]......;%display宏窗口名b:窗口;窗口名称[窗口选项]域\\[域选项]域\\[域选择项]......;%display宏窗口名c:%window窗口名[窗口选项]域\[域选项]域\[域选项]项]......;%display宏窗口名d:%window窗口名[窗口选项]域\\[域选项];\\%mend;%display宏窗口名5.%macro-%mend(宏函数)语句函数:定义宏宏宏宏宏宏是一种存储文本,由名称标识宏-%mend的函数与%let的函数相同。
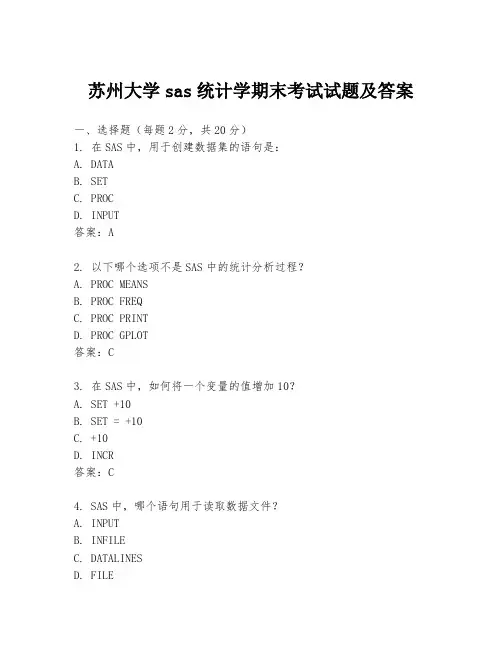
苏州大学sas统计学期末考试试题及答案一、选择题(每题2分,共20分)1. 在SAS中,用于创建数据集的语句是:A. DATAB. SETC. PROCD. INPUT答案:A2. 以下哪个选项不是SAS中的统计分析过程?A. PROC MEANSB. PROC FREQC. PROC PRINTD. PROC GPLOT答案:C3. 在SAS中,如何将一个变量的值增加10?A. SET +10B. SET = +10C. +10D. INCR答案:C4. SAS中,哪个语句用于读取数据文件?A. INPUTB. INFILEC. DATALINESD. FILE5. 在SAS中,如何将一个数据集的所有变量输出到一个报告中?A. PRINTB. PROC PRINTC. REPORTD. LIST答案:B6. 以下哪个选项是SAS中的数据步?A. DATAB. PROCC. RUND. QUIT答案:A7. 在SAS中,如何将一个数据集的前10行输出?A. FIRSTOBS=10B. OBS=10C. N=10D. LIMIT=10答案:B8. SAS中,哪个语句用于定义一个宏变量?A. DEFINEB. %LETC. %MACROD. %DO答案:B9. 在SAS中,如何将一个数据集的变量值进行排序?B. ORDERC. RANKD. SEQ答案:A10. SAS中,哪个语句用于创建一个数据集的子集?A. IF-THENB. WHEREC. SUBSETD. SELECT答案:B二、简答题(每题5分,共30分)1. 简述SAS中PROC SQL的作用。
答案:PROC SQL在SAS中用于执行SQL语句,可以进行数据查询、更新、插入和删除等操作。
2. 解释SAS中宏变量的用途。
答案:宏变量在SAS中用于存储文本值,可以在程序中重复使用,以提高代码的可读性和可维护性。
3. 在SAS中,如何使用PROC CONTENTS查看数据集的基本信息?答案:使用PROC CONTENTS语句,可以查看数据集的变量名、类型、长度、标签等信息。
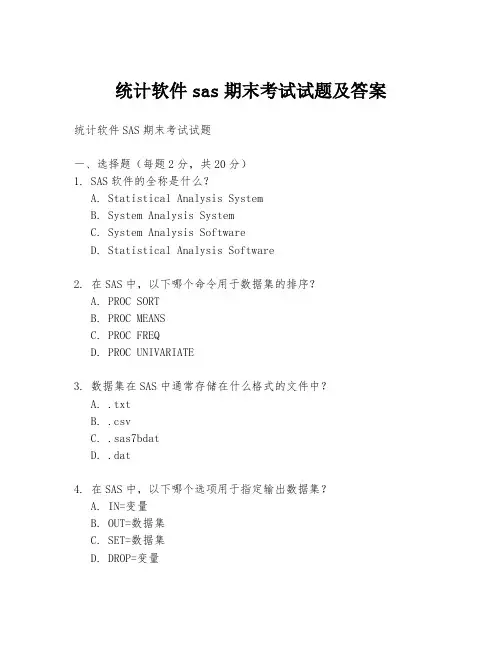
统计软件sas期末考试试题及答案统计软件SAS期末考试试题一、选择题(每题2分,共20分)1. SAS软件的全称是什么?A. Statistical Analysis SystemB. System Analysis SystemC. System Analysis SoftwareD. Statistical Analysis Software2. 在SAS中,以下哪个命令用于数据集的排序?A. PROC SORTB. PROC MEANSC. PROC FREQD. PROC UNIVARIATE3. 数据集在SAS中通常存储在什么格式的文件中?A. .txtB. .csvC. .sas7bdatD. .dat4. 在SAS中,以下哪个选项用于指定输出数据集?A. IN=变量B. OUT=数据集C. SET=数据集D. DROP=变量5. 以下哪个SAS过程用于描述性统计分析?A. PROC GLMB. PROC TTESTC. PROC CORRD. PROC MEANS6. 在SAS中,如何创建一个新变量?A. 使用IF语句B. 使用CREATE语句C. 使用DEFINE语句D. 使用NEW语句7. SAS编程语言属于哪种类型?A. 过程式编程语言B. 面向对象编程语言C. 函数式编程语言D. 声明式编程语言8. 在SAS中,以下哪个命令用于生成报告?A. PROC REPORTB. PROC PRINTC. PROC TABULATED. PROC FREQ9. 在SAS中,以下哪个选项用于指定数据集的观察顺序?A. ORDER=数据集B. SORT=变量C. ORDERED=变量D. OBS=变量10. SAS软件主要用于哪些领域?A. 数据管理B. 数据分析C. 数据可视化D. 所有以上选项答案:1. A2. A3. C4. B5. D6. A7. A8. A9. B10. D二、简答题(每题10分,共30分)1. 简述SAS软件的主要功能。
SAS期末考试题(从中至少选择6题)一。
SAS的逻辑库可分为永久库和临时库两种,请编写一段程序直接建立临时库(work)中的下例数据集,按升序排序,并进行正态性检验.数据名test:55 20 13 20 16 23 19 35 19 16 98二.用乙基柯柯碱做利尿试验,实验分两组,一组注射乙基柯柯碱10mg/kg,一组注射生理盐水做对照,以给药后90Min排尿量(ml)作为药物作用指标,对照组与用药组的观察值列出如下:对照组:86。
3 45。
0 82。
5 56.0 88。
0 26.5用药组:86.0 143。
0 111。
5 171.0 100.0•1。
对资料进行正态性检验• 2.选择合适的指标对资料进行统计学描述•3。
试比较两种药物的疗效是否有差别三. 1.请编写一段程序把数据2并列合并到数据1之后2.对合并后的数据进行更新,更新后的数据替换原来的数据,需要更新的数据包括:ZhouLan的性别由F改为M;WeiLin的年龄20改为25.3。
对合并后的数据集进行转置数据1:LiuWei M 21 175 65 AZhouLan F 20 160 46 ODengXue F 22 158 45 BZhuJun M 23 177 68 OHuangXiaoming M 19 173 65 O数据2:ChenQiong F 19 155 45 AZhaoFeng M 22 179 66 BZhangBin M 22 173 64 OWeiLin F 20 162 46 AShiQiang M 21 180 70 B四、某职业病防治院对31名石棉矿工中的石棉肺患者、可疑患者及非患者进行了用力肺活量测定,问三组石棉矿工的用力肺活量有无差别?(方差分析proc五、为了考察化肥施用量与水稻产量之间的关系,在土质、面积、种子等相同条件下,由试验取得了如下的数据:化肥用量X (kg) 15 20 25 30 35 40 45水稻产量Y (kg)330 345 365 405 445 490 455• 1. 作出散点图,并分析x与y之间的关系• 2. 生成一个新变量sum(sum=X+Y),并对sum变量进行描述统计分析六、药物A、B分别试500例,用A药发生呕吐反应有6例,用B药发生呕吐反应有11例,问A、B两人药发生呕吐反应率有无差别?(列联表分析)•1。
B卷一、填空题1.宏工具是一种可以用来,减少普通工作文本输入量的SAS工具。
宏工具可以给一段程序命名,并通过这个名称来使用这段程序或文本。
2.宏工具的功能非常强大,可以使用宏工具来完成以下任务。
(1)使用宏变量实现;、(2)使用宏产生程序语句;(3)使用宏循环及条件判断语句完成。
3.在引号内引用宏变量时必须使用。
因为宏只能在内进行。
4.显示宏变量的最简单方法是使用语句,将文本输出到SAS日志窗口。
5.宏表达式一般分为表达式三种。
6.宏引用函数执行的动作等价于或围住SAS语句的某一部分。
7.定义宏变量的语句。
( )=Thursday;data a=;put today is &a ;run;结果:today is Thursday;8.可以使用来查看一个宏变量是否存在于全局变量符号表中。
9.Select子句中,可以表示选择表中的所有列。
10.在调用SAS的SQL过程中,我们应使用。
11.在where语句中,在所有算符前加一个,可以得到相反的选择条件。
12.若使用关键词,则PROC SQL不会剔除结果数据中重复观测。
13.创建一个3行4列同元素为6的矩阵的函数:________。
14.用SAS函数求矩阵A 所有元素均值的句子:________。
15.打开输入和输出文件的方式:_________。
16.IML最基本的数据对象_________。
17.SAS/IML不支持的DATA步函数:_________。
(写出两个即可)18.语句:‘do i=1 to 10 by 2;’循环_____次,输出i=______。
19.在SAS/IML软件也有缺失值问题,矩阵中的缺失值不能视为0,矩阵标识中,数值缺失值用_______表示。
20.只能在______语句和__________子句中设定calculated列。
21.PROC SQL 持续运行直至遇到_____语句、___________步、其他____________过程。
sas期末试题及答案解析一、选择题1. 下列哪个选项是正确的?a) SAS是一种统计分析软件b) SAS是一种操作系统c) SAS是一种数据库管理系统d) SAS是一种编程语言答案:a) SAS是一种统计分析软件解析:SAS(Statistical Analysis System,统计分析系统)是一套用于数据管理、报表制作、统计分析、数据挖掘等功能的软件系统。
它由美国SAS公司开发,广泛应用于各个领域的数据处理和决策支持。
2. SAS的基本语法是什么?a) Javab) C++c) Pythond) SAS答案:d) SAS解析:SAS软件具有自己的编程语言,即SAS语言。
它是一种类似于SQL的专用于数据处理和分析的语言,具有丰富的数据操作和统计分析函数。
3. 在SAS中,用于读取外部数据文件的语句是什么?a) INPUTb) OUTPUTc) EXPORTd) IMPORT答案:d) IMPORT解析:在SAS中,使用IMPORT语句可以将外部数据文件导入到SAS数据集中,方便后续的数据处理和分析。
4. 下列哪个函数可以用于计算某一列数据的平均值?a) SUMb) COUNTc) MINd) MEAN答案:d) MEAN解析:MEAN函数可以用于计算某一列数据的平均值,它是统计分析中常用的函数之一。
二、填空题1. SAS中用于创建新变量的语句是_______。
答案:DATA解析:在SAS中,使用DATA语句可以创建一个新的数据集,并进行后续的数据处理和分析。
2. SAS中用于选择某些特定观测值的语句是________。
答案:WHERE解析:WHERE语句可以用于筛选出符合特定条件的观测值,方便进行针对性的分析和处理。
三、问答题1. 请简要介绍一下SAS的应用领域。
答:SAS的应用领域非常广泛,包括但不限于以下几个方面:1) 统计分析:SAS是一套强大的统计分析软件,可以对大量的数据进行统计描述、推断分析、回归分析、时间序列分析等,为用户提供科学而有效的分析结果。
江西财经大学
2016-2017第1学期期末考试试卷
课程名称:SAS软件课程编码:06082
试卷命题人:董成武试卷审核人:平卫英
说明:1.考试形式。
提交小论文,最多可以2人组成一组。
但需要两人同时提交大作业。
2.题目自拟。
如:对江西省2016年经济运行分析等。
3.数据自己收集,可以在统计年鉴,中华人民共和国国家统计局官网等获取。
4.论文中关于SAS软件的处理部分要表达清楚,如使用窗口操作要写出操作步骤或使用编程处理,并联系实际进行分析说明。
5.要SAS软件进行数据处理,并且,至少要用到以下方法:
(1)表格分析。
(2)图形分析,如:将江西省的情况与全国进行对比等。
(3)多元回归分析,并对回归方程进行必要的诊断。
(4)参数估计与假设检验。
6.论文条理清晰,突出主题。
7.内容完整,格式规范。
8.大家采用学校统一的大作业的封面一和封面二。
9.最迟提交的时间为2016年12月22日。
10.小论文以word文档的格式提交到网络平台的第三次作业处(期末考试)。
第 1 页共1 页。
sas期末考试选择题库1.下面哪个格式修饰符表示能在导入数据值中本身包括空格的是()A.:B.&C.~D.空格2.下列关于宏变量说法错误的是:()A.包含的只是字符数据B.独立于SAS数据集变量C.分为局部宏变量和全局宏变量D.以上说法不全对3.没有规定out=选项时,必须使用FORCE的是:()A.SORTSIZE=B.OBS=C.SORTSEQ=D.DATA=4.下列定义宏变量的语句错误的是()。
A.%let a=ResDat.class;B.call symput(‘x',b);C.select min(weight)into:minw from sashelp.class;D.%call set(‘id');5.下列固定搭配错误的是()A、%macro%mendB、point_stopC、do_endD、if_end6.不可以表示缺失值的字符是()A、空格B、点C、逗号D、missing语句规定的字符7.下列图形中,适合描述数值型数据的是()。
A.饼图B.环形图C.散点图D.条形图8.下面那一项分布的数据,均数等于中位数()。
A.对数正态B.左偏态C.右偏态D.正态9.描述一组对称(或正态)分布数据的离散趋势时,最适宜选择的指标是()。
A.极差B.标准差C.均数D.变异系数10.参数是指()。
A.参与个体数B.研究个体数C.总体的统计指标D.样本的统计指标11.相关关系按变量之间的相关程度划分为()。
A.单相关、复相关和偏相关B.完全相关、不完全相关和不相关C.线性相关和非线性相关D.正相关和负相关12.下面哪一个快捷键用于激活编辑器窗口?()A、F5B、F6C、F7D、F9。
选择题(50)1、input语句一般用来指定数据的读入方式,可以读取各种类型的数据,包括字符型,现有如下一段程序:data one;input name $ score;cards;wanglin 85zhang dong-feng 90;Run;那么在第二个观测中读取到的name为(B)A.zhang dong-fengB. zhangC. zhang doD.zhang dong2、data test;do I=1 to 3;put I= ;end;run;程序在log窗口输出形式为(A)A.I=1 I=2 I=3B. I=2 I=3 I=4C.不显示D. I=3 I=2 I=13、SAS数据集文件后缀名为(A)A、sas7bdatB、sasC、logD、list4、SAS程序由(D)组成,语句用分号结束。
A 过程步B 数据步C 函数步D 语句5、Delete语句表示从表中删去(B)表达式为()的所有行A where 假B where 真C if假D if 真6、假设变量X的值为5,有如下程序if x<5 thenX=x+3;Else x=x-2;则执行程序以后x的值为(B)A.5 B.3 C.8 D.程序错误7、一个完整的SAS程序通常包括和 (B)A、数据步——函数步B、数据步——过程步C、定义步——函数步D、定义步——过程步8、由(A)、分析变量和统计量关键词组成的表达式构成描述性统计报表。
A.分类变量B.sas变量C.sas函数D.sas语言9、SAS系统中除了(B)以外的逻辑库都是永久库。
A.SashelpB.WorkC.MapsD.Sasuser10、默认情况下,快捷键F1-F9中,哪一个键激活编辑器窗口?(A)A、F5B、F6C、F7D、F911、SAS变量的长度默认为(A)个字节。
A、8B、16C、32D、6412、SAS程序中一般不区分大小写,除了(D)中要区分大小写A、数据步B、过程步C、SAS语句D、字符串13、以下不能搭配使用的是(D)A.do…endB.start…finishC.if…thenD.ods…print15 在SAS中建立逻辑库实质上是建立逻辑名和__A______的对应关系A 磁盘上的目录B 磁盘上的数据文件C SAS数据集D Excel文件16 与CARDS语句等价的是_____D___语句A DATAB ENDC FORMATD DATALINES17 在SAS中,如果不经____C____语句特别设置,字符串变量的缺省长度最大为________A LENGTH 16B VAR 8C LENGTH 8D DEFINE 1618 解读下语句的意义 INPUT (name score1-score5) ($10. 5*4.); 是___A______A 变量name长度为10,score1到score5这五个变量长度为4B 变量name长度为10,score1到score5这五个变量长度为5C 所有变量长度均为10,初值为20D 所有变量长度均为20,初值为1019、假设变量X的值为5,有如下程序:IF X THENY=X;ELSEY=X-2;则执行程序以后变量Y的值为(A)A 、5 B、3 C、8 D、程序错误20、假设变量X1=9,X2=5.752,则MOD[X1,LNT(X2)]/SIGN(X2)的运算结果为(C)A、-4B、0.4C、4D、-0.421、数值型常用缺省值用(B)表示A ’—‘B ‘.’C ‘空格’D _22、可以表示缺失值的字符不正确的是(D)A 空格B 点C MISSING语句规定的字符D 横线23、下列配套语句中不一定正确的是(D)A do endB point stopC select fromD if else24、下面那个不是函数自变量的类型(B)A 变量名B 运算符C 函数D 常数25、PUT 是(C)A 保留字B 代码C 关键字D 输入函数26、如下一段程序:Data;Input x @@;Cards;2 3 4 9 1;Run;模块当运行程序以后SAS系统会产生SAS数据集(C)A dataB nullC data1D 程序错误27、data test;Do i=1 to 3;End;Run;程序结果在log窗口输出形式为(A)A i=1 i=2 i=3B i=2 i=3 i=4C 不显示D i=3 i=2 i=128、SAS在读入外部数据文件时的数据,用(B)语句A INFILEB INPUTC OUTPUTD FILE29、横向合并时需要用什么语句?(D)A outputB fileC inputD merge30、指数算符R=1:5;产生的向量是(A)A、R={1 2 3 4 5}B、R={1, 2 ,3, 4, 5}C、R={1 5}D、R={1 3 5}31、data ex;input date mmddyy10.;format date date9.;put date=;cards;12-01-2016 ;proc print;run; 正确的运行结果是(D)A:12/01/2016B:01/12/2016C:12JAN2016D:01DEC201632、data test;do l=1 to 3;put l=;end;run;程序结果在log窗口输出形式为(A)A.l=1 l=2 l=3B.l=2 l=3 l=4C.不显示D.l=3 l=2 l=133、RUN是(D)A、核心字B、过程步C、数据步D、关键字34、字符变量y占5列且保留两位小数的输入格式为(B)rmat y$7.2rmat y$5.2C.format y$5.2D.input y$7.235、下列每组的两个语句中,不等价的是(D)A.sum(of x1-x5);B.put x 1-8.2;sum(x1,x2,x3,x4,x5); put @1 x 8.2;C.Z=min(A,B);D.%let DSN=ResDat.class;Z=A><B; %macro MAC;文本;%mend MAC;36、在prociml中,如果有关键字start,后面一定要接(D)A、quitB、stopC、pointD、finish37下列引用SAS常数的方法,正确的是(D)=”TOM””S”;=’TOM’S’;=”TOM”S”;=”TOM’s”;38选择矩形的子阵,下列语句正确的是(A)A.summat1=coffee[ {1 3 } , {2 3 5} ];B.summat1=coffee( 1 ,3 ; 2 ,3, 5 );C.summat1=coffee {1 3 } , {2 3 5} ;D.summat1=coffee[ 1 3 , 2 3 5 ];39下列语句中,正确的是(D)A.sin0;B.data aC.ln(x);D.put x=’’;40、有如下SAS程序:data fh;Input x 4.2;Cards;122.115.623.46;Proc print;Run;则运行结果是:(A)A:0.12 2.10 15.60 23.40 B:12 2.1 15.6 23.46 C:0.12 2.1 15.6 23.46 D:12 2.1 15.60 26.4041、选出下面中是求行最大值和的语句(C)A. B=A[,<>[,+]]B. B=A[<>,][,+]C. B=A[,<>][+,]D. B=A[<>,][+,]42、下列哪一个程序不能创建五阶矩阵(A)A. proc iml;aa=shape({1,5}1,5);print ;run;B. proc iml;a=uniform(repeat(0,5,5);print a;run;C. proc iml;one=j(5,5,7);print one;run;D. proc iml;a={1 2 3 4 52 3 4 5 63 4 5 6 74 5 6 7 55 6 9 6 6};Print;Run;43、对变量x1—x5求和的程序步是:(B)A:sum of (x1—X5);B: sum (of x1—x5);C:sum (x1—x5)‘D:sum x;44、间接引用宏变量%let data1=x;%let data2=y;%let data3=z;%macro test;____C______;%put &&data%i;%end;%mend test;%test;A.do i=1 to 3B.%do i=1 to 3C.%do i=1 %to 3D.do i=1 %to 345、自然数求和Data a;T=0;___A_____;T=t+n;Output;End;Proc print;Run;B.do n=1 to 100 B.n=1 to 100C.1 to 100D.do n=1 to n=10046、姓名属于(D)A、分类变量B、分析变量C、自变量D、其他47、功能键F8的功能是(D)A、显示帮助B、进入编辑窗口C、进入日志窗口D、程式提交运行48、point必须与(D)配对?A、endB、finishC、procD、stop49、最简单的定义宏变量的方式就是使用程序语句(B)A、%macro macB、%letC、%macD、%if50、可以在(D)使用全局通用语句A、data步B、过程步C、数据步D、任何地方填空题(70道)1、一个完整的SAS程序由二部分组成:数据步与过程步。
《统计软件实验》期末模拟考试试卷答题说明:对第三、四大题,按照题目要求将程序写在答题纸上,同时将程序命名为“学号-大题号-小题号.sas”提交,如:103321001-4-1.sas。
一、填空题(每小题2分,共20分)1、使用SAS软件编程读入数据,为正确读入金额数据“$2,112,305.7”应指定其输入格式为。
2、使用SAS软件编程读入数据,为正确输出日期数据“99-10-15”应指定其输出格式为。
3、过程“FREQ”的“Tables”语句的选项“Nocum”的功能是。
4、对“价格分类指数数据”(见EXCEL文档)创建SAS数据集,设将“指标”命名为变量“A”,将“居民消费价格指数”命名为变量“B”。
为给出各地区价格指数的频数直方图,在“Gchart”过程中“Vbar”语句的正确写法是。
5、要检验两个方差相等的正态总体的均值是否相等,可以使用过程。
6、某个单因子方差分析的多重比较结果如图1,由图1可得有显著差异的水平有对。
图17、要返回日期“2012年6月18日”的星期数,可使用函数表达式。
8、使用Freq过程作列联表分析,若每个单元格的期望频数小于5,可在tables语句中使用选项作关联性检验。
9、若要对多元线性回归模型作自相关性诊断,可在model语句中使用选项。
10、检验某班学生的期中成绩a与期末成绩b是否有显著差异,下列方法可行的有种。
(1)在ttest过程中,使用语句paired a*b;(2)先求a与b的差值c,再对c使用means过程及选项prt(3)先求a与b的差值c,再对c使用univariate过程(4)先求a与b的差值c,再对c使用anova过程二、程序改错题(每小题5分,共20分)检查下列四个程序各个语句行是否有错误,如果有错误,指出并改正;如果该行无错误,请打√(每行至多1个错误)。
1~4题的数据及程序文本见电子版附件。
1、程序要求的输出结果为:图2程序为:informat birth yymmdd10.;cards;数据行;run;2、某个试验指标的两个可能影响因子A与B各有4个水平,每个水平组合各做了一次试验,测得指标数据如下,要对该数据分析因子A与因子B的影响是否显著。
Computer Software Application on AquacultureYour grade depends on: 1. Correctness of programming upon the requests in the questions, 2. Syntax error, 3. Structure and notes on the programming, e.g.,sub-setting, comments, designation of variables, titles, etc., and 4. Interpretation of the printouts.Attached your answer in two files: 1. a SAS program file, 2. a word file of the answers to the questions by its order. Submit it to my box (yhchien@.tw) before 17:00 of June 26 (Thu.)_____________________________________________________________I. (10%) The following data are the number of fish caught by a standardized sampling gear (an indication of fish survived) in each of the 9-week experiment period. A decaying exponential equation or survival model is used to present the survival condition over the whole experiment period. Fit the given data to the equation: Nt = No x exp (-z x t), where Nt is the number of fish survived at week t, No the number of fish at stocking, z the weekly instantaneous mortality coefficient, by using1.Direct fitting method, and2.Log-transform to linear method.Provide the following answers:(1) What are the estimates of No and z?(2) A plot showing the observed and the predicted and a plot for residual distribution. (Data for question I is on attached file Q1data)II. (20%) This question is to test your ability how to reorganize data sets, differentiate some parameters expressing variability, and examine relationships between two(2) Get the summary statistics: mean, standard deviation (std), standard error (stderr), and coefficient of variation (cv) of both height (ht) and weight (wt) and show me and prove to me the mathematical relationships: a. between standard deviation and standard error, b. between cv and mean;(3) Compare the variation between ht and wt;(4) Plot out: (a) an overlay plot of both ht and wt versus age and (b) a plot of wt versus ht; and(5) Fit the data into a weight-length(height) equation: wt=a*ht**b by: (a) Non-linear direct fitting and (b) log-transformed linear fitting (hint: log(wt)=log(a)+b*log(ht). (Data for question II is on attached file Q2 data)III. (30%) Below is an experiment conducted to find out the effect of vitamin E deficiency on growth of a certain animal. CWT is the final weight of control group receiving normal diet for a month and DWT the final weight of vitamin E deficiency group. Animals were divided into 5 size classes based on their pre-treatment weight.(1) Use pair-t test to test the difference of their final weight and interpret the SAS printout;(2) Analyze the same data set by two-way ANOV A;(3) Disregard their size class as the experiment would have been conducted with 10 random groups, among them 5 receive normal diet and the other 5 vitamin E deficient diet and reorganize the data set into 10 observations of 2 variables (trt: C and D, and wt) by programming. (hint: use drop statement to retain the variables you want them to stay then create a variable trt. data control; set all; drop size dwt; wt=cwt; drop cwt; trt='c'; proc print;). Use unpair-t test to test the difference of their final weight;(4) Analyze this new data set by one-way ANOV A;(5) Show me F=t2 in both cases, namely, 2-way ANOV A= pair-t and 1-wayANOV A=unpair-t; and(6) Compare the results of using two types of analysis and make your own comments. (Data for question III is on attached file Q3 data)IV. (40%) An experiment was conducted to find out the effects of various sources and levels of carotenoids on the pigmentation of various parts of an ornamental fish, blood parrot. Seven diets (trt): C, A8, A16, B8, B16, H8, and H16 were fed to the fish for 8 weeks, where ‘C’ stood for control diet, which no carotenoid was supplemented, ‘A’ for diets supplemented with astaxanthin (pure and synthetic) from Carophyll Pink (DSM), ‘B’ for diets supplemented with β-carotene (pure and synthetic) from Rovimix β-carotene (DSM), ‘H’ for diets supplemented with algae Haematococcus pluvialis(mainly astaxanthin mixed with other carotenoids and natural), ‘8’ for diets supplemented with one carotenoid from the above 3 sources at a concentration of 80 mg/kg, and ‘16’ for 160 mg/kg. Total 21 aquaria (experimental units) were used so that each treatment had 3 replicates (rep). When the rearing completed, fish survived were dissected into 6 parts to analyze for body content of astaxanthin (in data AA) and β-carotene (in data BB). Here only the pigmentation on fin is used: af and bf. (1) Merge these two data sets by trt and rep, create two new variables: total carotenoid (cf=af+bf) and ratio of astaxanthin toβ-carotene (rab=af/bf);(2) Conduct a one-way ANOV A on 7 treatments, followed by Duncan’s multiple range test (DMRT);(3) Conduct an orthogonal contrast for the following 6 comparisons:(i) Control vs. pigmented, (ii) Astaxanthin (A’s and H’s) vs.β-caroten e (B’s), (iii) Astaxanthin: Synthetic (A’s) vs. Natural (H’s), (iv) A8 vs. A16, (v) B8 vs. B16, and (vi) H8 vs. H16.(4) Drop Control so that the remaining 6 treatments become 2 (concentrations: 80mg/kg and 160 mg/kg) X 3 (types of carotenoid: A, B, and H). Split one independent variable trt into two independent variables (or factors): con and type (if trt=’H16’ then con=16 and type=’H’;). Now you can perform a two-way ANOV A with and without interaction, followed by DMRT, on 4 dependent variables: af, bf, cf, and rab.(5) Interpret the results obtained.(Data for question IV is on attached file Q4 data)。