图表作文写作攻略.doc
- 格式:doc
- 大小:62.00 KB
- 文档页数:9
Bar chart / graph图表式作文指导一、图表式作文的几种形式一是以表格形式,将统计的数据或被说明的事物直接用表格形式体现出来,即统计表。
二是以图形形式 A 表示数据变化的曲线图; B 表示数据的大小或数量之间的差异的柱状图; C 表示总体内部结构变化的扇形图二、图表式作文写作分三步第一步:开门见山地点明本图表所反映的主题。
常使用的词汇有:table, chart, figure, graph, describe// tell, show, represent 等。
常用句型:1. The graph/chart/table shows that … / As the graph/chart/table shows , …2. From the above graph/chart, it can be seen that... / we can see that…3. As is shown in the graph, ...4. The chart/table shows the differences between…5. According to the statistics shown in the first /second graph, …6. The graph/chart/table shows / indicates / reveals that …7. It can be seen /concluded from the chart / table / figures that …第二步:分析数据间的主要差异及趋势,然后加以描写(在描写数据间变化及总趋势特征时,可采用分类式或对比式以支持主题,并阐明必要的理由)。
注意层次。
即 facts and reasons 。
常用转折、对比及比较的词汇:while, but, on the contrary , however, compare …with …, in contrast to , as…as, the same as, be similar to, difference between, among, more than, less than 常用描写趋势变化的词汇:increase, rise, go up, reduce, drop, go down, fall, reach, remain, by/to, slowly, slightly, gradually, sharply, rapidly, the number of …, from …to 及比较级,倍数句型等。
图表类作文方法总结+范文中的优秀句子【命题趋势】图表类作文是近年出现在高考试题屮的一•种文体。
由于这类图表在现实生活屮应用广泛,因此具有很强的现实意义。
它要求考生通过对数据或文字内容进行分析与讨论,准确地表达内容,然后得出令人信服的结论。
图表类作文有以下趋势:1•图表作文是说明文或议论文。
如是议论文多采川三段式。
2. 信息可适当发挥,但决不允许白行立意,漫天发挥。
3. 讲究写作技巧,要求注意把握要点词的逻辑句子。
【应试对策】一、点明主题常用的词有:1 .table, chart, figure, graph,2. describe, tell, show, represent 等等。
二、分析差异在描写变化及总趋势特征吋,可采用分类式或对比式以支持主题,并阐明必要的理由。
常用的词汇有:l.rise, increase, drop, reduce, decre ase, fall,升高降低2. while, but, on the contrary, however,转折3. compare...to/with...,in contrast 相比Z下4. as...as, the same as, similar to,相同5. be different from., differ from 不同三、常用句式1. As is shown by the graph/in the table that/ As we can see clearly from the chart above...(概述图表)2. The results of the survey seem to suggest that… (得出结论)3•…amount to…(数量总计)(add up to /come to /sum up to )4. …increase (rise/ fall/ drop ) from …to … (数量增减)5. (be) three times as + 形容词 + as6. Compared with …,…7. There is (was) a rapid rise in …8 The changes ....can be explained for several reasons・9. It is reported that 85% of...10 In recent years/during this years ......11 ・・・ are also the reason why the number in creasing so fast.12 From the increased number we can get that...8 •结尾段屮常用的句型:1. In conclusionffo conclude/We can draw the conclusion that...,2. In my opinion/ Pers on ally, I …3. In short (= In brief), in a word,…4 it seems clear that /Ifs clear from the chart that...,5 We can learn/know that..四、优秀句子饮食・1 There have been some changes in the diet of Chinese people. ^Grain, the main food of most people in China, is now playing a less important role. ・3The amount of ............ h as also dropped by 1.5 percent from1998 to 2002・・4The amount of milk and meat has increased・•5 There is no doubt that there will be greater changes in peopled diet in the future.教育•6 It is reported that 85% of the Chinese students felt a heavy workload in their study.7 ...more than 50%of the information is forgotten after one hour, and almost two-thirds within one day・8 2000 the number had in creased to 83%,still much lower for girlsthan for boys・9 The results of the survey seem to suggest that Chinese students abroad have little time for part-time jobs.旅游0 In contrast, the number of people going abroad in 1996 increased.11 There is a growing tendency for Chinese to spend their holiday abroad ・ 12 Compared with the number 5 years ago, which was only 20%, now more than 50% of the families prefer to spend their holiday traveling.志愿者13 The number of people who do voluntary work are growing.14 Increasing numbers of Chinese youth want to make a contribution to society.其他15 Of all other things they spend their wages on, the most important were phone calls (40%), followed closely by clothes and makeup (35%)and going out (15%).16 In 1995 there were only two or three computers in per hundred families.17 In the past, one in three families could afford to buy houses, while now 70% of them have their own flat. 调査18 On 8th November 2004, a survey was conducted among 400 Chinese students at different universities in Auckland.19 The purpose of the survey was to discover what the students do in their free time, after school.20 The survey was conducted by means of a questionnaire given to the students to complete・附:分数表示法3/4 three fourths 或three quarters1/3 one third 或a third1/2 a half。
如何描写图表作文
1认真读图,不要缺失任何一个部分。
图表作文总的来说是结合说明和表达观点的文章,所以首先就要审好题,无论是以什么形式展现出来的图表作文,我们首先都要看清楚说的内容以及它的数据,分析它要我们写什么。
2三段论——第一段(描述段):
考试的作文三段论通常是跑不掉的,见到英语考试有图表作文不要慌。
我们还是把作文分为三部分,第一段对图表来一个总体的描述,简单概括一下图表的内容,基本就不会有什么岔子了。
3三段论——第二段(分析段):
分析图表内容,这一段就不是概括那么简单了,我们要横向地、纵向地对图表进行分析,特别是数据的最大值、最小值等等,通常图表作文都会有一个主题,我们分析之余要往这个方向靠。
不要罗列数字,要分析出规律。
4三段论——第三段(表达段):
这一段通常就文章的大意,或者顺着出题者的意思去进行一个“自己的意见”补充,也就是对这个现象或者是情况作出一种总结和评论。
这一点大家写作文通常都会有,就不用太担心了。
5检查与修改:
写完一篇作文后,如果有时间,尽量去检查一下单词有没有错误,因为图表作文通常都要用到一些平时不常用的短语,注意看看有没有对图的描述还有没有其他的遗漏,如果有尽量作出一点补充。
图表作文写作攻略及必背模板句型1.写作攻略图表作文是英语写作中较为常见的题型之一,也是难度较大的一种写作题型。
写作考试时,这类作文一般也以三段式写作方法来组织文章,第一段总结归纳信息反映的整体情况,点出主题思想,第二段回答第一段所得出的问题,对数字、数据等做出有条理的分析比较,第三段做出总结或给以简单的评论。
表格和图表题型写作要点:(1)图表作文一般采用的时态为一般现在时,但如果图表中给出了具体时间参照,考生则应对时态进行相应的调整。
(2)图表作文有一些固定句型和表达法,考生应对此融会贯通。
(3)图表作文可以细分为表格,曲线图、柱形图和饼形图。
除了上述共同要点,考生还应了解这四种图在写作方面的不同特点。
⏹表格(table)可以表示多种事物的相互关系,所以考生要对表格中所给出的大量数字进行比较分析,从中找出其变化规律。
⏹曲线图(diagram)常表示事物的变化趋势,考生应认真观察坐标系所显示的数据信息,并且密切注意交汇在坐标横轴和纵轴上的数字及单位。
⏹柱形图(bar chart)用来表示各种事物的变化情况及相互关系,要求考生通过宽度相等的柱形的高度或长度差别来判断事物的动态发展趋势,因此考生应密切关注坐标线上的刻度单位及图表旁边的提示说明与文字。
考生应清楚掌握部分与整体,部分与部分之间的相互关系,这种关系通常是以百分比的数字形式给出的。
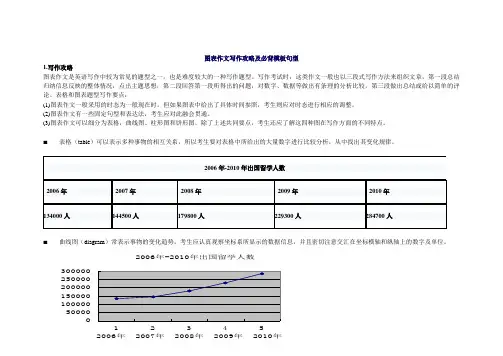
2006-2010年出国留学总人数:687600人从表格/图表中我们可以看到……The table shows a three times increase over that of last year. 表格显示比去年上升了3倍。
According to /As is shown in the table / diagram/chart...如表格/图表中显示……The number is 5 times as much as that of...此数字是……的5倍。
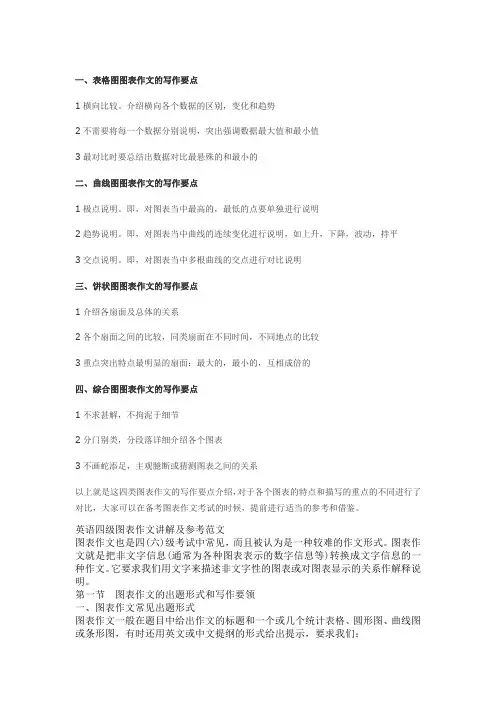
一、表格图图表作文的写作要点1横向比较。
介绍横向各个数据的区别,变化和趋势2不需要将每一个数据分别说明,突出强调数据最大值和最小值3最对比时要总结出数据对比最悬殊的和最小的二、曲线图图表作文的写作要点1极点说明。
即,对图表当中最高的,最低的点要单独进行说明2趋势说明。
即,对图表当中曲线的连续变化进行说明,如上升,下降,波动,持平3交点说明。
即,对图表当中多根曲线的交点进行对比说明三、饼状图图表作文的写作要点1介绍各扇面及总体的关系2各个扇面之间的比较,同类扇面在不同时间,不同地点的比较3重点突出特点最明显的扇面:最大的,最小的,互相成倍的四、综合图图表作文的写作要点1不求甚解,不拘泥于细节2分门别类,分段落详细介绍各个图表3不画蛇添足,主观臆断或猜测图表之间的关系以上就是这四类图表作文的写作要点介绍,对于各个图表的特点和描写的重点的不同进行了对比,大家可以在备考图表作文考试的时候,提前进行适当的参考和借鉴。
英语四级图表作文讲解及参考范文图表作文也是四(六)级考试中常见,而且被认为是一种较难的作文形式。
图表作文就是把非文字信息(通常为各种图表表示的数字信息等)转换成文字信息的一种作文。
它要求我们用文字来描述非文字性的图表或对图表显示的关系作解释说明。
第一节图表作文的出题形式和写作要领一、图表作文常见出题形式图表作文一般在题目中给出作文的标题和一个或几个统计表格、圆形图、曲线图或条形图,有时还用英文或中文提纲的形式给出提示,要求我们:1)用文字描述图表,客观解释图表中所传递的信息,并找出某种规律或趋势; 2)就图表中所反映的某种趋势或问题分析其原因或后果。
图表作文着重说明事实,常常是通过对图表中所反映的具体数据的说明、分析、比较,对某种事物或现象的事实或变化情况等加以说明,并提出结论或看法。
因此,图表作文常常采用议论文体的写作方法。
写好图表作文,关键在于能否读懂图表中所提供的信息,把握各信息间的联系,用准确流畅的语言把这一信息表达出来,并就这一信息发表自己的看法。

图表作文的写作要领(1) 观察图表,确定主题句观察图表是为了准确地理解图表所传递的信息。
观察图表首先要看清楚图表的文字说明,然后仔细研究图表以发现数据的主要特征和变化趋势,以此来确定主题句。
(2) 选择典型材料仔细观察表中数据的变化,并加以比较和归纳,选出差距变化最大、最有意义、最能说明主题的信息。
避免过分详细,逐一罗列。
换句话说,并不是图表中的任何一个数字都要进行描述。
(3) 分类确定全文的时态图表有两类,一类是有时间参照的,另一类是无时间参照的。
有时间参照的图表一般在描写时用现在时,有时间参照的可有两种情况:①如果参照的时间在过去就用一般过去时态。
②虽有过去时间参照,但叙述的是经常出现的情况,这种情况整篇文章总的时态仍用现在时态。
(4) 熟练掌握常用套句和短语由于图表包含丰富的信息和各种各样的数据,要清楚有效地把它们呈现出来并不是一件容易的事情,尤其是数据以及发展趋势的变化。
考生应该熟练掌握常用套句和短语。
如果考生能够熟练运用这些套句和短语,自然会信心倍增,对图表作文的恐惧也就消失了。
写作流程第一段:描述图表反映的总情况。
(用能充分说明主题的典型数据描述图表)第二段:分析原因。
(仔细分析比较数字,归纳出增减速率并找出产生变化的原因)第三段:结论。
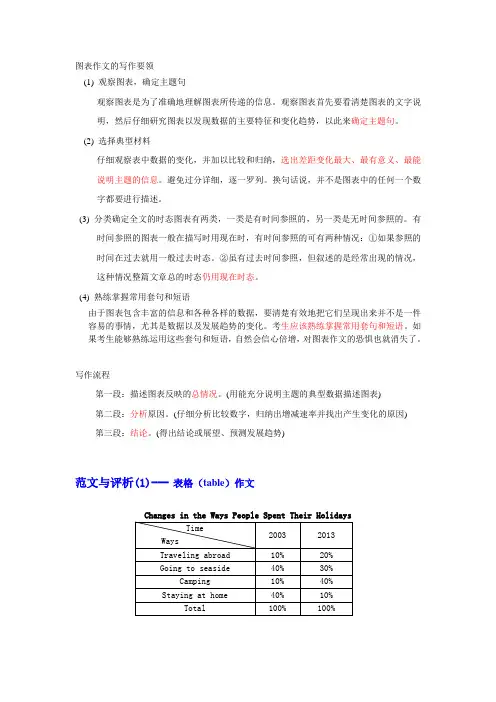
(得出结论或展望、预测发展趋势)范文与评析(1)---表格(table)作文Directions: You are required to write an essay with the topic “C hanges in the W ays P eople S pent T heir H oliday s. You should base your essay on the information from the table.Changes in the Ways People Spent Their Holidays From the table we could know that the ways people spent their holidays have changed greatly. In 2003, 40% people spent their holidays at home, but their number dropped to 10% in 2013. It was no doubt that people were becoming more and more mobile, and they wanted to get entertainment outside their homes.Seaside still had its attraction to people, though its rate dropped slightly from 40% in 2003 to 30% in 2013, and there might be a further decrease in the future because of the marine pollution. The table shows that a great number of people spent their holidays traveling abroad. The rate in 2013 doubled as compared with 2003. With the increase of their income, more and more people could afford their holidays abroad.The table also indicates another tendency: the rate of camping was rising from 10% in 2003 to 40% in 2013. The reason may be that the real beauty of nature was being rediscovered, and people were getting more and more interested in natural scenery. Based on the above analysis we could draw the conclusion that great changes have taken place in the ways people spent their holidays in the past ten years.范文与评析(2)--- 饼状图(pie chart)作文Popular Desserts in a University CafeteriaDirections: The above pie chart shows the percentage of popular desserts selected in a university cafeteria. Write an essay on the topic “Popular Desserts in a University Cafeteria”. You should base your essay on the information in the chart.Popular Desserts in a University CafeteriaThis pie chart shows the relative popularity of desserts served in a university cafeteria.I ce cream is the favorite among the dessert selections,accounting for 35% of all choices.Pie is the next most popular choice with 25%of all choices. These two items exceeded theremaining four selections in popularity. D oughnut is not so popular with only 10% of all choices, which is the same with pudding in popularity.The only natural fruit choice, the apple, is only a little more popular than the doughnut and is a selection of less than half of percentage in ice-cream.Fruit jelly was last in popularity among all choices.Even pudding proved to be twice as popular as fruit jelly. The relatively high popularity of ice cream and pie may be due in part to the fact that these desserts are not everyday diets in Chinese meals.Fruit jelly,apples, and doughnut are usually served at home.The relatively high standing of the apple in relation to pudding, doughnut,and fruit jelly may be due to parental or school training on nutrition.范文与评析(3)---线状图(line graph)作文Car Accidents in BeijingDirections: You are allowed 30 minutes to write an essay based on the graph. The suggested title is: Car Accidents Declining in Beijing. Remember that your essay must be written according to the following outline:1) Rise and fall of the rate of car accidents as indicated by the graph.2) Possible reason(s) for the decline of car accidents in the city.Car Accidents Declining in BeijingLast year, the rate of car accidents in Beijing reached the highest point 37 in August. After that the rate was steadily declining, and reached the lowest point 14 at the end of the year. The first three months of 2012 showed an increasing trend, and reached 30 in March, and then the rate declined to 26 in June. Then from June to August, the rate was rising from 24 to 37.The highest rate of 37 in August might be due to weather factors. Humidity and high temperature may make drivers become uncomfortable and impatient, which could easily lead to car accidents. The peak point in the first half of 2012 might be also caused by weather conditions. In Beijing, the excessive rain comes at early spring, which makes roads muddy and slippery, and these conditions may result in car accidents.This year the situation is expected to be changed. City government has raised money to improve the road conditions. Two new roads were built at the end of last year, and will soon open to cars. New road regulation stipulates that every car should be air-conditioned in summer. All these precautions account for car accidents declining in Beijing this year.范文与评析(4)---直方图(bar graph)作文Three Major Causes of Fire in ChinaHistogram 1Histogram 2Directions: The above diagram s show three major causes of fire in Guangzhou, these histograms indicate the numbers of fire and the extent of the damage involved, measured in terms of billions of Yuan. Study the two histograms above and draw whatever conclusion(s) you can. T he public interest may be one point to consider. Write an essay stating and supporting your conclusion(s).Three Major Causes of Fire in GuangzhouDespite of all the efforts that mankind has made over the years, fire continues to be a terrible killer in our modern society. From the two histograms above,which describe the leading causes of fires measured in both number of fires and total losses from thefires in Guangzhou, we could see that most fires are caused by smokers, defective insulation and children playing with matches.It is clearly shown in these two histograms that smokers were responsible for totally 10500 of the fires in the last two years, which caused about 5.5 billion Yuan worth of damage. Defective insulation caused more than 4500fires and children playing with matches led to about1000 fires. These results show that smok ers can be considered as the enemies of the whole society, especially when the public interest is taken into consideration.Comparing the figures of these two years, it will be safe to draw a conclusion that, although the number of fires in each category remained nearly the same, the fire losses caused by defective insulation were significantly lower than those in the previous year. O n the contrary, the fire losses in the case of children’s playing with matches were significantly higher than those in the previous year, even though there were fewer fires. T he average losses of a fire caused by smokers remained more or less the same, only showing a slightly increasing trend.Based on the brief analysis above, it can be concluded that, although smokers are the leading cause of fires, we still need to improve the insulation devices and educate our children on the dangers of playing with matches.常用表达句型:1)描述图标的句式(1) T he table shows the changes in the number of...over the period from...to...该表格描述了在...年到...年间...数量的变化。
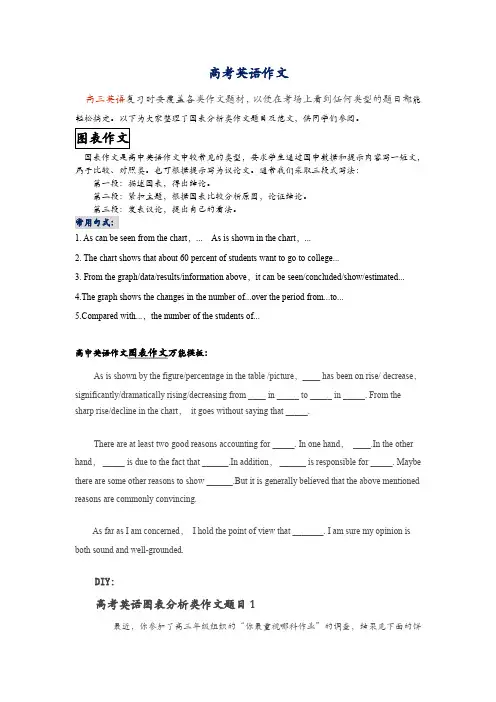
高考英语作文高三英语复习时要覆盖各类作文题材,以便在考场上看到任何类型的题目都能轻松搞定。
以下为大家整理了图表分析类作文题目及范文,供同学们参阅。
图表作文是高中英语作文中较常见的类型,要求学生通过图中数据和提示内容写一短文,属于比较、对照类。
也可根据提示写为议论文。
通常我们采取三段式写法:第一段:描述图表,得出结论。
第二段:紧扣主题,根据图表比较分析原因,论证结论。
第三段:发表议论,提出自己的看法。
常用句式:1. As can be seen from the chart,...As is shown in the chart,...2. The chart shows that about 60 percent of students want to go to college...3. From the graph/data/results/information above,it can be seen/concluded/show/estimated...4.The graph shows the changes in the number of...over the period from...to...pared with...,the number of the students of...高中英语作文图表作文万能模板:As is shown by the figure/percentage in the table /picture,____ has been on rise/ decrease,significantly/dramatically rising/decreasing from ____ in _____ to _____ in _____. From the sharp rise/decline in the chart,it goes without saying that _____.There are at least two good reasons accounting for _____. In one hand,____.In the other hand,_____ is due to the fact that ______.In addition,______ is responsible for _____. Maybe there are some other reasons to show ______.But it is generally believed that the above mentioned reasons are commonly convincing.As far as I am concerned,I hold the point of view that _______. I am sure my opinion is both sound and well-grounded.DIY:高考英语图表分析类作文题目1最近,你参加了高三年级组织的“你最重视哪科作业”的调查,结果见下面的饼状图。
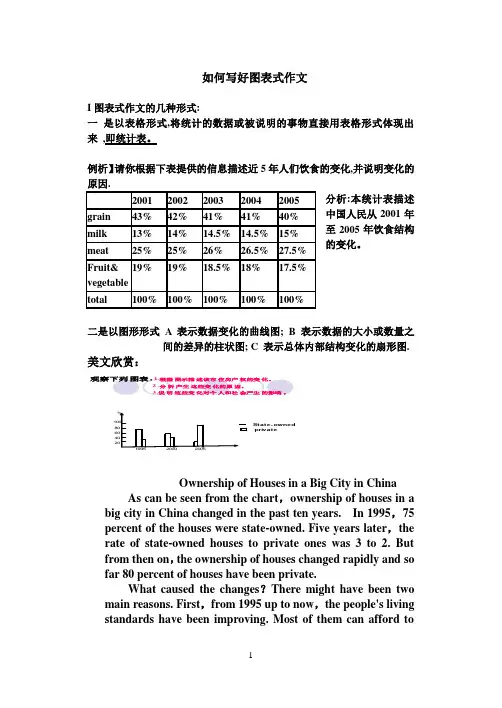
如何写好图表式作文I图表式作文的几种形式:一是以表格形式,将统计的数据或被说明的事物直接用表格形式体现出来,即统计表。
例析】请你根据下表提供的信息描述近5年人们饮食的变化,并说明变化的原因.中国人民从2001年至2005年饮食结构的变化。
二是以图形形式 A 表示数据变化的曲线图; B 表示数据的大小或数量之间的差异的柱状图; C 表示总体内部结构变化的扇形图.美文欣赏:Ownership of Houses in a Big City in China As can be seen from the chart,ownership of houses in a big city in China changed in the past ten years. In 1995,75 percent of the houses were state-owned. Five years later,the rate of state-owned houses to private ones was 3 to 2. But from then on,the ownership of houses changed rapidly and so far 80 percent of houses have been private.What caused the changes?There might have been two main reasons. First,from 1995 up to now,the people's livingstandards have been improving. Most of them can afford tobuy the houses. Second,most people do not save a lot of money in the bank for their children as their parents did in the past. They want to have their own home and enjoy life.Such changes have had a great effect on the development of society. It does good to both the citizens and the government.Good points1.structure第一段:描述图表,得出结论。
图表作文写作指南写作指南:图表作文图表作文是在文章中使用图表来解释、分析和说明数据,以更清晰地展示信息和结论。
在写作这类作文时,有一些关键点和步骤可以帮助你组织思路并有效地传达你要表达的信息。
以下是图表作文的写作指南,包括准备、写作和审查阶段,每个阶段涉及的关键点和步骤:准备阶段:1. 仔细阅读题目和图表:仔细理解题目并观察图表的数据,包括数据类型、时间范围和单位等。
2. 理解图表的主要内容:图表通常包含主要趋势、变化和关系。
注意图表中的最大值、最小值和重要变化点。
3. 组织信息:将图表中的数据和趋势进行分类和排序,找到其中的相关性和区别。
写作阶段:1. 引言:简要描述图表的主题,并指出你要解释或分析的主要趋势和变化。
这是给读者提供全局视图的一部分。
2. 主体段落:根据图表中的数据、趋势和关系,组织你的主要观点和论据。
每个主体段落都应该专注于一个特定的方面或变化。
a. 描述数据和趋势:使用清晰的语言描述图表中的数据和趋势。
强调重要数字和变化点。
b. 分析原因和结果:解释导致数据和趋势的可能原因,并分析可能的结果和影响。
c. 进行比较和对比:将不同的数据进行比较和对比,强调相似之处和差异。
d. 用例子和证据支持观点:用例子、事实和数据支持你的观点和结论。
e. 使用合适的连接词:使用适当的连接词和短语,如"moreover"、"in addition to"、"on the other hand" 等,使你的论述连贯流畅。
3. 结论:总结你的观点和结论,强调图表中的关键变化和趋势。
对图表可能的局限性进行讨论,提出可能的解决方案或预测。
审查阶段:1. 检查语法和拼写错误:审查你的文章,确保没有语法和拼写错误。
这可以通过使用语法和拼写检查工具来帮助你。
2. 检查数据和数字:确认你引用的数据和数字准确无误。
如果可能,可以重新计算或交叉验证数据。
3. 重新检查结构和逻辑:再次检查你的段落结构和论证的逻辑性。
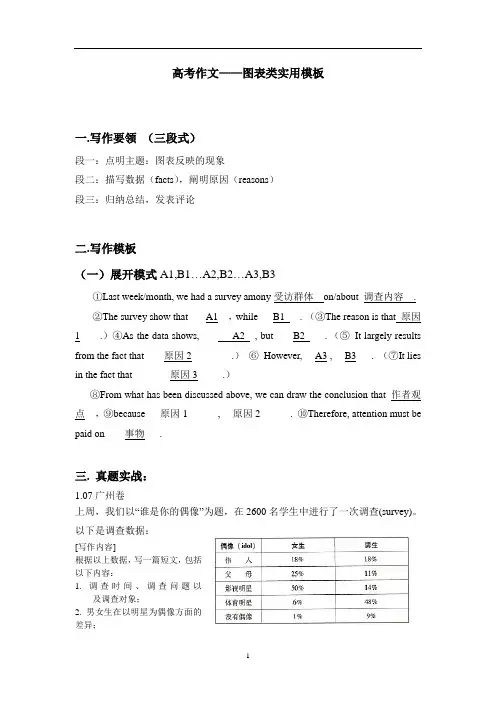
高考作文——图表类实用模板一.写作要领(三段式)段一:点明主题:图表反映的现象段二:描写数据(facts),阐明原因(reasons)段三:归纳总结,发表评论二.写作模板(一)展开模式A1,B1…A2,B2…A3,B3①Last week/month, we had a survey amony受访群体on/about 调查内容.②The survey show that ___A1__,while___B1___.(③The reason is that 原因1____.)④As the data shows, ______A2__, but____B2____.(⑤It largely results from the fact that____原因2________.)⑥However, __A3 , __B3___.(⑦It lies in the fact that____ ___原因3_____.)⑧From what has been discussed above, we can draw the conclusion that_作者观点__,⑨because___原因1______, __原因2______.⑩Therefore, attention must be paid on____事物___.三. 真题实战:1.07广州卷上周,我们以“谁是你的偶像”为题,在2600名学生中进行了一次调查(survey)。
以下是调查数据:[写作内容]根据以上数据,写一篇短文,包括以下内容:1. 调查时间、调查问题以及调查对象;2. 男女生在以明星为偶像方面的差异;3. “父母”在男女生偶像中的排序差异;4. 男女生在以伟人为偶像方面的异同;5. 你的偶像及理由。
[写作要求]1.只能使用5个句子表达全部内容;2.文中不能出现真实姓名和学校名称。
[评分标准]句子结构准确,信息内容完整,篇章结构连贯。
《图表作文》写作指导中考中的图表作文一般有以下三类。
一、看图作文【命题形式】看图作文一般要求学生根据所给出的一幅图或几幅图所提供的信息写一篇短文。
在命题形式上,除了图的提示外,一般有英文单词提示或中文文字提示。
有的文章开头已给出。
要求书写的词数一般在80至100之间。
【写作技巧】1.审题要清。
看清题目要求,读懂画面内容和所陈述的含义,抓住要点,注意文体是什么,如果是故事或日记,宜用过去时态;如果介绍物品之类的,多采用现在时态。
2.逐图列提纲。
看图作文所提供的材料是一幅或几幅图。
做题时,可逐图列好提纲,并运用所提供的词语。
根据图示情景并结合自己的英语水平,尽量扬长避短,避繁化简。
遇到一时想不起来的词、句时,可用同义词或同义句代替。
3.连句成文。
就是把第二步所写的句子,在规定的范围内稍加发挥,适当用上连词把它们串联起来整理成一篇短文。
连句成文时应注意文中动词时态的应用,简单句和复合句的交替应用。
4.复核检查。
按要求逐图写好句子后,认真通读写好的句子,一查所写句子是否准确表达出了所给图画的情景,行文是否流畅;二查有没有遗漏要求,句子的时态、语态是否正确,所写句子是否符合英语的基本语序,即:主语+谓语+宾语十状语(地点、时间等);三查单词的拼写、大小写是否规范,标点符号的运用是否正确,主谓语是否一致。
确定无误后,再誊写正稿。
【经典试题】(2017年湖州卷)英语课上,老师组织大家就以下两幅图进行“To change or not"的话题讨论。
请用英语阐述你对此话题的看法。
注意:(1)短文可结合图片信息或自身经历,作适当发挥;(2)文中不得出现真实的姓名和校名;(3)词数:80~100,短文首句仅供选择使用,不计入总词数。
短文首句:Last week, we had a discussion about the topic "To change or not".【审题指导】1.因为短文首句已给出,所以我们可以接着引出下文。
图表作文写作攻略对于线性图表的描述上升1.对于上升趋势的描述:a.可以使用的动词或动词词组:to increaseto go upto riseto growto jumpto leapto soarto shootto pick upb.可以使用的名词:an increasea growtha jumpa soar an upward trend2.对于上升到某个位置的描述:a.l.a.中的动词+to+具体数据。
b.1. a.中的动词+to+the peak of4-具体数据。
c.l.a.中的动词+reaching the peak of + 具体数据。
d.1. a.中的动词+ reaching +具体数据。
e.to peak at +具体数据f.to climb to +具体数据3.对于上升的程度的描述:a.l.a.中的动词+ by +具体数据。
b.l.a.中的动词+副词。
:1.先上升后下降的句型:............ increased slowly during ........ and ............ but fell sharply in ........ 。
A steady fall in ......... during .......... a nd .......... followed the sharp increase in ......... 。
2.先下降后上升的句型:...... fell before .......... began to make a recovery ................. continue the recovery, climbing to ..................... dropped during .......... but increased again in ................. fell and then pick up during ................. collapsed before rising to ........... a t the end of .........3.起伏波动的句型:...... fluctuated sharply all through ...........4.波动不大的句型:.hardly changed through the period between and 柱状图形的描述转换为线形图形的描述饼状图形的描述对于百分比进行描述所使用的句型:%the...... is/has/have/are ...... ...................... a ccounts for % ofthe total ....................... t akes up .......... % in the whole chart趋势的比较1.表示相似的句型:Both share prices rose sharply in January.Neither company has made a profit yet.Like X, Y fell in June.X rose just as sharply as Y.2.表不差异的句型:X fell sharply whereas/while Y remained steady.X fell quickly compared to Y.Unlike Y, X rose by 10%.X rose far more dramatically than Y.3.表示倍数的句型:the .......... doubled/tripled in ......... compared with those in .......4.客观比较的句型:...... i s .......... i n contrast to .........数据的修饰1.表示不足的词或词组:up tobelowunderalmostnearly2.表示超过的词或词组:overmore thanjust over3.表示大约的词:about补充一点点:一。
主章开头图表类型:table; chart; diagram; graph; column chart; pie graph描述:show; describe; illustrate; can be seen from;clear; apparent; reveal ; represent内容: figure ;statistic ;number ;percentage ;proportion二。
表示数据一般:have 10%; at 10%; over 10%最高点:peaked ;reached a peak/highbottomed out; reached the bottom变化:recover 略有回升;increase;jump;rise/rose;climbdecrease; fall/fell; drop; decline; reduce fluctuate浮动,摇摆不定remained steady/stable; stay the same; little/hardly any /no change变化程度:sudden/suddenly突然的,意外的rapid/rapidly迅速的,飞快的,险峻的dramatic/dramatically 戏剧性的,生动的significant/significantly有意义的,重大的,重要的sharp/sharply锐利的,明显的,急剧的steep/steeply急剧升降的steady/steadily稳固的,坚定不移的gradual/gradually渐进的,逐渐的slow/slowly缓慢的,不活跃的slight/slightly轻微的、略微地stable/stably 稳定的表示范围:from...to... between...and... fbr ...to ・••多长时间直到表示程度:almost adv.几乎,差不多nearly adv.几乎,密切地approximately adv.近似的,大约about adv.附近,大约,转向,左右,周围just over刚超过over adv.结束,越过,从头到尾exactly adv.正确地,严密地precisely adv.正好精确地;清晰地比例:20 per cent 20%one in three 1/3one out of every four 1/4三常用词significant changes图中一些较大变化noticeable trend 明显趋势during the same period 在同一日寸期grow/grew 增长distribute分布,区别unequally不相等地pronounced 明显的average 平均no doubt无疑地corresponding adj.相应的,通讯的represent vt.阐述,表现overall总体上讲except除外in the case of adv.在…的情况下in contrast相反,大不相同in conclusion adv. 最后,总之in comparison相比之下inversely adv.相反地,倒转地in general通常,大体上,一般而言rang fromexcessive adj.过多的,过分的,额外lower v.降低,跌落elapse vi.过去,消逝category n.种类government policy 政府政策market forces市场规率measure n.尺寸,方法,措施v.估量,调节forecast n.先见,预见v.预测1 .有用的词上升:increase rise ascend core surge go up climb mount level up下降: decrease fall drop descend decline reduce lessen level down平稳:stable steady remain/maintain/keep/be the same as/similar to波动:fluctuate fluctuation rise and falls up and down占:occupy take up account for gain而: while however whereas on the other hand actually/in fact相比:by contract on the contrary likewise compared with最高点:the highest the top the summit the peak the most最彳氐点:bottom less least rock bottom平均:mean average趋势:tendency trend inclination预见:prediction达到顶峰:mount to在 *** 中占***:* * *gain the percentage of有一个稳定的过程:a stable period can be seen原则:A.不可能写的很好,关键是要很稳地写清楚。
B.概括一些内在关联性或原因推测作为总结。