中国人寿2020年三季度财务指标报告
- 格式:rtf
- 大小:94.99 KB
- 文档页数:3
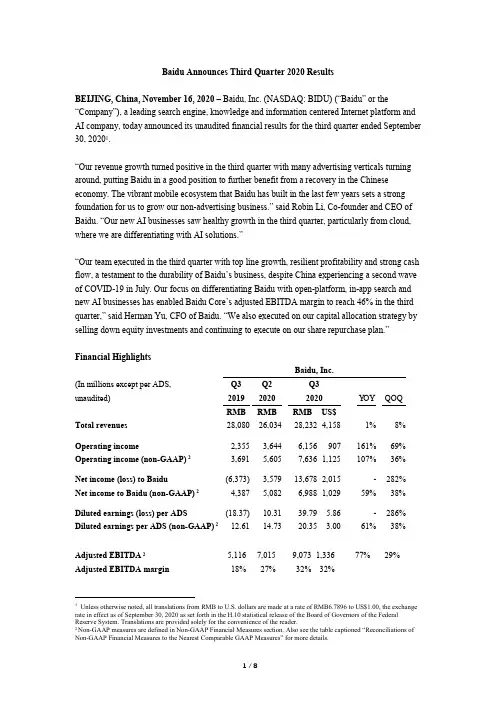
Baidu Announces Third Quarter 2020 ResultsBEIJING, China, November 16, 2020– Baidu, I nc. (NASDAQ: BIDU) (“Baidu” or the “Company”), a leading search engine, knowledge and information centered Internet platform and AI company, today announced its unaudited financial results for the third quarter ended September 30, 20201.“Our revenue growth turned positive in the third quarter with many advertising verticals turning around, putting Baidu in a good position to further benefit from a recovery in the Chinese economy. The vibrant mobile ecosystem that Baidu has built in the last few years sets a strong foundation for us to grow our non-advertising business.” said Robin Li, Co-founder and CEO of Baidu. “Our new AI businesses saw healthy growth in the third quarter, particularly from cloud, where we are differentiating with AI solutions.”“Our team executed in the third quarter with top line growth, resilient profitability and strong cash flow, a testament to the durability of Baidu’s business, despite China experiencing a second wave of COVID-19 in July. Our focus on differentiating Baidu with open-platform, in-app search and new AI businesses has enabled Bai du Core’s adjusted EBITDA margin to reach 46% in the third quarter,” said Herman Yu, CFO of Baidu. “We also executed on our capital allocation strategy by selling down equity investments and continuing to execute on our share repurchase plan.”Financial HighlightsBaidu, Inc.(In millions except per ADS, Q3 Q2 Q3unaudited)2019 2020 2020YOY QOQRMB RMB RMB US$Total revenues 28,080 26,034 28,232 4,158 1% 8%Operating income 2,355 3,644 6,156 907 161% 69% Operating income (non-GAAP) 23,691 5,605 7,636 1,125 107% 36%Net income (loss) to Baidu (6,373) 3,579 13,678 2,015 - 282% Net income to Baidu (non-GAAP) 24,387 5,082 6,988 1,029 59% 38%Diluted earnings (loss) per ADS (18.37) 10.31 39.79 5.86 - 286% Diluted earnings per ADS (non-GAAP) 212.61 14.73 20.35 3.00 61% 38%Adjusted EBITDA 25,116 7,015 9,073 1,336 77% 29% Adjusted EBITDA margin 18% 27% 32% 32%1Unless otherwise noted, all translations from RMB to U.S. dollars are made at a rate of RMB6.7896 to US$1.00, the exchange rate in effect as of September 30, 2020 as set forth in the H.10 statistical release of the Board of Governors of the Federal Reserve System. Translations are provided solely for the convenience of the reader.2 Non-GAAP measures are defined in Non-GAAP Financial Measures section. Also see the table captioned “Reconciliations of Non-GAAP Financial Measures to the Nearest Comparable GAAP Measures” for more details.Baidu CoreQ3 Q2 Q3(In millions, unaudited)2019 2020 2020YOY QOQRMB RMB RMB US$Total revenues 21,010 18,926 21,379 3,149 2% 13%Operating income 5,191 4,966 7,404 1,090 43% 49% Operating income (non-GAAP) 26,224 6,482 8,505 1,253 37% 31%Net income (loss) to Baidu Core (4,287) 4,424 14,368 2,116 - 225% Net income to Baidu Core (non-GAAP) 26,310 5,656 7,486 1,103 19% 32%Adjusted EBITDA27,525 7,771 9,822 1,447 31% 26% Adjusted EBITDA margin 36% 41% 46% 46%Other HighlightsCorporate•Baidu received an ESG rating of BB from MSCI and an ESG risk score of 21.5 from Sustainalytics, reflecting the progress the Company has made through ESG policy changes and improved disclosure on corporate governance.•Baidu World was held virtually in September 2020 in partnership with CCTV, reaching an audience of over 60 million. This year’s theme centered on the “Intelligence of Everything,”highlighting how Baidu AI products and solutions can improve everyday life and empower enterprises and the public sector to do more and do better in the areas of cloud computing, smart transportation and autonomous driving.•Baidu entered into definitive agreements to raise financing for its Smart Living Group (“SLG”) at a post-money valuation of approximately RMB 20 billion, or US$2.9 billion, in September 2020. The transaction is expected to be completed in the fourth quarter of 2020, and Baidu is expected to be a super majority shareholder.•Baidu completed a bond offering of US$950 million in October 2020, consisting of US$650 million of 1.720% notes due 2026 and US$300 million of 2.375% notes due 2030, theproceeds from which are expected to be used to repay certain existing indebtedness. •Baidu returned US$596 million to shareholders in the third quarter of 2020, bringing the cumulative share repurchase over the last two years to approximately US$2.0 billion.Mobile Ecosystem•Baidu App’s daily active users (“DAUs”) reach ed 206 million and its monthly active users (“MAUs”) reached 544 million in September 2020.•The massive reach of Baidu App, along with other products in the Company’s product portfolio, is attracting a wide range of knowledge and information-centric videos, including live and short videos. Topical live streaming, such as Wander Planet and Who to Support, grew eight folds sequentially.•Publishers are sharing more originals on Baijiahao (“BJH”) accounts, to take advantage of Baidu’s large scale and easy sharing of content across Baidu family of apps. BJH accounts reached 3.6 million, up 52% year over year, in September 2020.•App developers are adopting Baidu Smart Mini Programs (“SMP s”) to provide users with native-app like experience on Baidu, without having to download the host apps. The number of SMPs grew three folds, and SMP monthly active users on Baidu App reached 355 million, up 22% year over year, in September 2020.•Site merchants are switching to Managed Page as the landing page for their search results to improve marketing effectiveness, resulting in Managed Page revenue reaching almost 1/3 of Baidu Core’s online marketing services revenue in the third quarter of 2020.DuerOS•DuerOS first-party monthly voice queries reached 2.7 billion, up 65% from last year, and DuerOS total monthly voice queries reached 5.3 billion in September 2020.•Xiaodu Smart Display ranked #1 in smart display shipments globally, and Xiaodu smart speakers ranked #1 in smart speaker shipments in China for the second quarter of 2020,according to market research firms IDC, Strategy Analytics and Canalys.•The DuerOS skills store, offering 4,300 skills in wide ranging genres, including education, video, online game and live streaming, is supported by a developer community of 45,000. •Xiaodu Smart Earphones was introduced in September 2020, allowing users to navigate DuerOS skills using its voice assistant and hear instant language translation. Xiaodu Smart Earphones broaden the use case of the Xiaodu voice assistant from home, auto and hotel to anywhere with mobile.Cloud, AI Services & AI Platform•Baidu partners with Postal Savings Bank of China (“PSBC”), a top consumer bank in China with 40,000 branches nationwide, to provide Baidu AI PaaS, which can be trained to provide better credit risk management by leveraging Baidu’s advanced AI capabilities, such as big data and natural language processing.•Baidu partners with the Economic and Technological Development Zone in Guiyang,a major national data center hub in China,to provide its AI PaaS platform that will be made available to the 400+ enterprises across 10 industries located in the economic development zone.Baidu’s AI PaaS can help businesses improve their operations and do more through advanced AI, including deep learning, blockchain and computer vision,•Baidu’s AI open platform built on Baidu Cloud offers over 270 AI capabilities, attracting a developer community of over 2 million.•Baidu Translate, an AI cloud service leveraging Baidu’s advanced natural language processing, speech and vision processing technologies, supports over 200 languages andprocesses over 100 billion bites a day, attracting a developer community of 400,000.Apollo•Baidu partners with the city of Guangzhou, Guangdong to provide smart transportation solutions to improve traffic efficiency, air pollution and road safety.•Apollo Go robotaxi is now opened to the public in Beijing, becoming the third city following Changsha, Hunan and Cangzhou, Hebei. Apollo Go rides may be ordered from Baidu Maps or Apollo Go app.•Baidu was granted China’s first driverless test permit in Changsha.iQIYI•iQIYI subscribers reached 104.8 million in September 2020, and membership revenue was up 7% y ear over year. iQIYI’s large subscriber base further strengthens iQIYI’s foundation to produce entertainment blockbuster originals.Third Quarter 2020 ResultsTotal revenues reached RMB 28.2 billion ($4.16 billion), increasing 1% year over year.Revenue from Baidu Core reached RMB 21.4 billion ($3.15 billion), increasing 2% year over year. Online marketing revenue from Baidu Core was RMB 18.4 billion ($2.72 billion), which was basically flat from last year. Non-online marketing revenue from Baidu Core reached 2.9 billion ($434 million), increasing 14% year over year, primarily driven by the growth of cloud services.Cost of revenues was RMB 12.8 billion ($1.89 billion), decreasing 22% year over year, primarily due to a decrease in content costs, traffic acquisition costs and costs of goods sold.Selling, general and administrative expenses were RMB 4.7 billion ($692 million), increasing 1% year over year.Research and development expenses were RMB 4.6 billion ($673 million), decreasing 3% year over year.Operating income was RMB 6.2 billion ($907 million) and operating margin was 22%. Baidu Core operating income was RMB 7.4 billion ($1.09 billion) and Baidu Core operating margin was 35%.Non-GAAP operating income was RMB 7.6 billion ($1.13 billion), and non-GAAP operating margin was 27%. Non-GAAP Baidu Core operating income was RMB 8.5 billion ($1.25 billion), and non-GAAP Baidu Core operating margin was 40%.Total other income was RMB 8.9 billion ($1.31 billion), compared to total other loss of RMB 9.5 billion in Q3 2019. Total other income in Q3 2020 included fair value gain of RMB 9.0 billion from long-term investments.Income tax expense was RMB 1.6 billion ($239 million), compared to RMB 934 million in Q3 2019.Net income attributable to Baidu was RMB 13.7 billion ($2.02 billion), and diluted earnings per ADS was RMB 39.79 ($5.86). Net income attributable to Baidu Core was RMB 14.4 billion ($2.12 billion).Non-GAAP net income attributable to Baidu was RMB 7.0 billion ($1.03 billion), and non-GAAP net margin was 25%. Non-GAAP diluted earnings per ADS amounted to RMB 20.35 ($3.00). Non-GAAP net income attributable to Baidu Core was RMB 7.5 billion ($1.10 billion), and non-GAAP net margin for Baidu Core was 35%.Adjusted EBITDA was RMB 9.1 billion ($1.34 billion) and adjusted EBITDA margin was 32%. Adjusted EBITDA for Baidu Core was RMB 9.8 billion ($1.45 billion) and adjusted EBITDA margin for Baidu Core was 46%.As of September 30, 2020, cash, cash equivalents, restricted cash and short-term investments were RMB 146.0 billion ($21.50 billion), and cash, cash equivalents, restricted cash and short-term investments excluding iQIYI were RMB 138.5 billion ($20.41 billion). Free cash flow was RMB 6.3 billion ($925 million), and free cash flow excluding iQIYI was RMB 8.3 billion ($1.22 billion).For more information on the adoption of ASU 2019-02 beginning January 1, 2020, in accordance with the new accounting standard, please see explanation under “Non-GAAP Financial Measures”.Financial GuidanceFor the fourth quarter of 2020, Baidu expects revenues to be between RMB 28.6 billion ($4.2 billion) and RMB 31.3 billion ($4.6 billion), representing a growth rate of -1% to 8% year over year, which assumes that Baidu Core revenue will grow between -1% and 10% year over year.The above forecast reflects Baidu’s current and preliminary view, which is subject to substantial uncertainty.Conference Call InformationBaidu's management will hold an earnings conference call at 8:15 PM on November 16, 2020, U.S. Eastern Time (9:15 AM on November 17, 2020, Beijing Time).Please register in advance of the conference call using the link provided below. Upon registering, you will be provided with participant dial-in numbers, Direct Event passcode and unique registrant ID by email.For pre-registration, please click /registration/event/2876397. It will automatically direct you to the registration page of "Baidu Q3 2020 Earnings Conference Call", where you may fill in your details for RSVP. If it requires you to enter a participant conference ID, please enter "2876397".In the 10 minutes prior to the call start time, you may use the conference access information (including dial-in number(s), Direct Event passcode and unique registrant ID) provided in the confirmation email that you have received following your pre-registration.Additionally, a live and archived webcast of this conference call will be availableat .A replay of the conference call may be accessed by phone at the following number until November 24, 2020:International: +61 2 8199 0299Passcode: 2876397About BaiduBaidu, Inc. is a leading search engine, knowledge and information centered Internet platform and AI company. The Company’s mission is to make the complicated world simpler through technology. Baidu's ADSs trade on the NASDAQ Global Select Market under the symbol "BIDU". Currently, ten ADSs represent one Class A ordinary share.ContactsInvestors Relations, Baidu, Inc.Tel: +86-10-5992-8888Email:ir@Safe Harbor StatementThis announcement contains forward-looking statements. These statements are made under the "safe harbor" provisions of the U.S. Private Securities Litigation Reform Act of 1995. These forward-looking statements can be identified by terminology such as "will," "expects," "anticipates," "future," "intends," "plans," "believes," "estimates," "confident" and similar statements. Among other things, the outlook for the fourth quarter of 2020, quotations from management in this announcement, as well as Baidu's and other parties' strategic and operational plans, contain forward-looking statements. Baidu may also make written or oral forward-looking statements in its periodic reports to the U.S. Securities and Exchange Commission, in its annual report to shareholders, in press releases and other written materials and in oral statements made by its officers, directors or employees to third parties. Statements that are not historical facts, including but not limited to statements about Baidu's beliefs and expectations, are forward-looking statements. Forward-looking statements involve inherent risks and uncertainties. A number offactors could cause actual results to differ materially from those contained in any forward-looking statement, including but not limited to the following: Baidu’s growth strategies; its future business development, including development of new products and services; its ability to attract and retain users and customers; competition in the Chinese Internet search and newsfeed market; competition f or online marketing customers; changes in the Company’s revenues and certain cost or expense items as a percentage of its revenues; the outcome of ongoing, or any future, litigation or arbitration, including those relating to intellectual property rights; the expected growth of the Chinese-language Internet search and newsfeed market and the number of Internet and broadband users in China; Chinese governmental policies relating to the Internet and Internet search providers, and general economic conditions in China and elsewhere. Further information regarding these and other risks is included in the Company’s annual report on Form 20-F and other documents filed with the Securities and Exchange Commission. Baidu does not undertake any obligation to update any forward-looking statement, except as required under applicable law. All information provided in this press release and in the attachments is as of the date of the press release, and Baidu undertakes no duty to update such information, except as required under applicable law.Non-GAAP Financial MeasuresTo supplement Baidu’s consolidated financial results presented in accordance with GAAP, Baidu uses the following non-GAAP financial measures: non-GAAP operating income (loss), non-GAAP operating margin, non-GAAP net income (loss) attributable to Baidu, non-GAAP net margin, non-GAAP diluted earnings per ADS, adjusted EBITDA, adjusted EBITDA margin and free cash flow. The presentation of these non-GAAP financial measures is not intended to be considered in isolation or as a substitute for the financial information prepared and presented in accordance with GAAP.Baidu believes that these non-GAAP financial measures provide meaningful supplemental information regarding its performance and liquidity by excluding certain items that may not be indicative of its recurring core business operating results, such as operating performance excluding not only non-cash charges, but also other items that are infrequent or unusual in nature. The Company believes that both management and investors benefit from referring to these non-GAAP financial measures in assessing its performance and when planning and forecasting future periods. These non-GAAP financial measures also facilitate management’s internal comparisons to Baidu’s h istorical performance and liquidity. The Company believes these non-GAAP financial measures are useful to investors in allowing for greater transparency with respect to supplemental information used by management in its financial and operational decision making. A limitation of using these non-GAAP financial measures is that these non-GAAP measures exclude certain items that have been and will continue to be for the foreseeable future a significant component in the Company’s results of operations. These non-GAAP financial measures presented here may not be comparable to similarly titled measures presented by other companies. Other companies may calculate similarly titled measures differently, limiting their usefulness as comparative measures to the Company’s data.Non-GAAP operating income represents operating income excluding share-based compensation expenses and amortization and impairment of intangible assets resulting from business combinations.Non-GAAP net income attributable to Baidu represents net income attributable to Baidu excluding share-based compensation expenses, amortization and impairment of intangible assets resulting from business combinations, disposal gain or loss, impairment of long-term investments, fair value change of long-term inv estments, adjusted for related income tax effects. Baidu’s share of equity method investments for these non-GAAP reconciling items, amortization and impairment of intangible assets not on the investees’ books, accretion of their redeemable non-controlling interests, and the gain or loss associated with the issuance of shares by the investees at a price higher or lower than the carrying value per shares, adjusted for related income tax effects, are also excluded.Non-GAAP diluted earnings per ADS represents diluted earnings per ADS calculated by dividing non-GAAP net income attributable to Baidu, which is adjusted for accretion for the redeemable non-controlling interests, by the weighted average number of ordinary shares expressed in ADS. Adjusted EBITDA represents operating income excluding depreciation, amortization and impairment of intangible assets resulting from business combinations, and share-based compensation expenses.Free cash flow represents net cash provided by operating activities less capital expenditures. Starting from January 1, 2020, Baidu adopted ASU 2019-02, Improvements to Accounting for Costs of Films and License Agreements for Program Materials, which reclassifies cash outflows for costs incurred to acquire licensed contents from investing activities to operating activities. To increase comparability, 2019 free cash flow has been retrospectively adjusted to include cash outflows of acquisition of licensed copyrights, which is presented on the same basis as 2020 and going forward.For more information on non-GAAP financial measures, please see the tables captioned “Reconciliations of non-GAAP financial measures to the nearest comparable GAAP measures.”Baidu, Inc.Condensed Consolidated Statements of Income (Loss)(In millions except for share, per share (or ADS) information, unaudited)Three Months EndedSeptember 30,June 30,September 30,September 30,2019202020202020RMB RMB RMB US$(2) Revenues:Online marketing services20,43417,68820,2012,975 Others7,6468,3468,0311,183 Total revenues 28,08026,03428,2324,158 Costs and expenses:Cost of revenues(1)16,37813,13412,8151,886 Selling, general and administrative(1)4,6574,4174,700692 Research and development(1)4,6904,8394,561673 Total costs and expenses25,72522,39022,0763,251 Operating income2,3553,6446,156907 Other income (loss):Interest income1,6871,3121,297191 Interest expense(788)(820)(755)(111) Foreign exchange income (loss), net2955(271)(40) Gain (loss) from equity method investments(729)(1,732)(546)(80) Other income (loss), net(9,683)1,5519,1691,351 Total other income (loss), net(9,484)3668,8941,311 Income (loss) before income taxes(7,129)4,01015,0502,218 Income tax expense9341,2221,618239 Net income (loss)(8,063)2,78813,4321,979 Net loss attributable to noncontrolling interests(1,690)(791)(246)(36) Net income (loss) attributable to Baidu(6,373)3,57913,6782,015 Earnings per ADS (1 Class A ordinary share equals 10 ADSs):-Basic(18.37)10.3440.21 5.92 -Diluted(18.37)10.3139.79 5.86 Earnings per share for Class A and Class B ordinary shares:-Basic(183.74)103.44402.0659.22 -Diluted(183.74)103.06397.8858.60 Weighted average number of Class A and Class B ordinary shares outstanding:Basic 34,793,15434,377,65833,982,54733,982,547 Diluted34,793,15434,505,61734,339,43834,339,438 (1) Includes share-based compensation expenses as follows:Cost of revenues701088112 Selling, general and administrative33655040360 Research and development8101,188930137 Total share-based compensation expenses1,2161,8461,414209 (2) All translations from RMB to U.S. dollars are made at a rate of RMB 6.7896 to US$1.00, the exchange rate in effect as of September 30, 2020 as set forth in the H.10 statistical release of The Board of Governors of the Federal Reserve System.Baidu, Inc.Condensed Consolidated Balance Sheets(In millions except for share information, unaudited)December 31,September 30,September 30,201920202020RMB RMB US$ ASSETSCurrent assets:Cash and cash equivalents33,44318,4232,713 Restricted cash99666999 Short-term investments112,924126,87618,687 Accounts receivable, net7,4167,0461,038 Amounts due from related parties1,5941,307193 Other current assets, net9,1898,8311,301 Total current assets165,562163,15224,031 Non-current assets:Fixed assets, net18,31117,1542,527 Licensed copyrights, net6,2876,062893 Intangible assets, net1,6002,033299 Goodwill18,25021,7763,207 Long-term investments, net69,41081,28911,973 Amounts due from related parties3,5643,639536 Deferred tax assets, net2,193804118 Operating lease right-of-use assets7,3329,6481,421 Produced content, net4,3555,517813 Other non-current assets4,4523,668540 Total non-current assets135,754151,59022,327 Total assets301,316314,74246,358LIABILITIES AND EQUITYCurrent liabilities:Short-term loans2,6183,804560 Accounts payable and accrued liabilities32,70131,5924,653 Customer deposits and deferred revenue11,06212,1851,795 Deferred income52916324 Long-term loans, current portion7377,5061,106 Notes payable, current portion5,219--Amounts due to related parties2,2311,747257 Operating lease liabilities2,2834,636683 Total current liabilities57,38061,6339,078 Non-current liabilities:Deferred income17578 Deferred revenue1,00960990 Amounts due to related parties3,8463,689543 Long-term loans7,80462892 Notes payable38,09043,9176,468 Convertible senior notes12,29712,3071,813 Deferred tax liabilities3,2733,319489 Operating lease liabilities4,4864,607679 Other non-current liabilities29931647 Total non-current liabilities71,12169,44910,229 Total liabilities128,501131,08219,307 Redeemable noncontrolling interests1,1091,248184 EquityTotal Baidu shareholders' equity163,599176,29125,965 Noncontrolling interests8,1076,121902 Total equity171,706182,41226,867Total liabilities, redeemable noncontrolling interests,and equity301,316314,74246,358Baidu, Inc.Selected Information(In millions except for per ADS information, unaudited)Baidu Core iQIYI Elim &adj (2)Baidu,Inc.Baidu Core iQIYI Elim &adj (2)Baidu,Inc.Baidu Core iQIYI Elim &adj (2)Baidu,Inc.Baidu Core iQIYI Elim &adj (2)Baidu,Inc.Total revenues21,010 7,397(327)28,08018,9267,412(304)26,03421,379 7,188 (335) 28,2323,149 1,059 (50) 4,158YOY 2%(3%)1% QOQ13%(3%)8%Costs and expenses: Cost of revenues (1)8,502 8,176(300)16,3786,5556,834(255)13,1346,728 6,363 (276) 12,815991937(42)1,886Selling, general and administrative (1)3,320 1,350 (13) 4,657 3,230 1,196 (9) 4,417 3,354 1,364 (18) 4,700 494 201 (3) 692 Research and development (1)3,997 703 (10) 4,690 4,175 664 - 4,839 3,893 671 (3) 4,561 574 99 - 673 Total costs and expenses 15,819 10,229 (323) 25,725 13,960 8,694 (264) 22,390 13,975 8,398 (297)22,076 2,059 1,237 (45) 3,251YOYCost of revenues(21%)(22%)(22%)Selling, general and administrative 1%1%1% Research and development (3%)(5%)(3%) Cost and expenses (12%)(18%)(14%)Operating income (loss)5,191(2,832)(4)2,3554,966(1,282) (40)3,6447,404(1,210)(38)6,156 1,090(178)(5)907YOY 43%(57%)161% QOQ49%(6%)69%Operating margin25%(38%)8%26%(17%)14%35%(17%)22% Add: total other income (loss),net (8,657) (827)- (9,484)507(141) - 3668,827 67 - 8,894 1,30110- 1,311Less: income tax expense918 16- 934 1,206 16 - 1,222 1,599 19 - 1,618 236 3 - 239 Less: net income (loss) attributable to NCI (97)13(1,606)(3)(1,690)(157) 3 (637)(3)(791)264 13 (523)(3)(246) 39 2 (77)(3)(36) Net income(loss) attributable to Baidu (4,287) (3,688)1,602(6,373)4,424(1,442) 5973,57914,368 (1,175) 48513,6782,116 (173) 722,015YOY -(68%)- QOQ225%(19%)282%Net margin(20%)(50%)(23%)23%(19%)14%67%(16%)48%Non-GAAP financial measures:Operating income (loss) (non-GAAP)6,224(2,529)3,6916,482(837)5,6058,505(831)7,636 1,253(123)1,125YOY 37%(67%)107% QOQ31%(1%)36%Operating margin (non-GAAP)30%(34%)13%34%(11%)22%40%(12%)27%Net income (loss) attributable to Baidu (non-GAAP)6,310(3,394)4,3875,656(956)5,0827,486(830)6,9881,103(123)1,029YOY 19%(76%)59% QOQ32%(13%)38%Net margin (non-GAAP)30%(46%)16%30%(13%)20%35%(12%)25%Adjusted EBITDA 7,525(2,405)5,1167,771(716)7,0159,822(711)9,0731,447(106)1,336YOY 31%(70%)77% QOQ26%(1%)29%Adjusted EBITDA margin36%(33%)18%41%(10%)27%46%(10%)32%(1) Includes share-based compensation as follows:Cost of revenues 25 45 70 49 59 108 29 52 81 4 8 12 Selling, general and administrative 207 129 336 331 219 550 187 216 403 28 32 60 Research and development 749 61 810 1,102 86 1,188 846 84 930 125 12 137 Total share-based compensation 981 235 1,2161,4823641,8461,0623521,414157 52 209(2) Relates to intersegment eliminations and adjustments(3) Relates to the net loss attributable to iQIYI noncontrolling interestsThree months ended September 30, 2019 (RMB)Three months endedJune 30, 2020 (RMB)Three months endedSeptember 30, 2020 (RMB)Three months endedSeptember 30, 2020 (US$)。
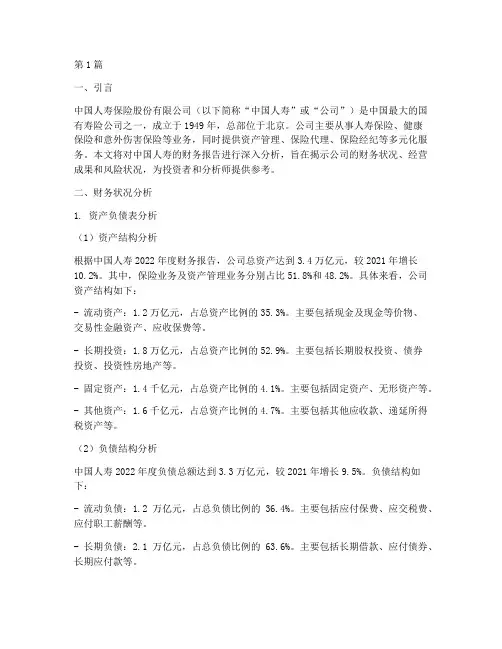
第1篇一、引言中国人寿保险股份有限公司(以下简称“中国人寿”或“公司”)是中国最大的国有寿险公司之一,成立于1949年,总部位于北京。
公司主要从事人寿保险、健康保险和意外伤害保险等业务,同时提供资产管理、保险代理、保险经纪等多元化服务。
本文将对中国人寿的财务报告进行深入分析,旨在揭示公司的财务状况、经营成果和风险状况,为投资者和分析师提供参考。
二、财务状况分析1. 资产负债表分析(1)资产结构分析根据中国人寿2022年度财务报告,公司总资产达到3.4万亿元,较2021年增长10.2%。
其中,保险业务及资产管理业务分别占比51.8%和48.2%。
具体来看,公司资产结构如下:- 流动资产:1.2万亿元,占总资产比例的35.3%。
主要包括现金及现金等价物、交易性金融资产、应收保费等。
- 长期投资:1.8万亿元,占总资产比例的52.9%。
主要包括长期股权投资、债券投资、投资性房地产等。
- 固定资产:1.4千亿元,占总资产比例的4.1%。
主要包括固定资产、无形资产等。
- 其他资产:1.6千亿元,占总资产比例的4.7%。
主要包括其他应收款、递延所得税资产等。
(2)负债结构分析中国人寿2022年度负债总额达到3.3万亿元,较2021年增长9.5%。
负债结构如下:- 流动负债:1.2万亿元,占总负债比例的36.4%。
主要包括应付保费、应交税费、应付职工薪酬等。
- 长期负债:2.1万亿元,占总负债比例的63.6%。
主要包括长期借款、应付债券、长期应付款等。
(3)所有者权益分析中国人寿2022年度所有者权益为1.1万亿元,较2021年增长12.6%。
所有者权益结构如下:- 实收资本:3.3千亿,占总所有者权益比例的30.2%。
- 盈余公积:1.3千亿,占总所有者权益比例的11.9%。
- 未分配利润:5.5千亿,占总所有者权益比例的50.0%。
2. 盈利能力分析(1)营业收入分析中国人寿2022年度营业收入为8214.4亿元,较2021年增长5.8%。
2024年保险公司财务工作总结参考在领导的支持和帮忙下,我与单位同事的团结协作,以求真务实的工作精神,较好的完成了各项工作任务,取得了的必须成绩,现就本年度个人工作情景总结如下:认真完成会计核算工作,及时上报各类会计报表1、认真做好了会计核算工作(1)完成了日常财务报销、工资以及各项补贴的发放。
处理好日常会计事务等基础工作,是财务管理的重要环节。
年,我严格按照年度预算制度有关规定,年初制定了各科室的财务支出预算工作按进度按日期给予各部门资金支出,年底编制各部门财务决算并及时将各项业务定期与财政、银行进行对帐,严格按照资金支出进度合理使用资金。
(2)本着对单位领导、同事负责的态度,我科按要求及时向缴纳了职工的各项保险。
年全年,及时交纳各项保险万元。
其中:为名职工办理退休养老保险万元。
(3)年,完成了为名在职工办理住房公积金缴纳工作,全年共为名在职工缴纳万元。
(5)加强和完善国有资产管理,年,为防止我办的国有固定资产的管理出现问题(如固定产明细记录不完整),我们升级账务软件将过去单一的固定资产管理升级为多样式的管理,为固定资产的使用和管理打下更好基础。
(6)对会计资料进行了整理,将相关会计档案进行了整理入档,使我办会计工作向标准化、规范化更进一步。
(7)根据财政部颁布的新事业会计制度按财政局要求所有____年会计业务处理必须执行新的会计制度,由于文件下达较晚造成了工作重复。
为此我加班加点的进行会计的业务处理,及时准确进行了相关数据上报。
2、及时完成了上级有关部门下达的各项任务(1)按照市财政局的要求对固定资产账等银行往来账款进行了逐笔核对并进行了账务调整及上报工作。
同时,按照审计制度对拨出的各项资金进行了严格的审计,现审计工作基本完成。
(2)按财政有关编制预算精神,结合我办实际支出情景,经认真研究测算,按规定时间完成了年预算上报工作。
年,我将继续在领导的指导和关怀下做好财务收支核算工作和财务管理工作,具体如下:2、做好财务计划管理,加强财务计划执行情景的分析和控制,加强财务事先参与决策工作从源头上做好财务管理工作,为领导决策供给有用的决策信息。
证券研究报告| 行业点评2020年11月01日保险负债短期承压投资改善险企积极备战开门红三季度新单保费继续承压,上市险企整体新单负增长:总保费方面,前三季度国寿、平安、太保、新华总保费增速分别为+9.4%、+1.9%、+5.5%、+24.5%(2020H分别为+13.1%、-0.2%、+4.2%、+30.9%),保持相对平稳,其中平安、太保产寿险保费增速均有所改善,带动总保费增速提升,新华、国寿在前期较好的基数下保费增速有所放缓。
新单方面,Q3单季度看预计仅新华NBV出现相对改善,太保预计与中报基本持平,国寿、平安NBV累计增速分别由中期同比的+6.7%、-24.4%降至2.7%、-27.1%,主要原因包括疫情影响的相对持续、提前对开门红准备、人力缺口以及费用投放下降等。
后期展望,当前除新华外其余上市险企已经进入开门红阶段,今年全年业绩整体存在一定压力,Q4增速或有继续下行压力。
权益利率持续向好,投资收益率明显提升:Q3随着经济数据的整体向好,长端利率逐步由季度初的2.85%上行至3.15%,显著缓解低利率的担忧并给保险公司固收资产增配带来较好的机会。
权益市场方面,单季度沪深300、上证综指、深证成指分别上涨8.0%、6.3%、6.0%,全年分别上涨10.5%、4.3%、21.3%,提升上市险企权益资产收益率。
利率及权益的回暖使得上市险企投资收益率有不同程度的提升,国寿、平安、太保前三季度净投资收益率分别为4.47%、4.5%、4.6%,较中期分别提升0.18pt、0.40pt、0.20pt;国寿、平安、太保、新华总投资收益率分别为5.36%、5.2%、5.5%、5.6%,分别较中报提升0.02pt、0.80pt、0.70pt、0.50pt,预计今年全年上市险企基本能维持5%以上的投资收益率。
准备金普遍增提,净利润仍有压力:前三季度国寿、平安、太保、新华归母净利润增速分别为-18.4%、-20.5%、-14.3%、-14.6%,仍为普遍负增长,其中Q3单季度分别+7.7%、-17.7%、-19.6%、+17.5%,Q3单季度虽然投资收益有明显提升,但前期基数缺口较大,且由于准备金折现率假设变更以及重疾恶化和偿二代二期考虑,国寿分别增提寿险和长期健康险责任准备金173.76亿元、17.47亿元;新华分别增提寿险和长期健康险准备金20.95亿元、55.03亿元,太保增提准备金96.92亿元,均对利润形成直接影响。
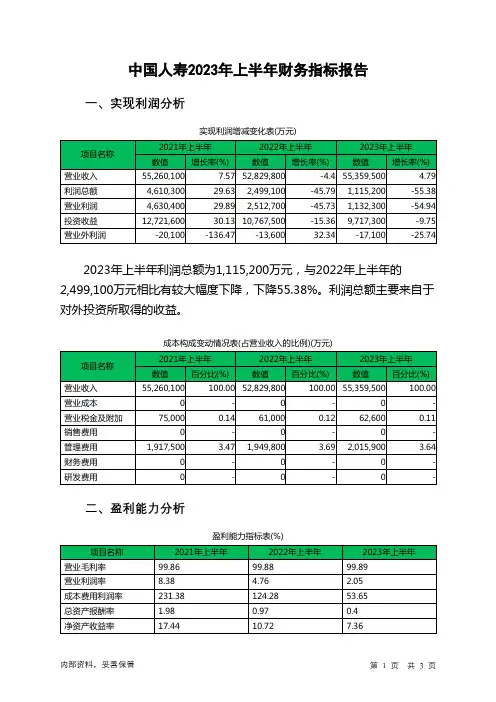
中国人寿2023年上半年财务指标报告一、实现利润分析实现利润增减变化表(万元)2023年上半年利润总额为1,115,200万元,与2022年上半年的2,499,100万元相比有较大幅度下降,下降55.38%。
利润总额主要来自于对外投资所取得的收益。
成本构成变动情况表(占营业收入的比例)(万元)二、盈利能力分析盈利能力指标表(%)中国人寿2023年上半年的营业利润率为2.05%,总资产报酬率为0.40%,净资产收益率为7.36%,成本费用利润率为53.65%。
企业实际投入到企业自身经营业务的资产为149,949,300万元,经营资产的收益率为1.51%,而对外投资的收益率为4.99%。
2023年上半年营业利润为1,132,300万元,与2022年上半年的2,512,700万元相比有较大幅度下降,下降54.94%。
以下项目的变动使营业利润增加:资产处置收益增加2,300万元,公允价值变动收益增加671,100万元,共计增加673,400万元;以下项目的变动使营业利润减少:其他收益减少1,600万元,投资收益减少1,050,200万元,营业税金及附加增加1,600万元,管理费用增加66,100万元,资产减值损失增加715,700万元,共计减少1,835,200万元。
各项科目变化引起营业利润减少1,380,400万元。
三、偿债能力分析本期财务费用为负,无法进行长期付息能力判断。
四、营运能力分析资产周转速度表中国人寿2023年上半年总资产周转次数为0.20次,比2022年上半年周转速度放慢,周转天数从1762.71天延长到1835.09天。
企业资产规模有较大幅度的扩大,但营业收入没有相应的增长,致使企业总资产的周转速度下降。
五、发展能力分析中国人寿2023年上半年营业收入为55,359,500万元,比2022年上半年增长4.79%。
但这一增长速度是在上一期营业收入下降的情况下取得的,本期已经恢复并超过了2021年上半年的水平。
保险公司财务分析报告一、保险公司偿付能力情况保险公司对财务稳定性有特殊要求,“偿付能力是保险公司的生命线” 。
保险公司的资金运转和融通能力主要是偿付能力,包括赔款、给付和偿还其他债务的能力。
对于一般企业来说,财务状况不稳定或恶化,影响范围有限,通常只是影响本企业的商品流转或再生产的持续进行,或波及与本企业生产或流通相关联的企业。
而保险业是负债经营,积聚了国民生产各部门的风险,一旦保险公司财务状况不稳定或出现危机,其影响范围非常广泛,所损害的不只是公司的股东和保单持有者,甚至会影响社会经济生活安定。
保险公司的偿付能力是保险公司生存和可持续发展的前提,对其偿付能力主要从短期流动性和长期偿付能力两方面来分析。
(一)短期流动性短期流动性指的是保险公司的资产所具有的能随时应对理赔的变现能力,流动性分析主要可以通过现金比率来衡量。
现金比率是一项反映短期偿债能力的指标,主要计算现金及现金等价物是否足以偿还未到期保费和支付未到期赔款的一项指标,计算公式为:现金比率=现金及等价物/(未到期责任准备金+未决赔款责任准备金)(二)长期偿付能力对于寿险业务,保险期险一般较长,在收入补偿与发生成本之间存在较长的时间差。
因此,对于寿险业务长期偿债能力更加重要。
对于保险资金的长期投资人来说,最关注的就是投入的资金是否有收回的保障和资金收回是否有良好的预期。
因此,在考量保险公司长期偿付能力时,应重点关注以下两点:1、资本结构分析资本结构反映了公司的融资渠道,资本结构分析可以衡量公司对长期资金提供者的保障程度,主要可以通过资产负债率、负债经营率等指标来考量。
“一般来说,对于财产险公司指标值应小于85%。
寿险公司的负债率要高于财险公司,但一般来说,资产负债率应小于90%。
”同时还可以参考保险监管机构要求的偿付能力充足率情况。
2、盈利能力分析在分析长期偿付能力时,需特别关注保险公司的盈利能力。
因为现金流的变化最主要的是取决于公司能获得的收入和必须付出的成本之间的差额及两者间的比例关系,盈利是长期负债所需资金的最可靠、最理想的来源。
广东财经大学华商学院关于中国人寿保险公司会计信息失真问题的调研报告关于中国人寿保险公司会计信息失真问题的调研报告一、前言(一)会计信息失真的表现方式1.会计信息不符实会计信息不符实是指由于相关财务会计人员的工作失误、经验不足等不可估计因素导致的会计信息与经济活动的实际情况不切合。
这种类型的会计信息不是会计人员主观故意的,和企业员工的技术水平有直接的联系。
该行为是一种岗位失职行为,严重者可能面临撤职和降职的危险。
2.会计信息进行造假会计信息造假是指蓄意谋划的、具有明确目的性的、有针对性的财务造假和欺诈行为。
简单来说就是企业会计人员及财务管理人员为了自己的谋财目的,想方设法地进行会计信息造假来取得中间的差额,从而获取非法收益。
会计信息造假是财务管理人员和企业会计人员故意瞒报收支,虚报实情,这和相关人员的职业道德水平有直接的联系。
这种行为会带来相当严重的违纪违法后果,执法机关会对严重违纪违法的人进行法律责任的追究。
(二)会计信息失真的研究背景及其研究意义1.会计信息失真的研究背景会计信息失真指的是违反了客观性的原则,会计信息的过程不符合会计准则及相关法律法规的核心准则,因此未能真实地反应企业的财务状况、经营成果和现金流量环境,为经营管理者带来影响的一种现象。
如果会计信息失真问题加剧严重的话,其导致的经济后果是非常重大的,如果不重视此问题,将会给企业经济发展乃至国家信用产生毁灭性的伤害。
在目前的社会经济环境下,会计信息构成了整个社会经济正常运行的重要基础。
财政部在2012年对外发布了《中华人民共和国财政部会计信息质量检查公告》,其目的是为了规范企业会计的行为以及提升“监督”课题的透明度。
目前关于会计信用造假的手段千奇百怪,多种多样,明显地体现出国家的监督力度不够强劲,监管体制不够完善。
我国仍然有较多企业被会计信息失真这个问题所困扰,阻碍着企业的稳健发展。
会计信息失真目前已经逐渐成为提上台面的社会问题,并可能使我国社会主义现代化建设的发展停滞不前。
中国保险监督管理委员会关于人寿保险公司报送人身保险业务季度分析有关情况的通知文章属性•【制定机关】中国保险监督管理委员会(已撤销)•【公布日期】2001.03.26•【文号】保监发[2001]83号•【施行日期】2001.03.26•【效力等级】部门规范性文件•【时效性】失效•【主题分类】保险正文*注:本篇法规已被:中国保险监督管理委员会关于公布规章和规范性文件清理结果的通知(发布日期:2010年12月2日,实施日期:2010年12月2日)废止中国保险监督管理委员会关于人寿保险公司报送人身保险业务季度分析有关情况的通知(保监发[2001]83号2001年3月26日)中国人寿保险公司,中国平安保险股份有限公司,中国太平洋人寿保险公司,新华人寿保险股份有限公司,泰康人寿保险股份有限公司,美国友邦保险有限公司上海分公司,美国友邦保险有限公司广州分公司,美国友邦保险有限公司深圳分公司,中宏人寿保险有限公司,太平洋安泰人寿保险有限公司,安联大众人寿保险有限公司,金盛人寿保险有限公司,中保康联人寿保险有限公司,信诚人寿保险有限公司,恒康天安人寿保险有限公司:为及时掌握人身保险市场运行动态,我会决定自2001年起启动相关统计和分析,具体要求为:一、自2001年起,各经营人身保险业务的保险公司应在向财务会计部报送有关统计住处的基础上,将相关材料抄送人身保险监管部。
二、各人身保险公司应于季后10日内,将2001年3月修改后的《人身保险公司业务统计表》(保监统S3-02表)传真至我会财务会计部和人身保险监管部;季后15日内按我会有关保险监管报表的内容及报送方式的要求,向我会报送完整的保险监管季度报表。
三、各人身保险公司应在季度末10日内向我会人身保险监管部报送季度分析报告,并抄送财务会计部,分析报告的指标应包含规模、速度、同比和环比等分析内容,分析范围主要包括:(一)保费收入,含毛保费和(或)标准保费情况(二)保费收入结构情况1.意外保险、健康保险(长短期)、人寿保险、年金业务情况2.团体业务、个险业务、银行代理业务情况3.新单业务、续期业务情况4.趸缴业务、期缴业务情况5.传统业务和非传统业务情况,其中含分红产品、投资连结产品和万能寿险产品情况6.人身保险公司经营的经中国保监会批准的产品,如补充养老保险产品或企业年金产品情况(三)满期给付、理赔和退保,续保率和退保率情况(四)佣金、手续费和管理费情况(五)人身保险业务地区结构分析(六)业务经营过程中的特点和原因分析(七)重大事项和典型案例(八)其他需要说明的情况四、各人身保险公司在第四季度分析报告中,应提供公司全年运行情况的初步分析,待决算财务数据出来后,在每年3月底前上报年度分析报告。
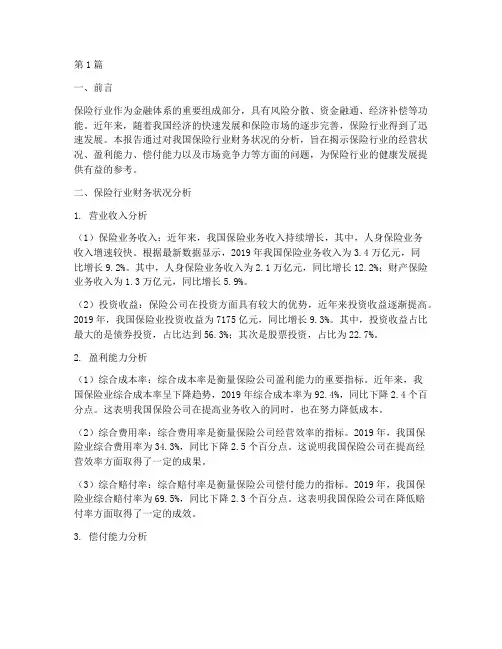
第1篇一、前言保险行业作为金融体系的重要组成部分,具有风险分散、资金融通、经济补偿等功能。
近年来,随着我国经济的快速发展和保险市场的逐步完善,保险行业得到了迅速发展。
本报告通过对我国保险行业财务状况的分析,旨在揭示保险行业的经营状况、盈利能力、偿付能力以及市场竞争力等方面的问题,为保险行业的健康发展提供有益的参考。
二、保险行业财务状况分析1. 营业收入分析(1)保险业务收入:近年来,我国保险业务收入持续增长,其中,人身保险业务收入增速较快。
根据最新数据显示,2019年我国保险业务收入为3.4万亿元,同比增长9.2%。
其中,人身保险业务收入为2.1万亿元,同比增长12.2%;财产保险业务收入为1.3万亿元,同比增长5.9%。
(2)投资收益:保险公司在投资方面具有较大的优势,近年来投资收益逐渐提高。
2019年,我国保险业投资收益为7175亿元,同比增长9.3%。
其中,投资收益占比最大的是债券投资,占比达到56.3%;其次是股票投资,占比为22.7%。
2. 盈利能力分析(1)综合成本率:综合成本率是衡量保险公司盈利能力的重要指标。
近年来,我国保险业综合成本率呈下降趋势,2019年综合成本率为92.4%,同比下降2.4个百分点。
这表明我国保险公司在提高业务收入的同时,也在努力降低成本。
(2)综合费用率:综合费用率是衡量保险公司经营效率的指标。
2019年,我国保险业综合费用率为34.3%,同比下降2.5个百分点。
这说明我国保险公司在提高经营效率方面取得了一定的成果。
(3)综合赔付率:综合赔付率是衡量保险公司偿付能力的指标。
2019年,我国保险业综合赔付率为69.5%,同比下降2.3个百分点。
这表明我国保险公司在降低赔付率方面取得了一定的成效。
3. 偿付能力分析(1)偿付能力充足率:偿付能力充足率是衡量保险公司偿付能力的重要指标。
根据中国银保监会最新数据显示,2019年末,我国保险公司平均偿付能力充足率为234%,高于监管要求。
第1篇一、引言人寿寿险作为一种重要的金融产品,在风险管理和财富传承方面发挥着重要作用。
本报告旨在通过对某人寿寿险公司的财务状况进行分析,评估其经营状况、盈利能力、偿付能力以及未来发展潜力,为投资者、监管机构及公司管理层提供决策参考。
二、公司概况某人寿寿险公司成立于XX年,总部位于XX市,是一家集保险、资产管理、金融产品开发于一体的综合性寿险公司。
公司拥有丰富的产品线,包括人寿保险、健康保险、意外伤害保险等,覆盖了个人、家庭和企业等多个市场。
三、财务分析(一)经营状况分析1. 营业收入分析近年来,公司营业收入逐年增长,主要得益于产品创新、营销网络拓展和业务规模扩大。
以下是近年来公司营业收入的具体数据:| 年份 | 营业收入(亿元) || ---- | -------------- || 2018 | 120.0 || 2019 | 150.0 || 2020 | 180.0 || 2021 | 210.0 |从上述数据可以看出,公司营业收入呈稳步增长态势,表明公司业务发展势头良好。
2. 业务结构分析公司业务结构主要包括人寿保险、健康保险和意外伤害保险。
以下是近年来各类业务的占比情况:| 保险类别 | 占比(%) || -------- | -------- || 人寿保险 | 60.0 || 健康保险 | 25.0 || 意外伤害保险 | 15.0 |从业务结构分析可以看出,人寿保险业务占比最大,是公司的主要收入来源。
(二)盈利能力分析1. 利润总额分析近年来,公司利润总额逐年增长,主要得益于业务规模扩大和成本控制。
以下是近年来公司利润总额的具体数据:| 年份 | 利润总额(亿元) || ---- | -------------- || 2018 | 10.0 || 2019 | 15.0 || 2020 | 20.0 || 2021 | 25.0 |从上述数据可以看出,公司利润总额呈稳步增长态势,表明公司盈利能力较强。
中国人寿财务分析报告一、引言中国人寿保险股份有限公司(以下简称中国人寿)是中国最大的寿险公司之一,成立于1949年。
本报告旨在对中国人寿的财务状况进行分析,并提供有关公司经营情况的见解。
二、财务概述 1. 资产状况根据中国人寿的财务报表,截至2019年底,公司总资产达到X亿元,较上一年度增长X%。
其中,投资资产占总资产比重最高,达到X%,说明公司具有较强的资产配置能力。
2.负债状况中国人寿的负债总额为X亿元,较上一年度增长X%。
其中,保险合同准备金是公司负债的主要组成部分,占总负债的X%。
保险合同准备金的增加说明公司具备较好的风险管理能力。
3.收入状况根据财务报表,中国人寿的年度总收入为X亿元,较上一年度增长X%。
其中,保费收入是公司最主要的收入来源,占总收入的X%。
此外,中国人寿还通过投资活动获得了一定的投资收益,占总收入的X%。
三、财务指标分析 1. 盈利能力中国人寿的净利润为X亿元,较上一年度增长X%。
利润增长主要受益于保费收入的增加和投资收益的提升。
净利润率为X%,说明公司在核心业务和投资方面取得了良好的回报。
2.偿付能力中国人寿的资本充足率为X%,高于监管要求的X%。
资本充足率的提高表明公司具备较强的偿付能力,能够满足客户的索赔需求。
3.运营效率中国人寿的成本费用率为X%,较上一年度下降X个百分点。
成本费用率的降低体现了公司在成本控制方面取得的进展,提升了运营效率。
四、风险分析 1. 利率风险中国人寿的投资组合中存在一定比例的固定收益类资产,如债券和货币市场工具。
利率的上升可能导致这些资产的价值下降,从而对公司的财务状况造成影响。
2.赔付风险作为一家寿险公司,中国人寿面临着赔付风险。
如果赔付金额超出了公司的预期,可能对财务状况造成不利影响。
五、投资建议综合以上分析,我认为中国人寿在保费收入增长和投资收益提升的推动下,实现了较好的财务表现。
然而,公司仍面临着利率风险和赔付风险等挑战。
因此,我建议中国人寿应继续加强资产负债管理,提高投资组合的多样性,并加强风险管理措施,以确保业务长期稳定发展。
中国人寿财务报表分析目前,中国保险业呈现出原保险、再保险、保险中介、保险资产管理互相协调,中外资保险公司共同发展旳市场格局。
到年终,国内有9 家保险公司资产超过千亿元、2 家超过五千亿元、1 家超过万亿元。
专业性旳保险资产管理公司、健康险公司、养老险公司逐渐成长并成为市场旳重要力量。
就行业来说,保险业是比较市场化运作旳金融子行业,在我国,不管从保险深或广度看,都是个朝阳行业。
积极政策导向和保险业旳改革逐渐加深对公众保险意识旳引导,保险业旳经营环境也许会越来越好。
中国人寿即中国人寿保险公司,中国人寿保险公司及其子公司构成了我国最大旳人寿保险集,是国内一家资产过万亿旳保险集团之一,是中国资我市场最大旳机构投资者之一。
,中国人寿保险公司及其子公司总保费收入达到3220.52亿元,境内寿险业务约占寿险市场份额旳42.7%;总资产达到12846.11亿元,可运用资金超过11000亿元。
《财富》杂志世界500强排名第111位。
一、财务数据比率分析及比较分析1. 偿债能力1-1短期偿债能力短期偿债能力是指公司偿付流动负债旳能力。
流动比率0.4325 0.4683 0.4964 0.5238 0.5423 速动比率0.0822 0.0879 0.0919 0.0990 0.0943 钞票比率0.0459 0.049 0.0414 0.0436 0.0128 钞票流量比率0.152 0.1522 0.0991 0.0831 0.1590 由表中数据我们可以看出,中国人寿旳短期偿债能力趋于平稳,从开始偿债能力较此前始终在逐渐增强。
1-1-1流动比率分析流动比率指标越高,表白公司旳偿付能力越强,公司所面临旳短期流动性风险越小,债权人安全限度越高。
它是判断公司信用旳一种原则,还可以反映出公司在目前及此后旳生产经营中提供钞票、归还短期债务、维护正常经营活动旳能力。
由图我们可以看出,中国人寿流动比率由旳0.4325增长到了旳0.5423,短期偿债能力有所增强。
2024年保险公司第三季度工作总结尊敬的领导:您好!本次将对2024年保险公司第三季度工作进行总结报告。
在这个季度里,我们正面临着诸多挑战与机遇,通过全体员工的努力,公司实现了一系列重要目标。
下面将从市场开发、产品创新、业绩提升、风险控制等四个方面进行具体分析。
一、市场开发本季度,我们加大了市场开发与拓展力度,通过与各大银行、电商平台等合作,拓宽了产品销售渠道。
同时,通过大数据分析和市场调研,我们不断优化产品定位和推广策略,提高了市场占有率。
在推广方面,我们注重与渠道伙伴的合作,开展了一系列培训和推广活动,提高了渠道伙伴的销售能力。
我们还利用社交媒体平台开展了线上推广活动,增加了品牌曝光度和用户粘性。
二、产品创新本季度,我们积极探索新产品领域,推出了一系列具有市场竞争力的新产品。
在保险科技领域,我们引入了人工智能技术,推出了智能理赔系统,提高了理赔效率和客户满意度。
同时,我们还推出了定制化产品,根据不同客户群体的需求,精确定位产品特点,提供个性化的保险方案。
这些新产品在市场上取得了较好的口碑和销售业绩,对公司业务增长起到了积极推动作用。
三、业绩提升在销售业绩方面,本季度公司取得了较好的成绩。
通过加大营销力度和销售培训,我们成功开拓了新客户群体,提高了客户续保率。
同时,我们注重客户服务,提高了客户满意度和忠诚度。
在财务方面,公司营收和利润均实现了较大幅度增长。
我们积极推动线上线下的业务融合,提高了销售效能和成本控制能力。
通过全员参与的运营优化,我们实现了资源的最大化利用,并提高了整体经营效益。
四、风险控制作为一家保险公司,风险控制是我们工作的重中之重。
本季度,我们进一步完善了风险防控机制,加强了保险精算和风险审查工作,降低了保险赔付风险。
同时,我们加大了对渠道伙伴的合规性监督力度,避免了恶意欺诈行为。
此外,我们还加强了公司内部的风险管理培训,提高了员工对风险的辨识能力和应对能力。
通过这些措施,我们有效控制了各类风险的发生,保证了公司的持续稳健发展。
中国人寿2023年度报告摘要本报告旨在对中国人寿保险公司(以下简称中国人寿)2023年度的经营情况和业绩进行全面分析与总结。
通过分析公司的财务报表和经营数据,揭示中国人寿在2023年度取得的成绩、面临的挑战以及未来的发展机遇。
这些信息将帮助投资者和利益相关者更好地了解中国人寿的业务模式和未来发展前景。
1. 公司概况中国人寿是中国最大的综合性保险公司之一,成立于1949年,总部位于北京。
公司提供各类人身保险、财产保险和健康保险产品,经营范围涵盖寿险、健康险、意外险等多个领域。
凭借其庞大的销售网络和强大的品牌优势,中国人寿在中国保险市场中占据了领先地位。
2. 2023年度业绩回顾中国人寿2023年度实现了稳健的增长,继续保持了在行业中的竞争优势。
以下是公司在2023年度取得的主要业绩指标:•保险业务收入:中国人寿2023年度保险业务收入达到XXX亿元,同比增长XX%。
这主要得益于公司销售网络的扩张和保险产品的创新。
•保险合同利润:2023年度,中国人寿实现了XXX亿元的保险合同利润,同比增长XX%。
公司通过优化风险管理和产品定价策略,进一步提高了保险业务的盈利能力。
•投资收益:2023年度,中国人寿的投资收益达到XXX亿元,同比增长XX%。
公司积极调整投资组合,加大了对高质量投资标的的配置,有效提升了投资回报率。
•综合利润:2023年度,中国人寿实现了XXX亿元的综合利润,同比增长XX%。
公司通过优化运营效率和控制成本,进一步提高了经营效益。
3. 面临的挑战尽管中国人寿在2023年度取得了良好的业绩,但也面临着一些挑战:•竞争压力加大:中国保险市场竞争激烈,众多保险公司加大了市场推广和产品创新的力度,对中国人寿构成了竞争压力。
•风险管理挑战:保险业务的特点决定了中国人寿需要面临各种风险,如市场风险、信用风险和操作风险等。
如何有效管理这些风险是公司面临的挑战之一。
•监管政策调整:中国保险监管机构的政策调整对中国人寿的经营活动和产品销售带来一定影响,公司需要及时应对并适应这些变化。