2018美赛数学建模A题
- 格式:docx
- 大小:13.44 KB
- 文档页数:1
2018数学建模a题优秀论文Background: On high frequencies (HF, defined to be 3 –30 mHz), radio waves can travel long distances (from one point on the earth’s surface to another distant point on the earth’s surface) by multiple reflections off the ionosphere and off the earth. For frequencies below the maximum usable frequency (MUF), HF radio waves from a ground source reflect off the ionosphere back to the earth, where they may reflect again back to the ionosphere, where they may reflect again back to the earth, and so on, travelling further with each successive hop. Among other factors, the characteristics of the reflecting surface determine the strength of the reflected wave and how far the signal will ultimately travel while maintaining useful signal integrity. Also, the MUF varies with the season, time of day, and solar conditions. Frequencies above the MUF are not reflected/refracted, but pass through the ionosphere into space. In this problem, the focus is particularly on reflections off the ocean surface. It has been found empirically that reflections off a turbulent ocean are attenuated more than reflections off a calm ocean. Ocean turbulence will affect the electromagnetic gradient of seawater, altering the local permittivity and permeability of the ocean, and changing the height and angle of the reflection surface. A turbulent ocean is one in which wave heights, shapes, and frequencies change rapidly, and the direction of wavetravel may also change.Problem:Part Ⅰ: Develop a mathematical model for this signal reflection off the ocean. For a 100-watt HF constant-carrier signal, below the MUF, from a point source on land, determine the strength of the first reflection off a turbulent ocean and compare it with the strength of a first reflection off a calm ocean. (Note that this means that there has been one reflection of this signal off the ionosphere.) If additional reflections (2 through n) take place off calm oceans, what is the maximum number of hops the signal can take before its strength falls below a usable signal-to-noise ratio (SNR) threshold of 10 dB?Part Ⅱ: How do your findi ngs from Part I compare with HF reflections off mountainous or rugged terrain versus smooth terrain?Part Ⅲ: A ship travelling across the ocean will use HF for communications and to receive weather and traffic reports. How does your model change to accommodate a shipboard receiver moving on a turbulent ocean? How long can the ship remain in communication using the same multi-hop path?Part Ⅳ: Prepare a short (1 to 2 pages) synopsis of your results suitable for publication as a short note in IEEE Communications Magazine.Your submission should consist of:One-page Summary Sheet,Two-page synopsis,Your solution of no more than 20 pages, for a maximum of 23 pages with your summary and synopsis.Note: Reference list and any appendices do not count toward the 23-page limit and should appear after your completed solution.中文赛题:多跳高频无线电传播背景:在高频时(HF,定义为3 - 30 mhz),无线电波可以通过电离层和地球的多次反射,传播很长的距离(从地球表面的一个点到地球表面的另一个遥远的点)。
AMCM85问题-A 动物群体的管理在一个资源有限,即有限的食物、空间、水等等的环境里发现天然存在的动物群体。
试选择一种鱼类或哺乳动物(例如北美矮种马、鹿、免、鲑鱼、带条纹的欧洲鲈鱼)以及一个你能获得适当数据的环境,并形成一个对该动物群体的捕获量的最佳方针。
AMCM85问题-B 战购物资储备的管理钴对许多工业是必不可少的(1979年仅国防需要就占了全世界钴生产量的17%),但是钴不产生在美国。
大部分钴来自政治上不稳定的构F地区。
见图85B-1,85B-2,85B-3。
1946年制订的战略和稀有作战物资存贮法令要求钴的储存量应保证美国能渡过三年战争时期。
50年代政府按要求存贮了,并在70年代卖掉了大部分贮量,而在70年代后期决定重新贮存,贮存的指标是8540万磅,到1982年获得了贮量的一半。
试建立一个战略金属钴的储存管理数学模型。
你需要考虑诸如以下的问题;贮量应多大?应以多大的比率来获得贮量?买这些金属的合理价格应该是多少?还要求你考虑诸如以下的问题,贮量达到多大时应开始减少贮存量?应以多大的比率来减少?卖出这些金属的合理价格应该是多少?应该怎样分配(附页中有关于钴的资源、价格、需求及再循环等方面的信息)关于钴有用信息:1985年政府计划需要2500万磅钴。
进行周而复始的生产经营,从而每年可生产600万磅钴。
1980年占总消耗量70银的120万磅钴再循环了,得到了重新处理。
AMCM86问题-A 水道测量数据表86A-1给出了在以码为单位的直角坐标为X,Y的水面一点处以英尺计的水Z.水深数据是在低潮时测得的。
船的吃水深度为5英尺。
在矩形区域(75,200)×(-50,150)里的哪些地方船要避免进入。
本题是由加州海军研究生院数学系的Richard Franke提供的,可阅他的论文Scattered Data Interpolation,Math,Comput.,38(1982),18l-200。
数学建模期末考试2018A试的题⽬与答案华南农业⼤学期末考试试卷(A卷)2012-2013学年第⼆学期考试科⽬:数学建模考试类型:(闭卷)考试考试时间:120 分钟学号姓名年级专业⼀、(满分12分)⼀⼈摆渡希望⽤⼀条船将⼀只狼.⼀只⽺.⼀篮⽩菜从河岸⼀边带到河岸对⾯.由于船的限制.⼀次只能带⼀样东西过河.绝不能在⽆⼈看守的情况下将狼和⽺放在⼀起;⽺和⽩菜放在⼀起.怎样才能将它们安全的带到河对岸去? 建⽴多步决策模型,将⼈、狼、⽺、⽩菜分别记为i = 1.2.3.4.当i在此岸时记x i = 1.否则为0;此岸的状态下⽤s =(x1.x2.x3.x4)表⽰。
该问题中决策为乘船⽅案.记为d = (u1, u2, u3, u4).当i 在船上时记u i = 1.否则记u i = 0。
(1) 写出该问题的所有允许状态集合;(3分)(2) 写出该问题的所有允许决策集合;(3分)(3) 写出该问题的状态转移率。
(3分)(4) 利⽤图解法给出渡河⽅案. (3分)解:(1) S={(1,1,1,1), (1,1,1,0), (1,1,0,1), (1,0,1,1), (1,0,1,0)} 及他们的5个反状(3分)(2) D = {(1,1,0,0), (1,0,1,0), (1,0,0,1), (1,0,0,0)} (6分)(3) sk+1 = sk+ (-1) k dk(9分)(4)⽅法:⼈先带⽺.然后回来.带狼过河.然后把⽺带回来.放下⽺.带⽩菜过去.然后再回来把⽺带过去。
或: ⼈先带⽺过河.然后⾃⼰回来.带⽩菜过去.放下⽩菜.带着⽺回来.然后放下⽺.把狼带过去.最后再回转来.带⽺过去。
(12分). .21、⼆、(满分12分) 在举重⽐赛中.运动员在⾼度和体重⽅⾯差别很⼤.请就下⾯两种假设.建⽴⼀个举重能⼒和体重之间关系的模型:(1)假设肌⾁的强度和其横截⾯的⾯积成⽐例。
6分(2)假定体重中有⼀部分是与成年⼈的尺⼨⽆关.请给出⼀个改进模型。

2018高教社杯全国大学生数学建模竞赛题目<请先阅读“全国大学生数学建模竞赛论文格式规范”)A题城市表层土壤重金属污染分析随着城市经济的快速发展和城市人口的不断增加,人类活动对城市环境质量的影响日显突出。
对城市土壤地质环境异常的查证,以及如何应用查证获得的海量数据资料开展城市环境质量评价,研究人类活动影响下城市地质环境的演变模式,日益成为人们关注的焦点。
按照功能划分,城区一般可分为生活区、工业区、山区、主干道路区及公园绿地区等,分别记为1类区、2类区、……、5类区,不同的区域环境受人类活动影响的程度不同。
现对某城市城区土壤地质环境进行调查。
为此,将所考察的城区划分为间距1公里左右的网格子区域,按照每平方公里1个采样点对表层土<0~10 厘M深度)进行取样、编号,并用GPS记录采样点的位置。
应用专门仪器测试分析,获得了每个样本所含的多种化学元素的浓度数据。
另一方面,按照2公里的间距在那些远离人群及工业活动的自然区取样,将其作为该城区表层土壤中元素的背景值。
附件1列出了采样点的位置、海拔高度及其所属功能区等信息,附件2列出了8种主要重金属元素在采样点处的浓度,附件3列出了8种主要重金属元素的背景值。
现要求你们通过数学建模来完成以下任务:(1> 给出8种主要重金属元素在该城区的空间分布,并分析该城区内不同区域重金属的污染程度。
(2> 通过数据分析,说明重金属污染的主要原因。
(3> 分析重金属污染物的传播特征,由此建立模型,确定污染源的位置。
(4> 分析你所建立模型的优缺点,为更好地研究城市地质环境的演变模式,还应收集什么信息?有了这些信息,如何建立模型解决问题?题目A题城市表层土壤重金属污染分析摘要:本文研究的是某城区警车配置及巡逻方案的制定问题,建立了求解警车巡逻方案的模型,并在满足D1的条件下给出了巡逻效果最好的方案。
在设计整个区域配置最少巡逻车辆时,本文设计了算法1:先将道路离散化成近似均匀分布的节点,相邻两个节点之间的距离约等于一分钟巡逻路程。
2018数学建模美赛题目
2018年数学建模美赛题目如下:
A题是多跳高频(HF)广播传播问题。
在高频(HF,定义为3-30 MHz)上,无线电波可以通过电离层和地球以外的多次反射传播很长的距离。
对于低于最大可用频率(MUF)的频率,来自地面源的HF无线电波从电离层反射回地球,在此它们可能再次反射回电离层,在此又可能反射回地球,依此类推。
随着每个连续的跃点走得更远。
除其他因素外,反射表面的特性决定了反射波的强度以及信号最终传播的距离,同时又保持了有用的信号完整性。
而且,MUF随季节、一天中的时间和太阳条件而变化。
MUF上方的频率不会被反射/折射,而是通过电离层进入太空。
在这个问题中,重点特别放在
海洋表面的反射上。
C题是能源生产问题。
能源生产和使用是任何经济结构的主要部分。
这个问题提供了一个数据集,包含了美国四个州在过去50年的能源生产和消费数据,以及一些人口和经济信息。
参赛者需要使用这些数据来回答以下问题:这四个州的能源生产和消费模式有何不同?这些模式如何随时间变化?这些模式如何与人口和经济活动相关联?如何预测未来的能源生产和消费趋势?如何优化能源生产和消费以减少对环境的影响?
以上内容仅供参考,建议查阅美赛官网获取更准确的信息。

常见女性身体形态:
苹果梨形沙漏报纸
不同体型的区别特点是身体脂肪堆积的部位不同,在女性减脂塑型的过程中,通过合理地安排力量训练与有氧训练的内容,能够达到科学高效的改变,最终拥有理想的身材。
苹果型体型的特点:
1、下肢没有特殊肥大。
2、肩围、腰围、臀围近乎相等,明显大于两条大腿相加的围度。
3、
梨形体型的特点:
1、肩围小于胸围和腰围臀围。
2、胸围小于腰围,腰围小于臀围。
3、臀围是整个身体最肥大的地方。
1、胸部饱满。
2、腰部纤细。
3
1、整体很瘦削。
2、肩围、胸围、腰围、臀围相差不大。
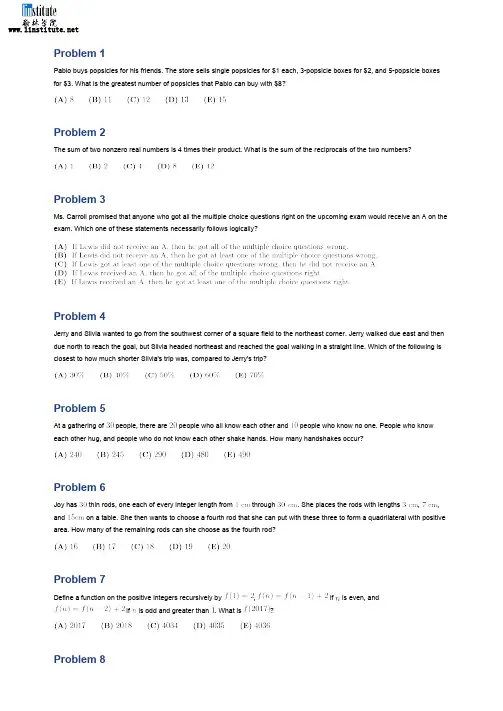
Problem 1Pablo buys popsicles for his friends. The store sells single popsicles for $1 each, 3-popsicle boxes for $2, and 5-popsicle boxes for $3. What is the greatest number of popsicles that Pablo can buy with $8?Problem 2The sum of two nonzero real numbers is 4 times their product. What is the sum of the reciprocals of the two numbers?Problem 3Ms. Carroll promised that anyone who got all the multiple choice questions right on the upcoming exam would receive an A on the exam. Which one of these statements necessarily follows logically?Problem 4Jerry and Silvia wanted to go from the southwest corner of a square field to the northeast corner. Jerry walked due east and then due north to reach the goal, but Silvia headed northeast and reached the goal walking in a straight line. Which of the following is closest to how much shorter Silvia's trip was, compared to Jerry's trip?Problem 5At a gathering of people, there are people who all know each other and people who know no one. People who know each other hug, and people who do not know each other shake hands. How many handshakes occur?Problem 6Joy has thin rods, one each of every integer length from through . She places the rods with lengths , , and on a table. She then wants to choose a fourth rod that she can put with these three to form a quadrilateral with positive area. How many of the remaining rods can she choose as the fourth rod?Problem 7Define a function on the positive integers recursively by , if is even, andif is odd and greater than . What is ?Problem 8The region consisting of all points in three-dimensional space within units of line segment has volume . What is the length ?Problem 9Let be the set of points in the coordinate plane such that two of the three quantities , , and are equal and the third of the three quantities is no greater than the common value. Which of the following is a correct description of ?Problem 10Chloé chooses a real number uniformly at random from the interval . Independently, Laurent chooses a real number uniformly at random from the interval . What is the probability that Laurent's number is greater than Chloe's number?Problem 11Claire adds the degree measures of the interior angles of a convex polygon and arrives at a sum of . She then discovers that she forgot to include one angle. What is the degree measure of the forgotten angle?Problem 12There are horses, named Horse 1, Horse 2, , Horse 10. They get their names from how many minutes it takes them to run one lap around a circular race track: Horse runs one lap in exactly minutes. At time 0 all the horses are together at the starting point on the track. The horses start running in the same direction, and they keep running around the circular track at their constant speeds. The least time , in minutes, at which all horses will gain simultaneously be at the starting point is . Let be the least time, in minutes, such that at least of the horses are again at the starting point. What is the sum of the digits of ?Problem 13Driving at a constant speed, Sharon usually takes minutes to drive from her house to her mother's house. One day Sharonbegins the drive at her usual speed, but after driving of the way, she hits a bad snowstorm and reduces her speed by miles per hour. This time the trip takes her a total of minutes. How many miles is the drive from Sharon's house to her mother's house?Problem 14Alice refuses to sit next to either Bob or Carla. Derek refuses to sit next to Eric. How many ways are there for the five of them to sit in a row of chairs under these conditions?Problem 15Let , using radian measure for the variable . In what interval does the smallest positive value of for which lie?Problem 16In the figure below, semicircles with centers at and and with radii 2 and 1, respectively, are drawn in the interior of, and sharing bases with, a semicircle with diameter . The two smaller semicircles are externally tangent to each other and internally tangent to the largest semicircle. A circle centered at is drawn externally tangent to the two smaller semicircles and internally tangent to the largest semicircle. What is the radius of the circle centered at ?Problem 17There are different complex numbers such that . For how many of these is a real number?Problem 18Let equal the sum of the digits of positive integer . For example, . For a particular positive integer , . Which of the following could be the value of ?Problem 19A square with side length is inscribed in a right triangle with sides of length , , and so that one vertex of the square coincides with the right-angle vertex of the triangle. A square with side length is inscribed in another right triangle with sides of length , , and so that one side of the square lies on the hypotenuse of the triangle. What is ?Problem 20How many ordered pairs such that is a positive real number and is an integer between and , inclusive, satisfy the equationProblem 21A set is constructed as follows. To begin, . Repeatedly, as long as possible, if is an integer root of some polynomial for some , all of whose coefficients are elements of , then is put into . When no more elements can be added to , how many elements does have?Problem 22A square is drawn in the Cartesian coordinate plane with vertices at , , , . A particle starts at . Every second it moves with equal probability to one of the eight lattice points (points with integer coordinates) closest to its current position, independently of its previous moves. In other words, the probability is that the particle will move from to each of , , , , , , , or . The particle will eventually hit the square for the first time, either at one of the 4 corners of the square or at one of the 12 lattice points in the interior of one of the sides of the square. The probability that it will hit at a corner rather than at an interior point of a side is , where and are relatively prime positive integers. What is ?Problem 23For certain real numbers , , and , the polynomial has three distinct roots, and each root of isalso a root of the polynomial What is ?Problem 24Quadrilateral is inscribed in circle and has side lengths , and . Let and be points onsuch that and . Let be the intersection of line and the line through parallel to . Let be the intersection of line and the line through parallel to . Let be the point on circle other than that lies on line . What is ?Problem 25The vertices of a centrally symmetric hexagon in the complex plane are given byFor each , , an element is chosenfrom at random, independently of the other choices. Let be the product of the numbers selected. What is the probability that ?。
2018a数学建模题目摘要:一、引言1.介绍数学建模竞赛2.简述2018 年数学建模竞赛的总体情况二、竞赛题目1.题目概述2.题目一:网络舆情分析a.题目背景b.问题描述c.分析与建模d.模型求解与结果分析e.结论3.题目二:航空物流网络设计a.题目背景b.问题描述c.分析与建模d.模型求解与结果分析e.结论4.题目三:城市空气污染分析与治理a.题目背景b.问题描述c.分析与建模d.模型求解与结果分析e.结论三、竞赛过程与要求1.竞赛时间安排2.竞赛要求3.评分标准四、竞赛成果与影响1.获奖情况2.成果应用与推广3.对我国数学建模发展的意义五、总结1.2018 年数学建模竞赛的亮点与不足2.对未来数学建模竞赛的展望正文:一、引言数学建模竞赛是检验学生应用数学知识解决实际问题的能力的一项重要赛事,每年都吸引着大量的高校学生参与。
2018 年的数学建模竞赛在众多队伍的积极参与下圆满落幕。
本文将详细介绍2018 年数学建模竞赛的总体情况,并重点分析其中的三个竞赛题目。
二、竞赛题目2018 年数学建模竞赛共设有三个题目,分别是网络舆情分析、航空物流网络设计和城市空气污染分析与治理。
1.题目概述题目一:网络舆情分析随着互联网的普及,网络舆情对人们的生活、工作和决策产生越来越大的影响。
本题要求参赛者针对给定的网络数据,建立合适的数学模型,分析网络舆情的发展趋势和影响力。
题目二:航空物流网络设计航空物流是现代物流体系的重要组成部分,如何优化航空物流网络以提高运输效率和降低成本是亟待解决的问题。
本题要求参赛者构建航空物流网络模型,以满足运输需求的同时,实现物流成本最小化。
题目三:城市空气污染分析与治理城市空气污染已成为我国面临的重要环境问题之一。
本题要求参赛者分析城市空气污染的成因,建立空气污染治理模型,为政府部门提供合理的治理措施。
2.题目详解(1)题目一:网络舆情分析a.题目背景:网络舆情是反映社会公众对某一事件、观点或现象的态度和看法的集合。
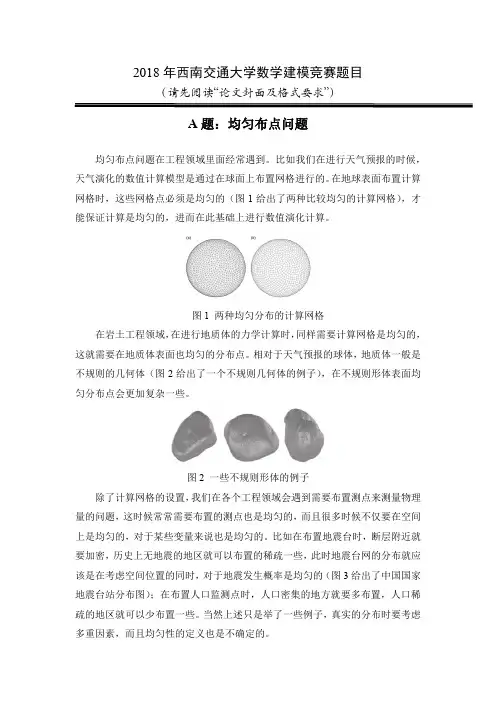
2018年西南交通大学数学建模竞赛题目(请先阅读“论文封面及格式要求”)A题:均匀布点问题均匀布点问题在工程领域里面经常遇到。
比如我们在进行天气预报的时候,天气演化的数值计算模型是通过在球面上布置网格进行的。
在地球表面布置计算网格时,这些网格点必须是均匀的(图1给出了两种比较均匀的计算网格),才能保证计算是均匀的,进而在此基础上进行数值演化计算。
图1 两种均匀分布的计算网格在岩土工程领域,在进行地质体的力学计算时,同样需要计算网格是均匀的,这就需要在地质体表面也均匀的分布点。
相对于天气预报的球体,地质体一般是不规则的几何体(图2给出了一个不规则几何体的例子),在不规则形体表面均匀分布点会更加复杂一些。
图2 一些不规则形体的例子除了计算网格的设置,我们在各个工程领域会遇到需要布置测点来测量物理量的问题,这时候常常需要布置的测点也是均匀的,而且很多时候不仅要在空间上是均匀的,对于某些变量来说也是均匀的。
比如在布置地震台时,断层附近就要加密,历史上无地震的地区就可以布置的稀疏一些,此时地震台网的分布就应该是在考虑空间位置的同时,对于地震发生概率是均匀的(图3给出了中国国家地震台站分布图);在布置人口监测点时,人口密集的地方就要多布置,人口稀疏的地区就可以少布置一些。
当然上述只是举了一些例子,真实的分布时要考虑多重因素,而且均匀性的定义也是不确定的。
图3 中国国家地震台站分布图请建立数学模型回答以下问题:1、如何在标准的球面上均匀分布测点?如何度量测点分布的均匀性?请给出球面点分布均匀性的度量标准并给出在此标准下最佳的球面均匀分布点的方法及结果。
2、若为非规则几何体,给出任意几何形体表面均匀分布点的数学模型。
3、在地震及环境工程等领域,在分布监测点时,多考虑一个影响因素(如地震发生概率、人口密度等等),建立数学模型,使测点分布也是“均匀”的。
PROBLEM A: The Leaves of a Tree"How much do the leaves on a tree weigh " How might one estimate the actual weight of the leaves or for that matter any other parts of the tree How might one classify leaves Build a mathematical model to describe and classify leaves. Consider and answer the following:• Why do leaves have the various shapes that they have• Do the shapes “minimize” overlapping individual shadows that are cast; so as to maximize exposure Does the distribution of leaves within the “volume” of the tree and its branches effect the shape• Speaking of profiles; is leaf shape general characteristics related to tree profile/branching structure• How would you estimate the leaf mass of a tree Is there a correlation between the leaf mass and the size characteristics of the tree height; mass; volume defined by the profileIn addition to your one page summary sheet prepare a one page letter to an editor of a scientific journal outlining your key findings.“多少钱树的叶子有多重” 怎么可能估计的叶子或树为此事的任何其他部分的实际重量会如何分类的叶子吗建立了一个数学模型来描述和分类的叶子..考虑并回答下列问题:•为什么叶片有;他们有各种形状•请勿形状的“最小化”个人投阴影重叠;以便最大限度地曝光吗树叶树及其分支机构在“量”的分布效应的形状说起型材;叶形一般特征有关的文件树/分支结构你将如何估计树的叶质量有叶的质量和树的大小特性配置文件中定义的高度;质量;体积之间的关系吗除了你一个页面的汇总表;准备一页纸的信中列出您的主要结果的一个科学杂志的编辑..PROBLEM B: Camping along the Big Long RiverVisitors to the Big Long River 225 miles can enjoy scenic views and exciting white water rapids. The river is inaccessible to hikers; so the only way to enjoy it is to take a river trip that requires several days of camping. River trips all start at First Launch and exit the river at Final Exit; 225 miles downstream. Passengers take either oar- powered rubber rafts; which travel on average 4 mph or motorized boats; which travel on average 8 mph. The trips range from 6 to 18 nights of camping on the river; start to finish.. The government agency responsible for managing this river wants every trip to enjoy a wilderness experience; with minimal contact with other groups of boats on the river. Currently; X trips travel down the Big Long River each year during a six month period the rest of the year it is too cold for river trips. There are Y camp sites on the Big Long River; distributed fairly uniformly throughout the river corridor. Given the rise in popularity of river rafting; the park managers have been asked to allow more trips to travel down the river. They want to determine how they might schedule an optimal mix of trips; of varying duration measured in nights on the river and propulsion motor or oar that will utilize the campsites inthe best way possible. In other words; how many more boat trips could be added to the Big Long River’s rafting season The river managers have hired you to advise them on ways in which to develop the best schedule and on ways in which to determine the carrying capacity of the river; remembering that no two sets of campers can occupy the same site at the same time. In addition to your one page summary sheet; prepare a one page memo to the managers of the river describing your key findings.大隆河225公里的游客可以欣赏优美的景色和令人兴奋的白色水流湍急..这条河是无法去踏青;那么享受它的唯一途径是采取一河之旅;需要数天的露营..所有河流的旅行开始首次启动和退出在最后的出口;下游225英里的河流..乘客采取要么桨为动力的胶筏;平均4英里或机动船;其中8英里每小时平均旅行旅行..TRIPS协定的范围从河上露营的6至18晚;开始到结束...... 政府机构;负责管理这条河要享受旷野的经验;与其他团体的河上的船最小的接触;每一个行程..目前;X人次前往大长江每年在六个月内在今年余下时间;实在是太寒冷的河流人次..有Ÿ营地相当均匀地分布在整个河流廊道;大朗河..鉴于漂流在河的知名度上升;公园管理人员已被要求让更多人次前往顺流而下..他们希望以确定它们如何可能的时间长短不一在河上的晚来衡量和推进器马达或桨在尽可能最好的方式;将利用该营地;安排行程的最佳组合..换句话说;有多少可以添加到更多乘船游览大朗河的漂流季节河经理已经聘请你;向他们就如何在其中发展最好的时间表;并就如何在确定河流的承载能力;记住;没有两套营员们可以在同一时间占据同一站点..另外给你一个页面汇总表;准备一个页的备忘录描述你的主要结果的河流的管理者..。
2018数学建模a题优秀论文土壤重金属的污染对于人类的生存环境造成了严重的威胁,研究其分布与来源对保护人类健康、创造良好的生态环境具有重要意义。
本文分析了重金属污染物的分布及其传播特征,借助最速下降法的思想建立了重金属传播轨迹模型,找到了其污染源。
本文首先利用三次卷积插值法得到8种重金属污染物的空间分布等值线图。
其次,利用模糊理论对所给数据进行统计分析,得到各个小区的污染物关于四级污染标准的隶属度。
由权重与隶属度矩阵的乘积并归一化得到综合模糊综合评价矩阵。
据此,得出319个小区域的污染级别。
结果显示,主干道路区和工业区的污染较为严重,重度污染面积达到了9%以上。
基于模糊综合评价矩阵,本文做出了8种重金属污染物在5类区域中的平均含量的直方图。
然后,利用因子分析法将8种污染物分为3类:汞;镉、铜、锌、铅;镍、铬、砷。
直方图的分析结果显示,峰值地区的重金属污染物属于前两类。
同时,直方图显示,只有汞、镉、铜、锌四种重金属对该城区造成严重污染,与汽车尾气及工业三废的排放产生的污染物成分一致。
故推断汽车尾气和工业三废是造成该城区的重金属污染的原因。
在分析对该城区造成严重污染的四种重金属的传播特征的基础上,忽略地形对重金属传播的影响,借助最速下降法的思想,通过线性拟合,得到其传播轨迹,通过回归溯源确定了多个污染源。
最终取它们的中心作为对实际污染源位置的近似。
本文得到问题三的结果是:铜的两个污染源分别是以(2260.42,3903.29)和(3304.2,5919.36)为圆心,以88.47m和88.47m为半径的圆;锌的两个污染源分别是以(9256.26,4268.60)和(3329.41,5762.07)为圆心,以357.78m 和197.68m为半径的圆;汞的两个污染源分别是以(13687.47,2308.22)和(2390.84,2770.97)为圆心,以121.75m和3m为半径的圆;镉的两个污染源分别是以(2218.65,2983.38)和(3565.17,5880.85)为圆心,以462m和167.8m为半径的圆。
2018年数学建模国赛a讲解摘要:一、2018 年数学建模国赛A 题概述二、2018 年数学建模国赛A 题解题思路三、2018 年数学建模国赛A 题获奖经历分享四、2022 年数学建模国赛A 题解题思路及赛前准备五、总结正文:一、2018 年数学建模国赛A 题概述2018 年数学建模国赛A 题的主题是集成电路板焊接工艺的优化。
题目要求参赛者通过机理模型分析,对回焊炉的各部分保持工艺要求的温度,从而保证产品质量。
这个问题涉及到预热区、恒温区、回流区和冷却区等多个温区的控制,需要运用数学建模的方法进行分析和求解。
二、2018 年数学建模国赛A 题解题思路在解决这个问题时,参赛者需要首先了解回焊炉的工作原理和焊接工艺的要求。
然后,通过建立数学模型,分析各个温区之间的热传递和热量分布,从而找出合适的控制策略。
具体来说,可以采用有限元分析方法对回焊炉内的温度分布进行数值模拟,然后根据模拟结果调整各个温区的温度设置,以满足工艺要求。
三、2018 年数学建模国赛A 题获奖经历分享一位参赛者在2018 年数学建模国赛中获得了国家级一等奖。
他分享了自己的参赛经历和心得,表示自己在接触数模到参赛只有一个月左右的时间,能获得这个成绩很大程度上要感谢两位认真负责、经验丰富的队友。
他们每个人都付出了很大的努力,充分利用课余时间进行讨论和研究,最终取得了优异的成绩。
四、2022 年数学建模国赛A 题解题思路及赛前准备对于即将参加2022 年数学建模国赛A 题的参赛者,可以参考2018 年的题目和解题思路,学习借鉴前辈的经验。
同时,还需要做好赛前准备,加强数学建模方法和技巧的学习,提高自己的分析和解决问题的能力。
此外,团队协作和沟通也是取得好成绩的关键,参赛者需要与队友紧密配合,共同攻克难题。
五、总结数学建模国赛是一个锻炼学生综合素质和创新能力的平台,通过参加这个比赛,学生可以学到很多课堂上学不到的知识和技能。
同时,这个比赛也是一个展示自己才华的机会,参赛者可以通过获得奖项来提升自己的竞争力。
2018a数学建模题目以下是2018年美国大学生数学建模竞赛(MCM/ICM)的A题:A题:群体中的领导力问题描述:在许多动物和人类社会中,领导力是一个关键的概念。
领导力可以影响群体的行为、决策和组织结构。
例如,一个狮子的领导力可以决定整个狮群的捕猎策略,一个公司的领导力可以影响整个公司的方向和战略。
然而,领导力是如何产生的,以及它如何影响群体行为,仍然是一个未解决的问题。
任务要求:1. 建立一个数学模型,描述在动物或人类社会中领导力的产生和维持。
2. 使用你的模型来解释一些关于领导力的观察结果,例如为什么某些个体在群体中成为领导者,或者为什么某些领导者能够保持其地位。
3. 基于你的模型,提出一些关于如何最好地发展和提升领导力的建议。
4. 对于你的模型,提供一些可能的实证方法来验证其预测和假设。
问题分析:首先,我们需要明确领导力的定义和特性。
在动物和人类社会中,领导力通常与一些特定的行为、能力和品质相关,如智慧、勇气、经验、社交技能等。
这些特性可以通过遗传和环境因素获得,并在个体间存在差异。
其次,我们需要考虑领导力的产生和维持机制。
这可能涉及到个体的竞争、合作、学习和适应等行为。
例如,一些个体可能通过展示出更高的智慧或能力来获得其他个体的尊重和信任,从而成为领导者。
此外,领导者可能通过有效的沟通和协调来维持其地位。
最后,我们需要将领导力与群体行为和决策联系起来。
领导力可以影响群体的目标、策略和组织结构,从而影响群体的生存和繁衍。
例如,一个明智的领导者可能能够带领群体做出更好的决策,从而提高群体的生存机会。
在建立数学模型时,我们可以考虑使用网络模型、演化博弈论、决策理论等工具。
例如,我们可以建立一个网络模型来描述个体间的互动和关系,然后使用演化博弈论来模拟领导力的产生和维持过程。
我们还可以使用决策理论来分析领导者如何做出更好的决策。
在解释观察结果时,我们可以使用我们的模型来模拟不同情况下的领导力行为,并比较模拟结果与实际观察结果。
华南农业大学期末考试试卷(A卷)2012-2013学年第二学期考试科目:数学建模考试类型:(闭卷)考试考试时间:120 分钟学号姓名年级专业题号一二三四五六七八总分得分评阅人得分一、(满分12分)一人摆渡希望用一条船将一只狼.一只羊.一篮白菜从河岸一边带到河岸对面.由于船的限制.一次只能带一样东西过河.绝不能在无人看守的情况下将狼和羊放在一起;羊和白菜放在一起.怎样才能将它们安全的带到河对岸去? 建立多步决策模型,将人、狼、羊、白菜分别记为i = 1.2.3.4.当i在此岸时记x i = 1.否则为0;此岸的状态下用s =(x1.x2.x3.x4)表示。
该问题中决策为乘船方案.记为d = (u1, u2, u3, u4).当i在船上时记u i = 1.否则记u i = 0。
(1) 写出该问题的所有允许状态集合;(3分)(2) 写出该问题的所有允许决策集合;(3分)(3) 写出该问题的状态转移率。
(3分)(4) 利用图解法给出渡河方案. (3分)解:(1)S={(1,1,1,1),(1,1,1,0),(1,1,0,1),(1,0,1,1),(1,0,1,0)}及他们的5个反状(3分)(2) D = {(1,1,0,0), (1,0,1,0), (1,0,0,1), (1,0,0,0)} (6分)(3) s k+1 = s k + (-1) k d k (9分)(4)方法:人先带羊.然后回来.带狼过河.然后把羊带回来.放下羊.带白菜过去.然后再回来把羊带过去。
或: 人先带羊过河.然后自己回来.带白菜过去.放下白菜.带着羊回来.然后放下羊.把狼带过去.最后再回转来.带羊过去。
(12分)得分1、二、(满分12分)在举重比赛中.运动员在高度和体重方面差别很大.请就下面两种假设.建立一个举重能力和体重之间关系的模型:(1)假设肌肉的强度和其横截面的面积成比例。
6分(2)假定体重中有一部分是与成年人的尺寸无关.请给出一个改进模型。
数学建模竞赛(MCM / ICM)汇总表基于细胞的高速公路交通模型自动机和蒙特卡罗方法总结基于元胞自动机和蒙特卡罗方法,我们建立一个模型来讨论“靠右行〞规如此的影响。
首先,我们打破汽车的运动过程和建立相应的子模型car-generation的流入模型,对于匀速行驶车辆,我们建立一个跟随模型,和超车模型。
然后我们设计规如此来模拟车辆的运动模型。
我们进一步讨论我们的模型规如此适应靠右的情况和,不受限制的情况, 和交通情况由智能控制系统的情况。
我们也设计一个道路的危险指数评价公式。
我们模拟双车道高速公路上交通(每个方向两个车道,一共四条车道),高速公路双向三车道〔总共6车道)。
通过计算机和分析数据。
我们记录的平均速度,超车取代率、道路密度和危险指数和通过与不受规如此限制的比拟评估靠右行的性能。
我们利用不同的速度限制分析模型的敏感性和看到不同的限速的影响。
左手交通也进展了讨论。
根据我们的分析,我们提出一个新规如此结合两个现有的规如此(靠右的规如此和无限制的规如此)的智能系统来实现更好的的性能。
1介绍1.1术语1.2假设2模型2.1设计的元胞自动机2.2流入模型2.4超车模型2.4.1超车概率2.4.2超车条件2.5两套规如此CA模型2.5.1靠右行3补充分析模型加速和减速概率分布的设计设计来防止碰撞4模型实现与计算机5数据分析和模型验证快车的平均速度5.3密度5.5危险指数6在不同速度限制下敏感性评价模型7驾驶在左边8交通智能系统8.1智能系统的新规如此8.3智能系统结果9结论10优点和缺点10.2弱点引用附录。
1 Introduction今天,大约65%的世界人口生活在右手交通的国家和35%在左手交通的国家交通流量。
[worldstandards。
欧盟,2013] 右手交通的国家,比如美国和中国,法规要求驾驶在靠路的右边行走。
多车道高速公路在这些国家经常使用一个规如此,要求司机在最右边开车除非他们超过另一辆车,在这种情况下,他们移动到左边的车道、通过,返回到原来的车道。
2018 MCMProblem C: Energy ProductionBackground: Energy production and usage are a major portion of any economy. In the United States, many aspects of energy policy are decentralized to the state level. Additionally, the varying geographies and industries of different states affect energy usage and production. In 1970, 12 western states in the U.S. formed the Western Interstate Energy Compact (WIEC), whose mission focused on fostering cooperation between these states for the development and management of nuclear energy technologies. An interstate compact is a contractual arrangement made between two or more states in which these states agree on a specific policy issue and either adopt a set of standards or cooperate with one another on a particular regional or national matter. Problem: Along the U.S. border with Mexico, there are four states – California (CA), Arizona (AZ), New Mexico (NM), and Texas (TX) – that wish to form a realistic new energy compact focused on increased usage of cleaner, renewable energy sources. Your team has been asked by the four governors of these states to perform data analysis and modeling to inform their development of a set of goals for their interstate energy compact.The attached data file “ProblemCData.xlsx” provides in the first worksheet (“seseds”) 50 years of data in 605 variables on each of these four states’ energy production and consumption, along with some demographic and economic information. The 605 variable names used in this dataset are defined in the second worksheet (“msncodes”).Part I:A. Using the data provided, create an energy profile for each of the four states.B. Develop a model to characterize how the energy profile of each of the four states has evolved from 1960 – 2009. Analyze and interpret the results of your model to address the four states’usage of cleaner, renewable energy sources in a way that is easily understood by the governors and helps them to understand the similarities and difference between the four states. Include in your discussion possible influential factors of the similarities and differences (e.g. geography, industry, population, and climate).C. Determine which of the four states appeared to have the “best” profile for use of cleaner, renewable energy in 2009. Explain your criteria and choice.D. Based on the historical evolution of energy use in these states, and your understanding of the differences between the state profiles you established, predict the energy profile of each state, as you have defined it, for 2025 and 2050 in t he absence of any policy changes by each governor’s office.Part II:A. Based on your comparison between the four states, your crite ria for “best” profile, and your predictions, determine renewable energy usage targets for 2025 and 2050 and state them as goals for this new four-state energy compact.B. Identify and discuss at least three actions the four states might take to meet their energy compact goals.Part III:Prepare a one-page memo to the group of Governors summarizing the state profiles as of 2009, your predictions with regard to energy usage absent any policy changes, and your recommended goals for the energy compact to adopt.Your submission should consist of:∙One-page Summary Sheet,∙One-page memo,∙Your solution of no more than 20 pages, for a maximum of 22 pages with your summary and memo.∙Note: Reference list and any appendices do not count toward the 22-page limit and should appear after your completed solution.Attachments:ProblemCData.xlsxIncludes two worksheets seseds and msncodes.References:State Energy Data System (SEDS) Complete Dataset through 2009 (All 50 states)https:///dataset/state-energy-data-system-seds-complete-dataset-through-2009#sec-dates。
2018MCM
Problem A: 多跳短波无线电传播
背景:在高频率(HF,定义为3 - 30兆赫),无线电波可以长途旅行(从地球表面的
一个点到地球表面的另一个遥远的地方)通过电离层和地球以外的多次反射。
下面的最高可用频率(MUF),高频无线电波从地面源反映了电离层返回地球,在那里他们可以
再次回到电离层反射,在那里他们可以再次回到地球的反映,等等,旅行还与每个连
续跳。
在其他因素中,反射表面的特性决定了反射波的强度,以及信号在保持有用信
号完整性的情况下最终会传播多远。
而且,随着季节的变化,白天的时间和太阳的条
件也不同。
上面的MUF频率不是反射和折射,但通过电离层进入太空。
在这个问题上,重点特别是海面上的反射。
经验发现,在汹涌的海洋中,反射比平静的海面上的反射
减弱。
海洋湍流将影响海水的电磁梯度,改变海洋的局部介电常数和磁导率,改变反
射面的高度和角度。
一个汹涌的海洋,其中浪高、形状和频率变化很快,波的传播方向也可能改变。
问题:
第一部分:建立海洋信号反射的数学模型。
一个100瓦的高频恒定载波信号,低于MUF,从陆地上的点源,确定第一反射强度和湍流海洋用了平静的海洋的第一反射强度的比较。
(注意,这意味着这个信号在电离层上有一次反射)如果额外的反射(2到n)在平静
的海洋上发生,那么信号在强度低于可用的信噪比(SNR)阈值10分贝之前,可以达到的最大跳数是多少?
第二部分:你如何从第一部分的调查结果与HF反射在山区或崎岖的地形与光滑的地形
比较?
第三部分:穿越海洋的船将使用短波进行通信,并接收天气和交通报告。
你的模型如何改变以适应船上的接收器在湍流的海洋上行驶?使用相同的多跳路径,船舶能保持多长时间通信?
第四部分:准备一份简短的(1到2页)你的结果概要,适合作为IEEE通讯杂志中的简短说明发表。
您的提交应包括:
•一页摘要表,
•两页简介,
•你的解决方案不超过20页,最多有23页的摘要和概要。
注:参考清单和任何附录不计入23页的限制,并应在您完成的解决方案之后出现。