五一数学建模2016年-C题-中文版
- 格式:doc
- 大小:24.50 KB
- 文档页数:1
数学模型课程期末大作业题要求:1)该类题目大部分为优划问题,有一些差分方程,微分方程问题,要求提交一篇完整格式的建模论文,文字使用小四号宋体,公式用word的公式编辑器编写,正文中不得出现程序以及程序冗长的输出结果,程序以附录形式附在论文的后面,若为规划求解必须用lingo集合形式编程,其它可用Matlab或Mathmatica编写。
2)论文以纸质文档提交,同时要交一份文章和程序电子文档,由班长统一收上来,我要验证程序。
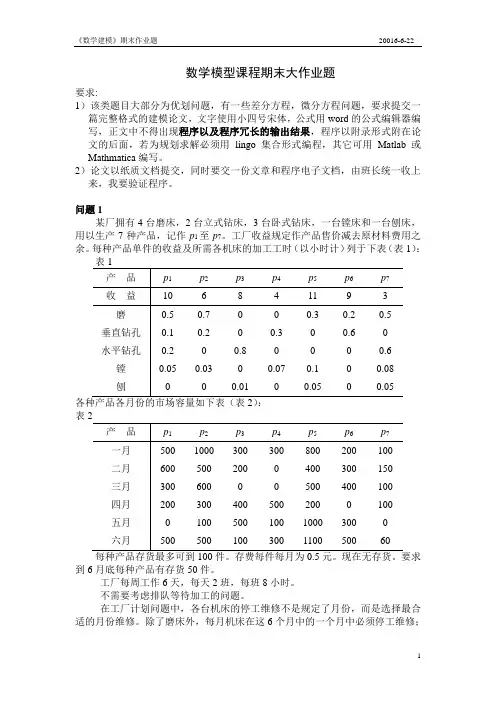
问题1某厂拥有4台磨床,2台立式钻床,3台卧式钻床,一台镗床和一台刨床,用以生产7种产品,记作p1至p7。
工厂收益规定作产品售价减去原材料费用之余。
每种产品单件的收益及所需各机床的加工工时(以小时计)列于下表(表1):表到6月底每种产品有存货50件。
工厂每周工作6天,每天2班,每班8小时。
不需要考虑排队等待加工的问题。
在工厂计划问题中,各台机床的停工维修不是规定了月份,而是选择最合适的月份维修。
除了磨床外,每月机床在这6个月中的一个月中必须停工维修;6个月中4台磨床只有2台需要维修。
扩展工厂计划模型,以使可作上述灵活安排维修时间的决策。
停工时间的这种灵活性价值若何?注意,可假设每月仅有24个工作日。
问题2:在某给定区域内均匀分布若干个几何形状相同的小区域(小区域为边长a的正三角形)。
在每个区域中心安排一个寻呼台,管理部门将拿出一贯频域区间由于安排这些寻呼台,这个频域区间被规则地分成若干频域区间,分别被依次标号为:1、2、3、……,每一个寻呼台被分配给一个具有标号的频率小区间,只要不相互干扰,标号相同的频域小区间可以被分配多个寻呼台使用,为了避免干扰,在安排过程中,应满足以下要求:1)、距离为2a以内的两个寻呼台的编号至少必须相差2,在4a以内的寻呼台编号不能相同;2)、除1)以外并考虑三角形区域在三个方向任意延伸的情况;3)、除条件1),2)外,但要求距离在2a以内的寻呼台编号至少相差R,此时能够得到什么结果?请你在上述各种情况条件下建立数学模型,确立需要的频域区间的最小长度,即要求给出各种不同分配方案中所使用的最大编号达到最小。

Contents1.Introduction (1)1.1 Background (1)1.2 Foundation & ROI (1)2 Task (1)3 Fundamental assumptions (2)4 Definitions and Notations (2)5 Models (3)5.1 Filter data (3)5.2 Object Selection Model (Grey Relational Analysis) (4)5.2.1 Model analysis (4)5.2.2 Model solution (4)5.3 ROI Model (Principal Component Analysis) (5)5.3.1 Model analysis (5)5.3.2 Model solution (6)5.4 Verify the possibility (9)5.4.1 Comparison (9)5.4.2 External factor (10)5.5 Investment Forecast Model (11)5.5.1 Linear Regression Forecasting Model (11)5.5.2 School potential Prediction (TOPSIS) (12)5.5.3 Final investment (TOPSIS) (13)6 Conclusions (16)7 Strengths and Weaknesses (18)7.1 Strengths (19)7.2 Weaknesses (20)8 Letter to Mr. Alpha Chiang (21)9 References (22)Team # 44952 Page 1 of 221 Introduction1.1 BackgroundThe Goodgrant Foundation is a charitable organization that wants to help improve educational performance of undergraduates attending colleges and universities in the United States. To do this, the foundation intends to donate a total of $100,000,000 (US100 million) to an appropriate group of schools per year, for five years, starting July 2016. In doing so, they do not want to duplicate the investments and focus of other large grant organizations such as the Gates Foundation and Lumina Foundation.Our team has been asked by the Goodgrant Foundation to develop a model to determine an optimal investment strategy that identifies the schools, the investment amount per school, the return on that investment, and the time duration that the organi zation’s money should be provided to have the highest likelihood of producing a strong positive effect on student performance. This strategy should contain a 1 to N optimized and prioritized candidate list of schools you are recommending for investment bas ed on each candidate school’s demonstrated potential for effective use of private funding, and an estimated return on investment (ROI) defined in a manner appropriate for a charitable organization such as the Goodgrant Foundation.1.2 Foundation & ROIFoundation (charitable foundation) refers to the nonprofit legal person who uses the property of the natural persons, legal persons or other organizations to engage in public welfare undertakings. In terms of its nature, foundation is a kind of folk non-profit organizations.ROI is a performance measure used to evaluate the efficiency of an investment or to compare the efficiency of a number of different investments. ROI measures the amount of return on an investment relative to the investment’s cost. To calculate ROI, the benefit (or return) of an investment is divided by the cost of the investment, and the result is expressed as a percentage or a ratio.2 Task●One-page summary for our MCM submission●Using our models to achieve the candidate list of schools●Calculate the time durati on that the organization’s money should be provided to have thehighest likelihood of producing a strong positive effect on student performance●Calculate the investment amount Goodgrant Foundation would pay for each school●Calculate the ROI of the Goodgrant Foundation●Forecast the development of this kind of investment mode●Write a letter to the CFO of the Goodgrant Foundation, Mr. Alpha Chiang, that describesthe optimal investment strategy。

191])()([),(20200y y x x r z y x z -+--=c y b x a y x y x z +⋅+⋅++=22),(4753⨯41i D i D 20.000160.001162021421339915152112032534791410.1 6660.1 2.5 2.666.11212.12525.16060.1/mcm05/probX 53⨯47Y 53⨯47k n m Z ⨯53⨯47 k n m Z ⨯~53⨯47i n m k H ⨯m m n k n 21n +120i n m k S ⨯i D126 18319719141164512X Y⎪⎪⎪⎭⎫ ⎝⎛=⨯⨯⨯⨯⨯⨯47532531534712111..................x x x x x x X ⎪⎪⎪⎭⎫⎝⎛⨯⨯⨯⨯⨯⨯47532531534712111..................y y y y y y),(y x Z =mnk ⎪⎪⎪⎭⎫⎝⎛⨯⨯⨯⨯⨯⨯⨯⨯⨯⨯⨯⨯),(...),,(),,(............),(...),,(),,(4753475325325315315347147121211111y x f y x f y x f y x f y x f y x f ⎪⎪⎪⎭⎫⎝⎛⨯⨯⨯⨯⨯⨯47532531534712111..................Z Z Z Z Z Z 1=imnk Z ~⎪⎪⎪⎪⎭⎫ ⎝⎛⨯⨯⨯⨯⨯⨯47532531534712111~...~~............~...~~Z Z Z Z Z Z i imnkH ∆mnk Z i mnk Z ~⎪⎪⎪⎭⎫⎝⎛⨯⨯⨯⨯⨯⨯ii i i i i h h h h h h 47532531534712111............... (2)i mnkS∆∑∑=⨯=⨯4712531)(47531j i ji i hi D ∆∑=16411641i mnk S 4i i imnk H 5347imnk S mnk H i D 41 2),(y x Z = ),(y x Z =i D nk m ⨯ i mnk H mnk Z i mnk Z ~1~mnk Z 2~mnk Z 1mnk H 2mnk H imnkS∆∑∑=⨯=⨯4712531)(47531j ij i i h1mnk S 2mnk S⑤ 用i D ∆∑=16411641i mnk S 计算出1D 与2D ,则1D 和2D 的值较小者为最优方案.3 主要程序及结论通过数据处理与分析我们认为预测方法一比预测方法二好.所得计算结果值分别为:(1)不同时段的两种方法的实测与预测值的均方差:1mnkS =[0.9247218269e-1, .165797962696, 0.9247218269e-1,0.9247218269e-1, .2586806182, .2586806182, .2586806182, 2.791713932, .2474029514, .2539943168, .2715902174, .2715902174182, .2586806182, 2.791713932, .2474029514, .2539943168, .2715902174]2mnkS := [0.921412432e-1, .1098068392, 0.2234955063e-1,0.1592933205e-1, .2851304286, .2851304286, .2851304286, 2.792910527, .2612701098, .2381007694, .2613774987, 0.5183032655e-1,.2851304286,2.792810527, .2612701098, .2381007694, .2613774987] (2) 方法一的均方差为:1D := .8311398371方案二的均方差: 2D = .8417760978得1D <2D .主要程序与运行结果为: (1) 局域曲面拟合程序> solve({0.3=0.6-r*(0.045^2+0.042^2)},{r});> z1:=0.6-79.17656374*[(x-120.2500)^2+(y-33.7667)^2];> z2:=0.6-79.17656374*[(x-120.2500)^2+(y-33.7667)^2];> z3:=0.6-79.17656374*[(x-120.2500)^2+(y-33.7667)^2];> z4:=0.6-79.17656374*[(x-120.2500)^2+(y-33.7667)^2];> solve({0.15=0.3-r*(0.045^2+0.042^2)},{r});> z4:=0.3-39.58828187*[(x-118.1833)^2+(y-31.0833)^2];> solve({5.1=10.2-r*(0.045^2+0.042^2)},{r});> z1:=10.2-1346.001584*[(x-120.3167)^2+(y-31.5833)^2];> z2:=10.2-1346.001584*[(x-120.3167)^2+(y-31.5833)^2];> z3:=10.2-1346.001584*[(x-120.3167)^2+(y-31.5833)^2];> z4:=10.2-1346.001584*[(x-120.3167)^2+(y-31.5833)^2];> solve({0.1=0.2-r*(0.045^2+0.042^2)},{r});> z4:=0.2-26.39218791*[(x-118.4000)^2+(y-30.6833)^2];>z4:=solve({118.9833^2+30.6167^2+a*118.9833+b*30.6167+c=0.7000,118.5833^ 2+30.0833^2+a*118.5833+b*30.0833+c=1.8000,119.4167^2+30.8833^2+a*119.41 67+b*30.8833+c=0.5});> solve({0.05=0.1-r*(0.045^2+0.042^2)},{r});> z1:=0.1-13.19609396*[(x-119.4167)^2+(y-30.8833)^2];>> solve({2.9=5.8-r*(0.045^2+0.042^2)},{r});> z4:=0.1-765.3734495*[(x-118.2833)^2+(y-29.7167)^2];(2)均方差求值程序:>sq1:=[0.09247218269,0.165797962696,0.09247218269,0.09247218269,0.258680 6182,0.2586806182,0.2586806182,2.791713932,0.2474029514,0.2539943168,0. 2715902174,0.2715902174182,0.2586806182,2.791713932,0.2474029514,0.2539 943168,0.2715902174];> sum1:=add(i,i=sq1);> ave1:=sum1/17;>ve1:=[.5222900020,.5222900020,.5222900020,.5222900020,.5222900020,.5222 900020,.5222900020,.5222900020,.5222900020,.5222900020,.5222900020,.522 2900020,.5222900020,.5222900020,.5222900020,.5222900020,.5222900020,.52 22900020];>sq2:=[0.0921412432,0.1098068392,0.022********,0.01592933205,0.285130428 6,0.2851304286,0.2851304286,2.792910527,0.2612701098,0.2381007694,0.261 3774987,0.0518*******,0.2851304286,2.792810527,0.2612701098,0.238100769 4,0.2613774987];(2)数据模拟图程序:> with(linalg):> l:=matrix(91,7,[58138,32.9833,118.5167, 0.0000, 5.0000, 0.2000, 0.0000, 58139, 33.3000,118.8500, 0.0000, 3.9000, 0.0000, 0.0000,58141, 33.6667,119.2667, 0.0000, 0.0000, 0.0000, 0.0000,58143, 33.8000,119.8000, 0.0000, 0.0000, 0.0000, 0.0000,58146, 33.4833,119.8167, 0.0000, 0.0000, 0.0000, 0.0000,58147, 33.0333,119.0333, 0.0000, 6.0000, 1.4000, 0.0000,58148, 33.2333,119.3000, 0.0000, 1.1000, 0.3000, 0.0000,58150, 33.7667,120.2500, 0.0000, 0.0000, 0.0000, 0.1000,58154, 33.3833,120.1500, 0.0000, 0.0000, 0.0000, 0.0000,58158, 33.2000,120.4833, 0.0000, 0.0000, 0.0000, 0.0000,58230, 32.1000,118.2667, 3.3000,20.7000, 6.6000, 0.0000,58236, 32.3000,118.3000, 0.0000, 8.2000, 3.6000, 1.4000,58238, 32.0000,118.8000, 0.0000, 0.0000, 0.0000, 0.0000,58240, 32.6833,119.0167, 0.0000, 3.0000, 1.4000, 0.0000,58241, 32.8000,119.4500, 0.1000, 1.4000, 1.5000, 0.1000,58243, 32.9333,119.8333, 0.0000, 0.7000, 0.4000, 0.0000,58245, 32.4167,119.4167, 0.3000, 2.7000, 3.8000, 0.0000,58246, 32.3333,119.9333, 7.9000, 2.7000, 0.1000, 0.0000,58249, 32.2000,120.0000,12.3000, 2.4000, 5.6000, 0.0000,58251, 32.8667,120.3167, 5.2000, 0.1000, 0.0000, 0.0000, 58252, 32.1833,119.4667, 0.4000, 3.2000, 4.8000, 0.0000, 58254, 32.5333,120.4500, 0.0000, 0.0000, 0.0000, 0.0000, 58255, 32.3833,120.5667, 1.1000,18.5000, 0.5000, 0.0000, 58264, 32.3333,121.1833,35.4000, 0.1000, 0.2000, 0.0000, 58265, 32.0667,121.6000, 0.0000, 0.0000, 0.0000, 0.0000, 58269, 31.8000,121.6667,31.3000, 0.7000, 2.8000, 0.1000, 58333, 31.9500,118.8500, 8.2000, 8.5000,16.9000, 0.1000, 58334, 31.3333,118.3833, 4.9000,58.1000, 9.0000, 0.1000, 58335, 31.5667,118.5000, 5.4000,26.0000,11.0000, 0.8000, 58336, 31.7000,118.5167, 3.6000,27.8000,15.3000, 0.6000, 58337, 31.0833,118.1833, 7.0000, 6.4000,15.3000, 0.2000, 58341, 31.9833,119.5833,11.5000, 5.4000,16.1000, 0.0000, 58342, 31.7500,119.5500,32.6000,37.9000, 5.8000, 0.0000, 58343, 31.7667,119.9333,20.7000,24.3000, 5.3000, 0.0000, 58344, 31.9500,119.1667,12.4000, 5.9000,16.3000, 0.0000, 58345, 31.4333,119.4833,21.8000,18.1000, 9.8000, 0.1000, 58346, 31.3667,119.8167, 0.1000,12.7000, 5.1000, 0.2000, 58349, 31.2667,120.6333, 1.1000, 5.1000, 0.0000, 0.0000, 58351, 31.8833,120.2667,22.9000,15.5000, 6.2000, 0.0000, 58352, 31.6500,120.7333,15.1000, 5.4000, 2.4000, 0.0000, 58354, 31.5833,120.3167, 0.1000,12.5000, 2.4000, 0.0000, 58356, 31.4167,120.9500, 5.1000, 4.9000, 0.4000, 0.0000, 58358, 31.0667,120.4333, 2.4000, 3.4000, 0.0000, 0.8000, 58359, 31.1500,120.6333, 1.5000, 3.8000, 0.5000, 0.1000, 58360, 31.9000,121.2000, 5.6000, 3.2000, 2.9000, 0.1000, 58361, 31.1000,121.3667, 3.5000, 0.6000, 0.2000, 0.7000, 58362, 31.4000,121.4833,33.0000, 4.1000, 0.9000, 0.0000, 58365, 31.3667,121.2500,17.7000, 2.2000, 0.1000, 0.0000, 58366, 31.6167,121.4500,75.2000, 0.4000, 1.5000, 0.0000, 58367, 31.2000,121.4333, 7.2000, 2.8000, 0.2000, 0.2000, 58369, 31.0500,121.7833, 3.2000, 0.3000, 0.0000, 0.3000, 58370, 31.2333,121.5333, 7.0000, 3.4000, 0.2000, 0.2000, 58377, 31.4667,121.1000, 7.8000, 7.2000, 0.3000, 0.0000, 58426, 30.3000,118.1333, 0.0000, 0.0000,17.6000, 6.2000, 58431, 30.8500,118.3167, 5.1000, 2.3000,16.5000, 0.1000, 58432, 30.6833,118.4000, 3.6000, 1.4000,20.5000, 0.2000, 58433, 30.9333,118.7500, 2.1000, 3.4000, 8.5000, 0.2000, 58435, 30.3000,118.5333, 0.0000, 0.0000,13.6000, 8.5000, 58436, 30.6167,118.9833, 0.0000, 0.0000, 5.3000, 0.5000, 58438, 30.0833,118.5833, 0.0000, 0.0000,27.6000,21.8000, 58441, 30.8833,119.4167, 0.1000, 1.6000, 1.6000, 1.0000, 58442, 31.1333,119.1833, 3.0000, 8.8000, 5.4000, 0.2000, 58443, 30.9833,119.8833, 0.1000, 2.7000, 0.1000, 0.9000,58446, 30.9667,119.6833, 0.0000, 0.1000, 5.1000, 2.5000, 58448, 30.2333,119.7000, 0.0000, 0.0000,15.1000, 6.9000, 58449, 30.0500,119.9500, 0.0000, 0.0000,23.5000, 8.2000, 58450, 30.8500,120.0833, 0.0000, 0.7000, 0.0000, 4.1000, 58451, 30.8500,120.9000, 0.5000, 0.1000, 0.0000, 3.8000, 58452, 30.7833,120.7333, 0.3000, 0.0000, 0.0000, 3.0000, 58453, 30.0000,120.6333, 0.0000, 0.0000, 0.0000,18.2000, 58454, 30.5333,120.0667, 0.0000, 0.0000, 0.5000, 4.9000, 58455, 30.5167,120.6833, 0.0000, 0.0000, 0.0000, 4.6000, 58456, 30.6333,120.5333, 0.0000, 0.0000, 0.0000, 4.2000, 58457, 30.2333,120.1667, 0.0000, 0.0000, 2.0000,12.6000, 58459, 30.2000,120.3167, 0.0000, 0.0000, 0.0000,15.0000, 58460, 30.8833,121.1667, 1.2000, 0.1000, 0.0000, 2.3000, 58461, 31.1333,121.1167, 4.0000, 1.4000, 0.4000, 0.2000, 58462, 31.0000,121.2500, 2.7000, 0.3000, 0.4000, 1.7000, 58463, 30.9333,121.4833, 1.7000, 0.1000, 0.0000, 0.8000, 58464, 30.6167,121.0833, 0.0000, 0.0000, 0.0000, 3.6000, 58467, 30.2667,121.2167, 0.0000, 0.0000, 0.0000, 1.8000, 58468, 30.0667,121.1500, 0.0000, 0.1000, 5.1000, 2.5000, 58472, 30.7333,122.4500, 0.3000, 0.6000, 0.0000, 4.9000, 58477, 30.0333,122.1000, 0.0000, 0.0000, 0.0000, 0.0000, 58484, 30.2500,122.1833, 0.0000, 0.0000, 0.0000, 0.0000, 58530, 29.8667,118.4333, 0.0000, 0.0000,27.5000,23.6000, 58531, 29.7167,118.2833, 0.0000, 0.0000, 3.7000,11.5000, 58534, 29.7833,118.1833, 0.0000, 0.0000, 9.3000, 6.5000, 58542, 29.8167,119.6833, 0.0000, 0.0000, 0.0000,27.6000, 58550, 29.7000,120.2500, 0.0000, 0.0000, 0.0000, 4.9000, 58562, 29.9667,121.7500, 0.0000, 0.0000, 0.0000, 0.9000]);> lat:=col(l,2);> lon:=col(l,3); > sd1:=col(l,4);> sd2:=col(l,5); > sd3:=col(l,6); > sd4:=col(l,7);> abc1:=seq([lat[i],lon[i],sd1[i]],i=1..91);> abc2:=seq([lat[i],lon[i],sd2[i]],i=1..91);> abc3:=seq([lat[i],lon[i],sd3[i]],i=1..91);> abc4:=seq([lat[i],lon[i],sd4[i]],i=1..91);> with(plots):> pointplot3d([abc1],color=green,axes=boxed);> surfdata([abc1],labels=["x","y","z"],axes=boxed);> with(stats):> with(fit):> with(plots):fx1:=leastsquare[[x,y,z],z=x^3+y^3+a*x^2+b*y^2+c*x*y+d*x+e*y+f,{a,b,c,d ,e,f}]([abc1]);> plot3d(fx1,x=25..35,y=119..135);> pointplot3d([abc2],color=blue,axes=boxed);> surfdata([abc2],labels=["x","y","z"],axes=boxed);>fx2:=leastsquare[[x,y,z],z=x^3+y^3+a*x^2+b*y^2+c*x*y+d*x+e*y+f,{a,b,c,d ,e,f}]([abc2]);> plot3d(fx2,x=25..35,y=119..135);> pointplot3d([abc3],color=red,axes=boxed)> surfdata([abc3],labels=["x","y","z"],axes=boxed);>fx3:=leastsquare[[x,y,z],z=x^3+y^3+a*x^2+b*y^2+c*x*y+d*x+e*y+f,{a,b,c,d ,e,f}]([abc3]);> surfdata([abc4],labels=["x","y","z"],axes=boxed);>fx4:=leastsquare[[x,y,z],z=x^3+y^3+a*x^2+b*y^2+c*x*y+d*x+e*y+f,{a,b,c,d ,e,f}]([abc4]);五.如何在评价方法中考虑公众感受的数学模型建立.1660.1 2.5 2.666.11212.12525.16060.1z } 1.00 {0≤≤=z z R } 5.21.0 {1≤≤=z z R } 66.2 {2≤≤=z z R } 121.6 {3≤≤=z z R } 251.12 {4≤≤=z z R } 601.25 {5≤≤=z z R } 1.60 {6≥=z z R 0ˆR 1ˆR 2ˆR 3ˆR 4ˆR 5ˆR 6ˆR } 1)( {ˆ000R z z z R ∈≤=,μ} 1)( {ˆ111R z z z R ∈≤=,μ} 1)( {ˆ222R z z z R ∈≤=,μ } 1)( {ˆ333R z z z R ∈≤=,μ} 1)( {ˆ444R z z z R ∈≤=,μ} 1)( {ˆ555R z z z R ∈≤=,μ } 1)( {ˆ666R z z z R ∈≤=,μ)(z i μ i 1z ∈i R i R )(z i μ i 16i R ˆ i 1 2)(z i μ i 1⎩⎨⎧≤<+-≤≤=1.006.0 , 5.22506.00, 1)(0z z z z μ)(1z μ] 2369277587.0e [2369277587.0112)3.1(----z 5.21.0≤≤z )(2z μ] 20555762126.0e [20555762126.0112)3.4(----z 66.2≤≤z)(3z μ] 2287787270.0e [2287787270.0119.5)05.9(2----z 121.6≤≤z )(4z μ] 70397557815.0e[70397557815.0119.12)55.18(2----z 251.12≤≤z)(5z μ] 00475951221.0e[00475951221.011100)55.42(2----z 601.25≤≤z)(6z μ2)]5.60(5 [11--+z 1.60≥z 74)(z i μ及iR ˆ i =0,1,…,6合并可得} 0 {≥=z z R 上的模糊集合} , 1)( {ˆR z z z R∈≤=μ.其中R 是论域,)(z μ是模糊集合R ˆ的隶属函数,由)(z i μ分段合)(z μ小雨的隶属函数图特大暴雨隶属函数图大暴雨隶属函数图暴雨隶属函数图⎪⎪⎪⎪⎩⎪⎪⎪⎪⎨⎧>≤<≤<≤<≤<≤<≤≤=60)(6025)(2512)(126)(65.2)(5.21.0)(1.00)()(6543210z z z z z z z z z z z z z z t μμμμμμμμ 5 353⨯47imnkZ ~)(z μ53⨯47=M mnk⎪⎪⎪⎭⎫⎝⎛⨯⨯⨯⨯⨯⨯47532531534712111..................μμμμμμ=M imnk~⎪⎪⎪⎭⎫⎝⎛⨯⨯⨯⨯⨯⨯47532531534712111~...~~............~...~~μμμμμμi ),(y x Z =i mnk ∏∆mnk M =M i mnk~⎪⎪⎪⎪⎭⎫ ⎝⎛⨯⨯⨯⨯⨯⨯i i i i i i 47532531534712111..................λλλλλλ 6imnkΓ∆∑∑=⨯=⨯4712531)(47531j i j i i λ i Ω∆∑=16411641i imnkΓ 8 i 2i i i mnk ∏5347imnk Γi mnk ∏i Ω411Ω2Ω 1Ω2Ω1D 2D19811999。
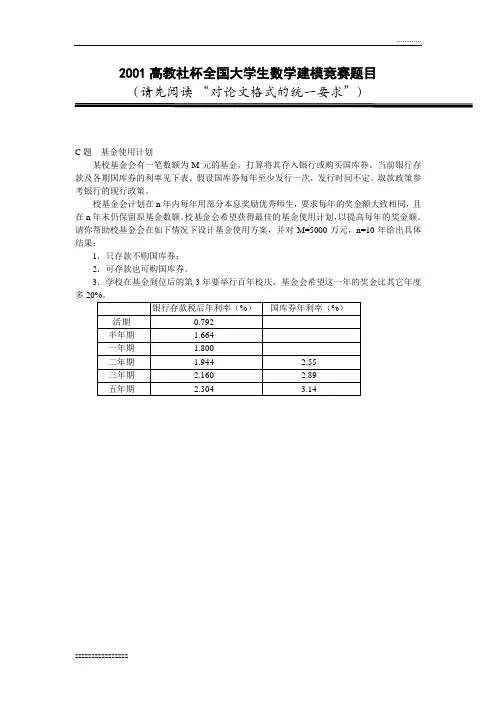
2001高教社杯全国大学生数学建模竞赛题目(请先阅读“对论文格式的统一要求”)C题基金使用计划某校基金会有一笔数额为M元的基金,打算将其存入银行或购买国库券。
当前银行存款及各期国库券的利率见下表。
假设国库券每年至少发行一次,发行时间不定。
取款政策参考银行的现行政策。
校基金会计划在n年内每年用部分本息奖励优秀师生,要求每年的奖金额大致相同,且在n年末仍保留原基金数额。
校基金会希望获得最佳的基金使用计划,以提高每年的奖金额。
请你帮助校基金会在如下情况下设计基金使用方案,并对M=5000万元,n=10年给出具体结果:1.只存款不购国库券;2.可存款也可购国库券。
3.学校在基金到位后的第3年要举行百年校庆,基金会希望这一年的奖金比其它年度多摘要:运用基金M分成n份(M1,M2,…,Mn),M1存一年,M2存2年,…,Mn存n 年.这样,对前面的(n-1)年,第i年终时M1到期,将Mi及其利息均取出来作为当年的奖金发放;而第n年,则用除去M元所剩下的钱作为第n年的奖金发放的基本思想,解决了基金的最佳使用方案问题.关键词:超限归纳法;排除定理;仓恩定理1问题重述某校基金会有一笔数额为M元的基金,欲将其存入银行或购买国库券.当前银行存款及各期国库券的利率见表1.假设国库券每年至少发行一次,发行时间不定.取款政策参考银行的现行政策.表1 存款年利率表校基金会计在n年内每年用部分本息奖励优秀师生,要求每年的奖金额大致相同,且在n年末仍保留原基金数额.校基金会希望获得最佳的基金使用计划,以提高每年的奖金额.需帮助校基金会在如下情况下设计基金使用方案,并对M=5 000万元,n=10年给出具体结果:①只存款不购国库券;②可存款也可购国库券.③学校在基金到位后的第3年要举行百年校庆,基金会希望这一年的奖金比其它年度多20%.2模型的分析、假设与建立2.1模型假设①每年发放的奖金额相同;②取款按现行银行政策;③不考虑通货膨胀及国家政策对利息结算的影响;④基金在年初到位,学校当年奖金在下一年年初发放;⑤国库券若提前支取,则按满年限的同期银行利率结算,且需交纳一定数额的手续费;⑥到期国库券回收资金不能用于购买当年发行的国库券.2.2符号约定K——发放的奖金数;ri——存i年的年利率,(i=1/2,1,2,3,5);Mi——支付第i年奖金,第1年开始所存的数额(i=1,2,…,10);U——半年活期的年利率;2.3模型的建立和求解2.3.1情况一:只存款不购国库券(1)分析令:支付各年奖金和本金存款方案———Mij (i =1,…,10,i ;j 属于N ). 将各方案ij M 看成元素,构成集合A则ij M 属于A1,210;I =所以A 按I 取值分10行根据仓恩定理:分行集中,任何一单行有上界,则必包含一个极大元素。
For office use only T1T2T3T4T eam Control Number42939Problem ChosenCFor office use onlyF1F2F3F42016Mathematical Contest in Modeling(MCM)Summary Sheet (Attach a copy of this page to each copy of your solution paper.)SummaryIn order to determine the optimal donation strategy,this paper proposes a data-motivated model based on an original definition of return on investment(ROI) appropriate for charitable organizations.First,after addressing missing data,we develop a composite index,called the performance index,to quantify students’educational performance.The perfor-mance index is a linear composition of several commonly used performance indi-cators,like graduation rate and graduates’earnings.And their weights are deter-mined by principal component analysis.Next,to deal with problems caused by high-dimensional data,we employ a lin-ear model and a selection method called post-LASSO to select variables that statis-tically significantly affect the performance index and determine their effects(coef-ficients).We call them performance contributing variables.In this case,5variables are selected.Among them,tuition&fees in2010and Carnegie High-Research-Activity classification are insusceptible to donation amount.Thus we only con-sider percentage of students who receive a Pell Grant,share of students who are part-time and student-to-faculty ratio.Then,a generalized adaptive model is adopted to estimate the relation between these3variables and donation amount.Wefit the relation across all institutions and get afitted function from donation amount to values of performance contributing variables.Then we divide the impact of donation amount into2parts:homogenous and heterogenous one.The homogenous influence is modeled as the change infit-ted values of performance contributing variables over increase in donation amount, which can be predicted from thefitted curve.The heterogenous one is modeled as a tuning parameter which adjusts the homogenous influence based on deviation from thefitted curve.And their product is increase in true values of performance over increase in donation amount.Finally,we calculate ROI,defined as increase in performance index over in-crease in donation amount.This ROI is institution-specific and dependent on in-crease in donation amount.By adopting a two-step ROI maximization algorithm, we determine the optimal investment strategy.Also,we propose an extended model to handle problems caused by time dura-tion and geographical distribution of donations.A Letter to the CFO of the Goodgrant FoundationDear Chiang,Our team has proposed a performance index quantifying the students’educational per-formance of each institution and defined the return of investment(ROI)appropriately for a charitable organization like Goodgrant Foundation.A mathematical model is built to help predict the return of investment after identifying the mechanism through which the donation generates its impact on the performance.The optimal investment strategy is determined by maximizing the estimated return of investment.More specifically,the composite performance index is developed after taking all the pos-sible performance indicators into consideration,like graduation rate and graduates’earnings. The performance index is constructed to represents the performance of the school as well as the positive effect that a college brings to students and the community.From this point of view, our definition manages to capture social benefits of donation.And then we adopt a variable selection method tofind out performance contributing vari-ables,which are variables that strongly affect the performance index.Among all the perfor-mance contributing variables we select,three variables which can be directly affected by your generous donation are kept to predict ROI:percentage of students who receive a Pell Grant, share of students who are part-time and student-to-faculty ratio.Wefitted a relation between these three variables and the donation amount to predict change in value of each performance contributing variable over your donation amount.And we calculate ROI,defined as increase in the performance index over your donation amount, by multiplying change in value of each performance contributing variable over your donation amount and each performance contributing variable’s effect on performance index,and then summing up the products of all performance contributing variables.The optimal investment strategy is decided after maximizing the return of investment according to an algorithm for selection.In conclusion,our model successfully produced an investment strategy including a list of target institutions and investment amount for each institution.(The list of year1is attached at the end of the letter).The time duration for the investment could also be determined based on our model.Since the model as well as the evaluation approach is fully data-motivated with no arbitrary criterion included,it is rather adaptable for solving future philanthropic educational investment problems.We have a strong belief that our model can effectively enhance the efficiency of philan-thropic educational investment and provides an appropriate as well as feasible way to best improve the educational performance of students.UNITID names ROI donation 197027United States Merchant Marine Academy21.85%2500000 102711AVTEC-Alaska’s Institute of Technology21.26%7500000 187745Institute of American Indian and Alaska Native Culture20.99%2000000 262129New College of Florida20.69%6500000 216296Thaddeus Stevens College of Technology20.66%3000000 229832Western Texas College20.26%10000000 196158SUNY at Fredonia20.24%5500000 234155Virginia State University20.04%10000000 196200SUNY College at Potsdam19.75%5000000 178615Truman State University19.60%3000000 199120University of North Carolina at Chapel Hill19.51%3000000 101648Marion Military Institute19.48%2500000187912New Mexico Military Institute19.31%500000 227386Panola College19.28%10000000 434584Ilisagvik College19.19%4500000 199184University of North Carolina School of the Arts19.15%500000 413802East San Gabriel Valley Regional Occupational Program19.09%6000000 174251University of Minnesota-Morris19.09%8000000 159391Louisiana State University and Agricultural&Mechanical Col-19.07%8500000lege403487Wabash Valley College19.05%1500000 Yours Sincerely,Team#42939An Optimal Strategy of Donation for Educational PurposeControl Number:#42939February,2016Contents1Introduction51.1Statement of the Problem (5)1.2Baseline Model (5)1.3Detailed Definitions&Assumptions (8)1.3.1Detailed Definitions: (8)1.3.2Assumptions: (9)1.4The Advantages of Our Model (9)2Addressing the Missing Values93Determining the Performance Index103.1Performance Indicators (10)3.2Performance Index via Principal-Component Factors (10)4Identifying Performance Contributing Variables via post-LASSO115Determining Investment Strategy based on ROI135.1Fitted Curve between Performance Contributing Variables and Donation Amount145.2ROI(Return on Investment) (15)5.2.1Model of Fitted ROIs of Performance Contributing Variables fROI i (15)5.2.2Model of the tuning parameter P i (16)5.2.3Calculation of ROI (17)5.3School Selection&Investment Strategy (18)6Extended Model186.1Time Duration (18)6.2Geographical Distribution (22)7Conclusions and Discussion22 8Reference23 9Appendix241Introduction1.1Statement of the ProblemThere exists no doubt in the significance of postsecondary education to the development of society,especially with the ascending need for skilled employees capable of complex work. Nevertheless,U.S.ranks only11th in the higher education attachment worldwide,which makes thefinancial support from large charitable organizations necessary.As it’s essential for charitable organizations to maximize the effectiveness of donations,an objective and systematic assessment model is in demand to develop appropriate investment strategies.To achieve this goal,several large foundations like Gates Foundation and Lumina Foundation have developed different evaluation approaches,where they mainly focus on spe-cific indexes like attendance and graduation rate.In other empirical literature,a Forbes ap-proach(Shifrin and Chen,2015)proposes a new indicator called the Grateful Graduates Index, using the median amount of private donations per student over a10-year period to measure the return on investment.Also,performance funding indicators(Burke,2002,Cave,1997,Ser-ban and Burke,1998,Banta et al,1996),which include but are not limited to external indicators like graduates’employment rate and internal indicators like teaching quality,are one of the most prevailing methods to evaluate effectiveness of educational donations.However,those methods also arise with widely acknowledged concerns(Burke,1998).Most of them require subjective choice of indexes and are rather arbitrary than data-based.And they perform badly in a data environment where there is miscellaneous cross-section data but scarce time-series data.Besides,they lack quantified analysis in precisely predicting or measuring the social benefits and the positive effect that the investment can generate,which serves as one of the targets for the Goodgrant Foundation.In accordance with Goodgrant Foundation’s request,this paper provides a prudent def-inition of return on investment(ROI)for charitable organizations,and develops an original data-motivated model,which is feasible even faced with tangled cross-section data and absent time-series data,to determine the optimal strategy for funding.The strategy contains selection of institutions and distribution of investment across institutions,time and regions.1.2Baseline ModelOur definition of ROI is similar to its usual meaning,which is the increase in students’educational performance over the amount Goodgrant Foundation donates(assuming other donationsfixed,it’s also the increase in total donation amount).First we cope with data missingness.Then,to quantify students’educational performance, we develop an index called performance index,which is a linear composition of commonly used performance indicators.Our major task is to build a model to predict the change of this index given a distribution of Goodgrant Foundation$100m donation.However,donation does not directly affect the performance index and we would encounter endogeneity problem or neglect effects of other variables if we solely focus on the relation between performance index and donation amount. Instead,we select several variables that are pivotal in predicting the performance index from many potential candidates,and determine their coefficients/effects on the performance index. We call these variables performance contributing variables.Due to absence of time-series data,it becomes difficult tofigure out how performance con-tributing variables are affected by donation amount for each institution respectively.Instead, wefit the relation between performance contributing variables and donation amount across all institutions and get afitted function from donation amount to values of performance contribut-ing variables.Then we divide the impact of donation amount into2parts:homogenous and heteroge-nous one.The homogenous influence is modeled as the change infitted values of performance contributing variables over increase in donation amount(We call these quotientsfitted ROI of performance contributing variable).The heterogenous one is modeled as a tuning parameter, which adjusts the homogenous influence based on deviation from thefitted function.And their product is the institution-specific increase in true values of performance contributing variables over increase in donation amount(We call these values ROI of performance contributing vari-able).The next step is to calculate the ROI of the performance index by adding the products of ROIs of performance contributing variables and their coefficients on the performance index. This ROI is institution-specific and dependent on increase in donation amount.By adopting a two-step ROI maximization algorithm,we determine the optimal investment strategy.Also,we propose an extended model to handle problems caused by time duration and geographical distribution of donations.Note:we only use data from the provided excel table and that mentioned in the pdffile.Table1:Data SourceVariable DatasetPerformance index Excel tablePerformance contributing variables Excel table and pdffileDonation amount PdffileTheflow chart of the whole model is presented below in Fig1:Figure1:Flow Chart Demonstration of the Model1.3Detailed Definitions&Assumptions 1.3.1Detailed Definitions:1.3.2Assumptions:A1.Stability.We assume data of any institution should be stable without the impact from outside.To be specific,the key factors like the donation amount and the performance index should remain unchanged if the college does not receive new donations.A2.Goodgrant Foundation’s donation(Increase in donation amount)is discrete rather than continuous.This is reasonable because each donation is usually an integer multiple of a minimum amount,like$1m.After referring to the data of other foundations like Lumina Foundation,we recommend donation amount should be one value in the set below:{500000,1000000,1500000, (10000000)A3.The performance index is a linear composition of all given performance indicators.A4.Performance contributing variables linearly affect the performance index.A5.Increase in donation amount affects the performance index through performance con-tributing variables.A6.The impact of increase in donation amount on performance contributing variables con-tains2parts:homogenous one and heterogenous one.The homogenous influence is repre-sented by a smooth function from donation amount to performance contributing variables.And the heterogenous one is represented by deviation from the function.1.4The Advantages of Our ModelOur model exhibits many advantages in application:•The evaluation model is fully data based with few subjective or arbitrary decision rules.•Our model successfully identifies the underlying mechanism instead of merely focusing on the relation between donation amount and the performance index.•Our model takes both homogeneity and heterogeneity into consideration.•Our model makes full use of the cross-section data and does not need time-series data to produce reasonable outcomes.2Addressing the Missing ValuesThe provided datasets suffer from severe data missing,which could undermine the reliabil-ity and interpretability of any results.To cope with this problem,we adopt several different methods for data with varied missing rate.For data with missing rate over50%,any current prevailing method would fall victim to under-or over-randomization.As a result,we omit this kind of data for simplicity’s sake.For variables with missing rate between10%-50%,we use imputation techniques(Little and Rubin,2014)where a missing value was imputed from a randomly selected similar record,and model-based analysis where missing values are substituted with distribution diagrams.For variables with missing rate under10%,we address missingness by simply replace miss-ing value with mean of existing values.3Determining the Performance IndexIn this section,we derive a composite index,called the performance index,to evaluate the educational performance of students at every institution.3.1Performance IndicatorsFirst,we need to determine which variables from various institutional performance data are direct indicators of Goodgrant Foundation’s major concern–to enhance students’educational performance.In practice,other charitable foundations such as Gates Foundation place their focus on core indexes like attendance and graduation rate.Logically,we select performance indicators on the basis of its correlation with these core indexes.With this method,miscellaneous performance data from the excel table boils down to4crucial variables.C150_4_P OOLED_SUP P and C200_L4_P OOLED_SUP P,as completion rates for different types of institutions,are directly correlated with graduation rate.We combine them into one variable.Md_earn_wne_p10and gt_25k_p6,as different measures of graduates’earnings,are proved in empirical studies(Ehren-berg,2004)to be highly dependent on educational performance.And RP Y_3Y R_RT_SUP P, as repayment rate,is also considered valid in the same sense.Let them be Y1,Y2,Y3and Y4.For easy calculation and interpretation of the performance index,we apply uniformization to all4variables,as to make sure they’re on the same scale(from0to100).3.2Performance Index via Principal-Component FactorsAs the model assumes the performance index is a linear composition of all performance indicators,all we need to do is determine the weights of these variables.Here we apply the method of Customer Satisfaction Index model(Rogg et al,2001),where principal-component factors(pcf)are employed to determine weights of all aspects.The pcf procedure uses an orthogonal transformation to convert a set of observations of pos-sibly correlated variables into a set of values of linearly uncorrelated variables called principal-component factors,each of which carries part of the total variance.If the cumulative proportion of the variance exceeds80%,it’s viable to use corresponding pcfs(usually thefirst two pcfs)to determine weights of original variables.In this case,we’ll get4pcfs(named P CF1,P CF2,P CF3and P CF4).First,the procedure provides the linear coefficients of Y m in the expression of P CF1and P CF2.We getP CF1=a11Y1+a12Y2+a13Y3+a14Y4P CF2=a21Y1+a22Y2+a23Y3+a24Y4(a km calculated as corresponding factor loadings over square root of factor k’s eigenvalue) Then,we calculate the rough weights c m for Y m.Let the variance proportions P CF1and P CF2 represent be N1and N2.We get c m=(a1m N1+a2m N2)/(N1+N2)(This formulation is justifiedbecause the variance proportions can be viewed as the significance of pcfs).If we let perfor-mance index=(P CF 1N 1+P CF 2N 2)/(N 1+N 2),c m is indeed the rough weight of Y m in terms of variance)Next,we get the weights by adjusting the sum of rough weights to 1:c m =c m /(c 1+c 2+c 3+c 4)Finally,we get the performance index,which is the weighted sum of the 4performance indicator.Performance index= m (c m Y m )Table 2presents the 10institutions with largest values of the performance index.This rank-ing is highly consistent with widely acknowledged rankings,like QS ranking,which indicates the validity of the performance index.Table 2:The Top 10Institutions in Terms of Performance IndexInstitutionPerformance index Los Angeles County College of Nursing and Allied Health79.60372162Massachusetts Institute of Technology79.06066895University of Pennsylvania79.05044556Babson College78.99269867Georgetown University78.90468597Stanford University78.70586395Duke University78.27719116University of Notre Dame78.15843964Weill Cornell Medical College 78.143341064Identifying Performance Contributing Variables via post-LASSO The next step of our model requires identifying the factors that may exert an influence on the students’educational performance from a variety of variables mentioned in the excel table and the pdf file (108in total,some of which are dummy variables converted from categorical variables).To achieve this purpose,we used a model called LASSO.A linear model is adopted to describe the relationship between the endogenous variable –performance index –and all variables that are potentially influential to it.We assign appropriate coefficient to each variable to minimize the square error between our model prediction and the actual value when fitting the data.min β1J J j =1(y j −x T j β)2where J =2881,x j =(1,x 1j ,x 2j ,...,x pj )THowever,as the amount of the variables included in the model is increasing,the cost func-tion will naturally decrease.So the problem of over fitting the data will arise,which make the model we come up with hard to predict the future performance of the students.Also,since there are hundreds of potential variables as candidates.We need a method to identify the variables that truly matter and have a strong effect on the performance index.Here we take the advantage of a method named post-LASSO (Tibshirani,1996).LASSO,also known as the least absolute shrinkage and selection operator,is a method used for variableselection and shrinkage in medium-or high-dimensional environment.And post-LASSO is to apply ordinary least squares(OLS)to the model selected byfirst-step LASSO procedure.In LASSO procedure,instead of using the cost function that merely focusing on the square error between the prediction and the actual value,a penalty term is also included into the objective function.We wish to minimize:min β1JJj=1(y j−x T jβ)2+λ||β||1whereλ||β||1is the penalty term.The penalty term takes the number of variables into con-sideration by penalizing on the absolute value of the coefficients and forcing the coefficients of many variables shrink to zero if this variable is of less importance.The penalty coefficient lambda determines the degree of penalty for including variables into the model.After min-imizing the cost function plus the penalty term,we couldfigure out the variables of larger essence to include in the model.We utilize the LARS algorithm to implement the LASSO procedure and cross-validation MSE minimization(Usai et al,2009)to determine the optimal penalty coefficient(represented by shrinkage factor in LARS algorithm).And then OLS is employed to complete the post-LASSO method.Figure2:LASSO path-coefficients as a function of shrinkage factor sFigure3:Cross-validated MSEFig2.displays the results of LASSO procedure and Fig3displays the cross-validated MSE for different shrinkage factors.As specified above,the cross-validated MSE reaches minimum with shrinkage factor between0.4-0.8.We choose0.6andfind in Fig2that6variables have nonzero coefficients via the LASSO procedure,thus being selected as the performance con-tributing variables.Table3is a demonstration of these6variables and corresponding post-LASSO results.Table3:Post-LASSO resultsDependent variable:performance_indexPCTPELL−26.453∗∗∗(0.872)PPTUG_EF−14.819∗∗∗(0.781)StudentToFaculty_ratio−0.231∗∗∗(0.025)Tuition&Fees20100.0003∗∗∗(0.00002)Carnegie_HighResearchActivity 5.667∗∗∗(0.775)Constant61.326∗∗∗(0.783)Observations2,880R20.610Adjusted R20.609Note:PCTPELL is percentage of students who receive aPell Grant;PPTUG_EF is share of students who are part-time;Carnegie_HighResearchActivity is Carnegie classifica-tion basic:High Research ActivityThe results presented in Table3are consistent with common sense.For instance,the pos-itive coefficient of High Research Activity Carnegie classification implies that active research activity helps student’s educational performance;and the negative coefficient of Student-to-Faculty ratio suggests that decrease in faculty quantity undermines students’educational per-formance.Along with the large R square value and small p-value for each coefficient,the post-LASSO procedure proves to select a valid set of performance contributing variables and describe well their contribution to the performance index.5Determining Investment Strategy based on ROIWe’ve identified5performance contributing variables via post-LASSO.Among them,tu-ition&fees in2010and Carnegie High-Research-Activity classification are quite insusceptible to donation amount.So we only consider the effects of increase in donation amount on per-centage of students who receive a Pell Grant,share of students who are part-time and student-to-faculty ratio.We denote them with F1,F2and F3,their post-LASSO coefficients withβ1,β2andβ3.In this section,wefirst introduce the procedure used tofit the relation between performance contributing variables and donation amount.Then we provide the model employed to calcu-latefitted ROIs of performance contributing variables(the homogenous influence of increase in donation amount)and the tuning parameter(the heterogenous influence of increase in dona-tion amount).Next,we introduce how to determine stly,we show how the maximiza-tion determines the investment strategy,including selection of institutions and distribution of investments.5.1Fitted Curve between Performance Contributing Variables and Donation AmountSince we have already approximated the linear relation between the performance index with the3performance contributing variables,we want to know how increase in donation changes them.In this paper,we use Generalized Adaptive Model(GAM)to smoothlyfit the relations. Generalized Adaptive Model is a generalized linear model in which the dependent variable depends linearly on unknown smooth functions of independent variables.Thefitted curve of percentage of students who receive a Pell Grant is depicted below in Fig4(see the other two fitted curves in Appendix):Figure4:GAM ApproximationA Pell Grant is money the U.S.federal government provides directly for students who needit to pay for college.Intuitively,if the amount of donation an institution receives from other sources such as private donation increases,the institution is likely to use these donations to alleviate students’financial stress,resulting in percentage of students who receive a Pell Grant. Thus it is reasonable to see afitted curve downward sloping at most part.Also,in commonsense,an increase in donation amount would lead to increase in the performance index.This downward sloping curve is consistent with the negative post-LASSO coefficient of percentage of students who receive a Pell Grant(as two negatives make a positive).5.2ROI(Return on Investment)5.2.1Model of Fitted ROIs of Performance Contributing Variables fROI iFigure5:Demonstration of fROI1Again,we usefitted curve of percentage of students who receive a Pell Grant as an example. We modeled the bluefitted curve to represent the homogeneous relation between percentage of students who receive a Pell Grant and donation amount.Recallfitted ROI of percentage of students who receive a Pell Grant(fROI1)is change in fitted values(∆f)over increase in donation amount(∆X).SofROI1=∆f/∆XAccording to assumption A2,the amount of each Goodgrant Foundation’s donation falls into a pre-specified set,namely,{500000,1000000,1500000,...,10000000}.So we get a set of possible fitted ROI of percentage of students who receive a Pell Grant(fROI1).Clearly,fROI1is de-pendent on both donation amount(X)and increase in donation amount(∆X).Calculation of fitted ROIs of other performance contributing variables is similar.5.2.2Model of the tuning parameter P iAlthough we’ve identified the homogenous influence of increase in donation amount,we shall not neglect the fact that institutions utilize donations differently.A proportion of do-nations might be appropriated by the university’s administration and different institutions allocate the donation differently.For example,university with a more convenient and well-maintained system of identifying students who needfinancial aid might be willing to use a larger portion of donations to directly aid students,resulting in a lower percentage of under-graduate students receiving Pell grant.Also,university facing lower cost of identifying and hiring suitable faculty members might be inclined to use a larger portion of donations in this direction,resulting in a lower student-to-faculty ratio.These above mentioned reasons make institutions deviate from the homogenousfitted func-tion and presents heterogeneous influence of increase in donation amount.Thus,while the homogenous influence only depends on donation amount and increase in donation amount, the heterogeneous influence is institution-specific.To account for this heterogeneous influence,we utilize a tuning parameter P i to adjust the homogenous influence.By multiplying the tuning parameter,fitted ROIs of performance con-tributing variables(fitted value changes)convert into ROI of performance contributing variable (true value changes).ROI i=fROI i·P iWe then argue that P i can be summarized by a function of deviation from thefitted curve (∆h),and the function has the shape shown in Fig6.The value of P i ranges from0to2,because P i can be viewed as an amplification or shrinkage of the homogenous influence.For example,P i=2means that the homogeneous influence is amplified greatly.P i=0means that this homogeneous influence would be entirely wiped out. The shape of the function is as shown in Fig6because of the following reasons.Intuitively,if one institution locates above thefitted line,when deviation is small,the larger it is,the larger P i is.This is because the institution might be more inclined to utilize donations to change that factor.However,when deviation becomes even larger,the institution grows less willing to invest on this factor.This is because marginal utility decreases.The discussion is similar if one institution initially lies under thefitted line.Thus,we assume the function mapping deviation to P i is similar to Fig6.deviation is on the x-axis while P i is on the y-axis.Figure6:Function from Deviation to P iIn order to simplify calculation and without loss of generality,we approximate the function。
电池剩余放电时间预测摘要:铅酸电池作为电源被广泛应用与工业、军事、日常生活,所以电池的性能及其预测成为影响电池应用的一个关键因素,额定容量,额定电压,放电电流,自放电率都对铅酸电池的使用产生直接的影响。
因此,铅酸电池剩余电量的精确估算具有十分重要的理论意义和现实应用价值[1]。
对于问题1,题文中给出的要求,要计算20A~100A的9组放电曲线,根据给出的数据,观察到数据的不同变化规律,对数据进行分段处理,分别针对不同段的数据进行放电曲线拟合,进而得到各电流强度下的放电曲线方程。
根据附件中所给出的MRE定义,求解出9组数据的平均相对误差MRE,通过求出的数据看出,本题所建立模型,使得计算数据与样本数据误差较小,对于问题1所建立模型较为理想。
根据已知放电曲线模型,可以计算出电流强度在30A~70A五种情况的剩余放电时间。
对于问题2,要求得任一恒定电流强度的放电曲线,可以利用曲面拟合方法得到由已知的电流强度为20A~30A的九组放电数据组合形成的曲面。
利用matlab 中的曲面拟合方法得到曲面方程表示的任意电流强度下的电池放电模型。
根据本问题得到的曲面模型计算得出MRE与问题一曲线拟合方法计算得出MRE进行比较,确定模型的精度。
根据本题给出的模型,即可得到55A时,各个时刻所对应的电压点。
对于问题3,通过分析电池在不同衰减状态下的电压和放电时间关系,可以得到各衰减状态与电池电压之间的关系,通过分析相邻两个衰减状态的放电时间差值,可以得到新电池与衰减状态1,衰减状态1与衰减状态2,衰减状态2与衰减状态3之间放电时间差值的变化趋势,对三个放电时间差值的变化趋势进行分析,并根据已知的数据计算可以得到部分衰减状态2与衰减状态3之间的差值,进而拟合得到该差值的变化曲线方程,从而可以计算得到衰减状态2和衰减状态3之间的所有差值,据此差值可以预测出衰减状态3下的所有放电时间值。
关键字:放电特性曲线拟合曲面拟合模型新电池在使用中,随着使用时间的增多以及给定电流的强度的不同,电池的使用时间也会不同。
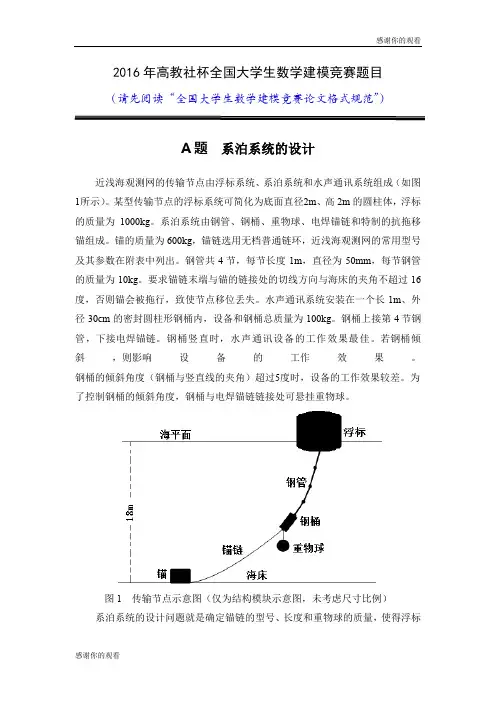
2016年高教社杯全国大学生数学建模竞赛题目(请先阅读“全国大学生数学建模竞赛论文格式规范”)A题系泊系统的设计近浅海观测网的传输节点由浮标系统、系泊系统和水声通讯系统组成(如图1所示)。
某型传输节点的浮标系统可简化为底面直径2m、高2m的圆柱体,浮标的质量为1000kg。
系泊系统由钢管、钢桶、重物球、电焊锚链和特制的抗拖移锚组成。
锚的质量为600kg,锚链选用无档普通链环,近浅海观测网的常用型号及其参数在附表中列出。
钢管共4节,每节长度1m,直径为50mm,每节钢管的质量为10kg。
要求锚链末端与锚的链接处的切线方向与海床的夹角不超过16度,否则锚会被拖行,致使节点移位丢失。
水声通讯系统安装在一个长1m、外径30cm的密封圆柱形钢桶内,设备和钢桶总质量为100kg。
钢桶上接第4节钢管,下接电焊锚链。
钢桶竖直时,水声通讯设备的工作效果最佳。
若钢桶倾斜,则影响设备的工作效果。
钢桶的倾斜角度(钢桶与竖直线的夹角)超过5度时,设备的工作效果较差。
为了控制钢桶的倾斜角度,钢桶与电焊锚链链接处可悬挂重物球。
图1 传输节点示意图(仅为结构模块示意图,未考虑尺寸比例)系泊系统的设计问题就是确定锚链的型号、长度和重物球的质量,使得浮标的吃水深度和游动区域及钢桶的倾斜角度尽可能小。
问题1某型传输节点选用II型电焊锚链22.05m,选用的重物球的质量为1200kg。
现将该型传输节点布放在水深18m、海床平坦、海水密度为1.025×10³kg/m3的海域。
若海水静止,分别计算海面风速为12m/s和24m/s时钢桶和各节钢管的倾斜角度、锚链形状、浮标的吃水深度和游动区域。
问题2在问题1的假设下,计算海面风速为36m/s时钢桶和各节钢管的倾斜角度、锚链形状和浮标的游动区域。
请调节重物球的质量,使得钢桶的倾斜角度不超过5度,锚链在锚点与海床的夹角不超过16度。
问题3 由于潮汐等因素的影响,布放海域的实测水深介于16m~20m之间。
![[理学]数学建模c题-精品文档](https://uimg.taocdn.com/049fe5af680203d8ce2f249b.webp)
企业退休职工养老金制度的改革摘要近30年来我国经济发展迅速,工资增长率也较高;而发达国家的经济和工资增长率都较低。
未来中国经济的发展和社会平均工资快速增长后也将趋于平稳。
我们通过建立Logistic 模型得到未来社会平均工资的预测值⎪⎪⎭⎫ ⎝⎛⎪⎭⎫ ⎝⎛-+=-t t e C 11924.015667000001700000,参考附件1,从而得到2011年至2035年山东省的职工的年平均工资。
取附件2中企业各年龄段职工工资与该企业平均工资之比作为缴费指数,根据养老金以及替代率的计算方法得到该企业职工自2000年起分别从30岁、40岁开始缴养老保险,一直缴费到退休(55岁,60岁,65岁)时的各种情况下的职工自 2000年起从30岁开始缴养老保险,一直缴费到退休(55岁,60岁,65岁),收支平衡时的年龄分别为:59,63,68。
我们可以尝试通过延迟退休年龄,或增大基础养老金计算公式中的系数(即适当增大政府预算)来达到国家所要求的目标替代率,且比较容易维持收支平衡点。
并且随着时间的推移,在不出现大的经济波动的情况下,养老金保险率会逐渐增大,但收支平衡点不易维持。
关键词:Logistic 模型 预测 养老金替代率 收支平衡问题重述养老金也称退休金,是一种根据劳动者对社会所作贡献及其所具备享受养老保险的资格,以货币形式支付的保险待遇,用于保障职工退休后的基本生活需要。
我国企业职工基本养老保险实行“社会统筹”与“个人账户”相结合的模式,即企业把职工工资总额按一定比例(20%)缴纳到社会统筹基金账户,再把职工个人工资按一定比例(8%)缴纳到个人账户。
这两个账户我们合称为养老保险基金。
退休后,按职工在职期间每月(或年)的缴费工资与社会平均工资之比(缴费指数),再考虑到退休前一年的社会平均工资等因素,从社会统筹账户中拨出资金(基础养老金),加上个人工资账户中一定比例的资金(个人账户养老金),作为退休后每个月的养老金。
2013高教社杯全国大学生数学建模竞赛承诺书我们仔细阅读了《全国大学生数学建模竞赛章程》和《全国大学生数学建模竞赛参赛规则》(以下简称为“竞赛章程和参赛规则”,可从全国大学生数学建模竞赛网站下载)。
我们完全明白,在竞赛开始后参赛队员不能以任何方式(包括电话、电子邮件、网上咨询等)与队外的任何人(包括指导教师)研究、讨论与赛题有关的问题。
我们知道,抄袭别人的成果是违反竞赛章程和参赛规则的,如果引用别人的成果或其他公开的资料(包括网上查到的资料),必须按照规定的参考文献的表述方式在正文引用处和参考文献中明确列出。
我们郑重承诺,严格遵守竞赛章程和参赛规则,以保证竞赛的公正、公平性。
如有违反竞赛章程和参赛规则的行为,我们将受到严肃处理。
我们授权全国大学生数学建模竞赛组委会,可将我们的论文以任何形式进行公开展示(包括进行网上公示,在书籍、期刊和其他媒体进行正式或非正式发表等)。
我们参赛选择的题号是(从A/B/C/D中选择一项填写):C我们的参赛报名号为(如果赛区设置报名号的话):所属学校(请填写完整的全名):石家庄职业技术学院参赛队员(打印并签名):1.魏鹏飞2.邢磊3.刘力恒指导教师或指导教师组负责人(打印并签名):陈佩宁(论文纸质版与电子版中的以上信息必须一致,只是电子版中无需签名。
以上内容请仔细核对,提交后将不再允许做任何修改。
如填写错误,论文可能被取消评奖资格。
)日期:2013年9月16日赛区评阅编号(由赛区组委会评阅前进行编号):2013高教社杯全国大学生数学建模竞赛编号专用页赛区评阅编号(由赛区组委会评阅前进行编号):全国评阅编号(由全国组委会评阅前进行编号):C题:古塔的变形摘要古塔由于长时间承受自重、气温、风力等各种作用,偶然还要受地震、飓风的影响,古塔会产生各种变形,诸如倾斜、弯曲、扭曲等。
为保护古塔,文物部门需适时对古塔进行观测,了解各种变形量,以制定必要的保护措施。
对于第一个问题,求中心点坐标,采用的是均值法,由于前两次测量中第13层第5个点没有数据,要是采用均值法求中心坐标,会产生较大的误差,所以在求第13层中心坐标,采用的是拟合法。
承诺书我们仔细阅读了五一数学建模联赛的竞赛规则。
我们完全明白,在竞赛开始后参赛队员不能以任何方式(包括电话、电子邮件、网上咨询等)与本队以外的任何人(包括指导教师)研究、讨论与赛题有关的问题。
我们知道,抄袭别人的成果是违反竞赛规则的, 如果引用别人的成果或其它公开的资料(包括网上查到的资料),必须按照规定的参考文献的表述方式在正文引用处和参考文献中明确列出。
我们郑重承诺,严格遵守竞赛规则,以保证竞赛的公正、公平性。
如有违反竞赛规则的行为,我们愿意承担由此引起的一切后果。
我们授权五一数学建模联赛赛组委会,可将我们的论文以任何形式进行公开展示(包括进行网上公示,在书籍、期刊和其他媒体进行正式或非正式发表等)。
我们参赛选择的题号为(从A/B/C中选择一项填写):我们的报名参赛队号为:参赛组别(研究生或本科或专科):所属学校(请填写完整的全名)参赛队员(打印并签名) :1.2.3.日期:年月日获奖证书邮寄地址:邮政编码:收件人姓名:联系电话:编号专用页竞赛评阅编号(由竞赛评委会评阅前进行编号):裁剪线裁剪线裁剪线竞赛评阅编号(由竞赛评委会评阅前进行编号):参赛队伍的参赛号码:(请各参赛队提前填写好):题目城市工业企业评价及能源分配优化设计摘要本文旨在研究能源总量控制下的城市工业企业的评价及能源分配的优化设计。
量化分析产业结构及能源消费特征,就此进行工业企业发展水平进行综合评价;基于不同的要求,能源总量控制下对合理能源分配的方案设计与优化。
在问题一中,从题目中所给的附件中工业企业能源消耗、产值、利税、员工人数的数据中挖掘与发现,从中分析出量化产业结构及能源消费特征的指标参数。
产业结构的量化指标:产业人员分配结构向量、产业生产结构向量、产业最终产品结构向量及产业消耗结构向量;能源消费的量化指标:产业消耗结构向量、产业人均能耗结构向量,并进行量化,从而两者结合充分量化能源消耗的量化趋势,在向低消耗的可持续协调化经济模式趋近,且其特征值大于1,综合指数为75.35,综合水平较高,可持续发展性高。
2016年武汉理工大学数学建模暑期培训练习题1、编写MATLAB 和lingo 程序求解下列方程(组) (1)4xsin x cos x +=(2) x x 24-= (3)求方程()074223=---=x x x x f 在[]43,中的根的近似值.(4)0432=--x x(5)12341234123420,3230,4350.x x x x x x x x x x x x +-+=⎧⎪-+-=⎨⎪+-+=⎩(6)⎪⎩⎪⎨⎧=+-=++--=++.x x x ,x x x ,x x x 31032202412253213213212、编写lingo 程序求解下列最优化问题 (1)⎪⎪⎩⎪⎪⎨⎧≥≥-++-≤+-+-=-+-.x ,x ,x ,x ,x x x x ,x x x x ,x x x x .t .s 无约束43214321432143210232142224 (2)32132-2x x x z min +=⎪⎩⎪⎨⎧≥≤≤-+-=++-.x ,x ,x ,x x x ,x x x .t .s 无约束32132142100624 (3)213x x z max -=⎪⎪⎩⎪⎪⎨⎧≥≤+≥+≤-.x ,x ,x x ,x x ,x x .t .s 为整数052104532321212121 (4)32152-3x x x z max +=⎪⎪⎪⎩⎪⎪⎪⎨⎧=≤+≤+≤++≤-+.x ,x ,x ,x x ,x x ,x x x ,x x x .t .s 1064344223213221321321或 (5)||4||3||2||min4321x x x x z +++=s.t.⎪⎪⎩⎪⎪⎨⎧-=+--=-+-=+--2132130432143214321x x x x x x x x x x x x (6)求图中点1v 到各点的最短路(不可逆行).3、先建立问题的数学模型,再编写lingo 程序求解(1)某厂每日8小时的产量不低于1800件.为了进行质量控制,计划聘请两种不同水平的检验员.一级检验员的标准为:速度25件/小时,正确率98%,计时工资4元/小时;二级检验员的标准为:速度15小时/件,正确率95%,计时工资3元/小时.检验员每错检一次,工厂要损失2元.为使总检验费用最省,该工厂应聘一级、二级检验员各几名?(2)某饲料场饲养动物出售,设每头动物每天至少需700克蛋白质、30克矿物质、100毫克维生素.现有5种饲料可供选用,各种饲料每公斤营养成分含量及单价如表所示:要求确定既满足动物生长的营养需要,又使费用最省的选用饲料的方案.(3)某医院护士值班班次、每班工作时间及各班所需护士数如表所示.每班护士值班开始时向病房报到,并连续工作8小时.试决定该医院最少需要多少名护士,以满足轮班需要.(4)一艘货轮分前、中、后三个舱位,它们的容积与最大允许载重量如表1所示.现有三种货物待运,已知有关数据列于表2.为了航运安全,前、中、后舱的实际载重量上大体保持各舱最大允许载重量的比例关系.具体要求:前、后舱分别与中舱之间载重量比例上偏差不超过15%,前后舱之间不超过10%.问该货轮应装载A,B,C各多少件运费收入才最大?表1表2(5)某市有三个面粉厂,它们供给三个面食加工厂所需的面粉.各面粉厂的产量、各面食加工厂加工面粉的能力、各面食加工厂和各面粉厂之间的单位运价如下表所示.假定在第1,2和3面食加工厂制作单位面粉食品的利润分别为12元、16元和11元,试确定使总收益最大的面粉分配计划.(6)1,2,3三个城市每年需分别供应电力320,250和350单位,由I,II两个电站提供,它们的最大可供电量分别为400个单位和450个单位,单位费用如下表所示.由于需要量大于可供量,决定城市1的供应量可减少0单位~30单位,城市2的供应量不变,城市3的供应量不能少于270单位,试求总费用最低的分配方案(将可供电量用完).(7)有三种资源被用于生产三种产品,资源量、产品单件可变费用、单件售价、资源单耗量及组织三种产品生产的固定费用见下表.要求制定一个生产计划,使总收益最大.(8)某商业公司计划开办5家新商店.为了尽早建成营业,商业公司决定由5家建筑公司分别承建.已知建筑公司A i(i=1,2,3,4,5)对新商店B j(j=1,2,3,4,5)的建造费用的报价(万元)为c ij(i,j=1,2,3,4,5),见下表.商业公司应当对5家建筑公司怎样分配建造任务,才能使总的建造费用最少?(9)篮球队需要选择5名队员组成出场阵容参加比赛.8名队员的身高及擅长位置见下表:出场阵容应满足以下条件:(1)只能有一名中锋上场;(2)至少有一名后卫;(3)如1号和4号均上场,则6号不出场;(4)2号和8号至少有一个不出场.问应当选择哪5名队员上场,才能使出场队员平均身高最高?(10)有5项设计任务可供选择.各项设计任务的预期完成时间分别为3,8,5,4,10周,设计报酬分别为7,17,11,9,21万元.设计任务只能一项一项地进行,总的期限是20周.选择任务时必须满足下面要求:(1)至少完成3项设计任务;(2)若选择任务1,必须同时选择任务2;(3)任务3和任务4不能同时选择.应当选择那些设计任务,才能使总的设计报酬最大?(11)公司在各地有4项业务,选定了4位业务员去分别处理.由于业务能力、经验和其它情况的不同,4位业务员处理这4项业务的费用(单位:元)各不相同,见下表:应当怎样分派任务,才能使总的业务费最少?(12)某工厂使用一台设备,每年年初工厂都要作出决定,如果继续使用旧设备,要付维修费;若购买一台新设备,要付购买费.试制定一个5年的更新计划,使总支出最少.设备在各年的购买费,及不同机器役龄时的残值与维修费见下表:(提示:转化为最短路问题)(13)已知某地区的交通网络如图所示,其中点代表居民小区,边代表公路,边4、MATLAB 编程训练题(1)在matlab 的命令窗口里完成如下计算,其中t 的值分别取-1,0,1,表达式如下:4/3)ty e π-=(2)自行产生一个5行5列的数组,得到最中间的三行三列矩阵。
五一建模c题五一建模c题五一建模c题51建模c题摘要:0 引言自改革开放以来,我国在高等教育方面获得了硕果累累的成绩。
在实行高等教育扩招后,我国高校的毛入学率逐年爬升,已进入高等教育大众化阶段,各类院校在数量上很大程度满足了人们对接受高等教育的需求。
但是,在高校数量快速增长的同时,我国高等教育质量仍然存在很多问题,例如,各高等院校经费投入不平衡,各校师资队伍建设情况良莠不齐等。
江苏省作为1个教育大省,其13个地级市的本科教育质量发展也存在不平衡现象。
因此,如何构建有效的本科教育质量评价体系并通过指标值的改良缩小本科教育发展的差异,已成为当前众多高校关注的热门问题。
国内外专家学者在本科教学质量评价的研究上已做了很多工作。
国内研究中,郑延福[1]采取求平均数法、秩和运算法、层次分析法对本科高校教师教学质量评价进行研究;胡有林[2]采取层次分析法构建地方普通本科院校内部教学质量评价的指标体系;杨生华[3]指出制定高校本科课堂教学质量评价指标体系要遵守科学性、系统性、可测性、可行性、可比性、方向性和发展性的原则;杜玉丰[4]等认为本科教学质量评价指标体系重定量指标轻定性指标,缺少教学各因素之间互动效应的评价指标,特别缺少那些评价潜伏因素(如创造性、主体性等)的弹性指标。
国外发达国家对本国的高等教育评估、认证制度几近都进行了研究,如美国、英国、德国、澳大利亚和日本等国,特别是美国特别重视高等教育认证制度,相干研究占多数。
美国俄亥俄州瑞欧戈兰大学教授孙建荣在《美国版卡耐基分类体系的新变化》中分析了卡耐基增进教学基金会2005版大学分类标准的新变化产生的背景并总结了其具体标准的变化,分析了其可能带来的影响[5]。
美国乔治亚州肯尼索州立大学万毅平教授在《美国的高校认证与教育评估》中对美国高校认证的类型、发挥的作用、履行认证的6大机构、认证的具体步骤和对认证机构评判结果的说明进行了详细介绍[6]。
澳大利亚墨尔本大学高等教育研究中心理查德·詹姆士所著的《澳大利亚本科教育评估与改进的经验》在总结澳大利亚高等教育的概况和全系统质量评估与保障框架的进展的基础上,对绩效指标体系的建立和高等教育评估的实践进行了分析[7]。
C题:“二孩政策”问题
多年来实施的严、紧计划生育政策对控制人口增长起到关键作用。
在优生优育政策的指引下,我国人口质量显著提高,但也带来了不利影响,生育率偏低、男女比例失衡、人口老龄化情况严重等问题。
2016年,在全国范围内放开二孩政策。
早在20年前,我国某些地区已经开始试点二孩政策。
例如:1985年以来,山西翼城一直是二孩政策的试点地区之一,那里既没有出现人口增长过快的问题,婴儿性别比也处于国际正常水平。
查阅相关材料并参考附件材料,建立数学模型,解决如下问题。
问题1:建立人口结构可持续发展指标体系,相关指标应具有科学性、代表性、全面性。
问题2:建立人口结构可持续发展的评价模型。
选取10个国内具有代表性的省(市、县),对这些地区的人口结构进行评价分级。
并结合你的模型给出当前A地区评价等级。
问题3:假设A地区不实行二孩政策,预测该地区未来20年的人口结构变化趋势;假设A地区实行二孩政策,给出二孩政策下最优出生率,使得该地区未来20年的人口结构更加合理。
问题4:二孩政策下,预测A地区未来10-20年按年龄划分的人口结构。
问题5:假如全面放开生育政策(不限制生育数量),在国民经济运行稳定的基础上预测A地区未来20年人口结构的变化趋势。