免费 jfreechart_生成折线图,饼图,柱状图,堆栈柱状图
- 格式:doc
- 大小:60.00 KB
- 文档页数:18
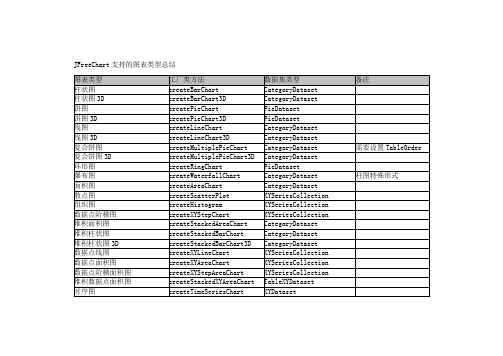
JFreeChart支持的图表类型总结JFreeChart类:void setAntiAlias(boolean flag) 字体模糊边界void setBackgroundImage(Image image) 背景图片void setBackgroundImageAlignment(int alignment) 背景图片对齐方式(参数常量在org.jfree.ui.Align类中定义)void setBackgroundImageAlpha(float alpha) 背景图片透明度(0.0~1.0)void setBackgroundPaint(Paint paint) 背景色void setBorderPaint(Paint paint) 边界线条颜色void setBorderStroke(Stroke stroke) 边界线条笔触void setBorderVisible(boolean visible) 边界线条是否可见-----------------------------------------------------------------------------------------------------------TextTitle类:void setFont(Font font) 标题字体void setPaint(Paint paint) 标题字体颜色void setText(String text) 标题内容-----------------------------------------------------------------------------------------------------------StandardLegend(Legend)类:void setBackgroundPaint(Paint paint) 图示背景色void setTitle(String title) 图示标题内容void setTitleFont(Font font) 图示标题字体void setBoundingBoxArcWidth(int arcWidth) 图示边界圆角宽void setBoundingBoxArcHeight(int arcHeight) 图示边界圆角高void setOutlinePaint(Paint paint) 图示边界线条颜色void setOutlineStroke(Stroke stroke) 图示边界线条笔触void setDisplaySeriesLines(boolean flag) 图示项是否显示横线(折线图有效)void setDisplaySeriesShapes(boolean flag) 图示项是否显示形状(折线图有效)void setItemFont(Font font) 图示项字体void setItemPaint(Paint paint) 图示项字体颜色void setAnchor(int anchor) 图示在图表中的显示位置(参数常量在Legend类中定义)-----------------------------------------------------------------------------------------------------------Axis类:void setVisible(boolean flag) 坐标轴是否可见void setAxisLinePaint(Paint paint) 坐标轴线条颜色(3D轴无效)void setAxisLineStroke(Stroke stroke) 坐标轴线条笔触(3D轴无效)void setAxisLineVisible(boolean visible) 坐标轴线条是否可见(3D轴无效)void setFixedDimension(double dimension) (用于复合表中对多坐标轴的设置)void setLabel(String label) 坐标轴标题void setLabelFont(Font font) 坐标轴标题字体void setLabelPaint(Paint paint) 坐标轴标题颜色void setLabelAngle(double angle)` 坐标轴标题旋转角度(纵坐标可以旋转)void setTickLabelFont(Font font) 坐标轴标尺值字体void setTickLabelPaint(Paint paint) 坐标轴标尺值颜色void setTickLabelsVisible(boolean flag) 坐标轴标尺值是否显示void setTickMarkPaint(Paint paint) 坐标轴标尺颜色void setTickMarkStroke(Stroke stroke) 坐标轴标尺笔触void setTickMarksVisible(boolean flag) 坐标轴标尺是否显示ValueAxis(Axis)类:void setAutoRange(boolean auto) 自动设置数据轴数据范围void setAutoRangeMinimumSize(double size) 自动设置数据轴数据范围时数据范围的最小跨度void setAutoTickUnitSelection(boolean flag) 数据轴的数据标签是否自动确定(默认为true)void setFixedAutoRange(double length) 数据轴固定数据范围(设置100的话就是显示MAXVALUE到MAXVALUE-100那段数据范围)void setInverted(boolean flag) 数据轴是否反向(默认为false)void setLowerMargin(double margin) 数据轴下(左)边距void setUpperMargin(double margin) 数据轴上(右)边距void setLowerBound(double min) 数据轴上的显示最小值void setUpperBound(double max) 数据轴上的显示最大值void setPositiveArrowVisible(boolean visible) 是否显示正向箭头(3D轴无效)void setNegativeArrowVisible(boolean visible) 是否显示反向箭头(3D轴无效)void setVerticalTickLabels(boolean flag) 数据轴数据标签是否旋转到垂直void setStandardTickUnits(TickUnitSource source) 数据轴的数据标签(可以只显示整数标签,需要将AutoTickUnitSelection设false)NumberAxis(ValueAxis)类:void setAutoRangeIncludesZero(boolean flag) 是否强制在自动选择的数据范围中包含0void setAutoRangeStickyZero(boolean flag) 是否强制在整个数据轴中包含0,即使0不在数据范围中void setNumberFormatOverride(NumberFormat formatter) 数据轴数据标签的显示格式void setTickUnit(NumberTickUnit unit) 数据轴的数据标签(需要将AutoTickUnitSelection设false)DateAxis(ValueAxis)类:void setMaximumDate(Date maximumDate) 日期轴上的最小日期void setMinimumDate(Date minimumDate) 日期轴上的最大日期void setRange(Date lower,Date upper) 日期轴范围void setDateFormatOverride(DateFormat formatter) 日期轴日期标签的显示格式void setTickUnit(DateTickUnit unit) 日期轴的日期标签(需要将AutoTickUnitSelection设false)void setTickMarkPosition(DateTickMarkPosition position) 日期标签位置(参数常量在org.jfree.chart.axis.DateTickMarkPosition类中定义)CategoryAxis(Axis)类:void setCategoryMargin(double margin) 分类轴边距void setLowerMargin(double margin) 分类轴下(左)边距void setUpperMargin(double margin) 分类轴上(右)边距void setVerticalCategoryLabels(boolean flag) 分类轴标题是否旋转到垂直void setMaxCategoryLabelWidthRatio(float ratio) 分类轴分类标签的最大宽度-----------------------------------------------------------------------------------------------------------Plot类:void setBackgroundImage(Image image) 数据区的背景图片void setBackgroundImageAlignment(int alignment) 数据区的背景图片对齐方式(参数常量在org.jfree.ui.Align类中定义)void setBackgroundPaint(Paint paint) 数据区的背景图片背景色void setBackgroundAlpha(float alpha) 数据区的背景透明度(0.0~1.0)void setForegroundAlpha(float alpha) 数据区的前景透明度(0.0~1.0)void setDataAreaRatio(double ratio) 数据区占整个图表区的百分比void setOutLinePaint(Paint paint) 数据区的边界线条颜色void setOutLineStroke(Stroke stroke) 数据区的边界线条笔触void setNoDataMessage(String message) 没有数据时显示的消息void setNoDataMessageFont(Font font) 没有数据时显示的消息字体void setNoDataMessagePaint(Paint paint) 没有数据时显示的消息颜色CategoryPlot(Plot)类:void setDataset(CategoryDataset dataset) 数据区的2维数据表void setColumnRenderingOrder(SortOrder order) 数据分类的排序方式void setAxisOffset(Spacer offset) 坐标轴到数据区的间距void setOrientation(PlotOrientation orientation) 数据区的方向(PlotOrientation.HORIZONTAL或PlotOrientation.VERTICAL)void setDomainAxis(CategoryAxis axis) 数据区的分类轴void setDomainAxisLocation(AxisLocation location) 分类轴的位置(参数常量在org.jfree.chart.axis.AxisLocation类中定义)void setDomainGridlinesVisible(boolean visible) 分类轴网格是否可见void setDomainGridlinePaint(Paint paint) 分类轴网格线条颜色void setDomainGridlineStroke(Stroke stroke) 分类轴网格线条笔触void setRangeAxis(ValueAxis axis) 数据区的数据轴void setRangeAxisLocation(AxisLocation location) 数据轴的位置(参数常量在org.jfree.chart.axis.AxisLocation类中定义)void setRangeGridlinesVisible(boolean visible) 数据轴网格是否可见void setRangeGridlinePaint(Paint paint) 数据轴网格线条颜色void setRangeGridlineStroke(Stroke stroke) 数据轴网格线条笔触void setRenderer(CategoryItemRenderer renderer) 数据区的表示者(详见Renderer组)void addAnnotation(CategoryAnnotation annotation) 给数据区加一个注释void addRangeMarker(Marker marker,Layer layer) 给数据区加一个数值范围区域PiePlot(Plot)类:void setDataset(PieDataset dataset) 数据区的1维数据表void setIgnoreNullValues(boolean flag) 忽略无值的分类void setCircular(boolean flag) 饼图是否一定是正圆void setStartAngle(double angle) 饼图的初始角度void setDirection(Rotation direction) 饼图的旋转方向void setExplodePercent(int section,double percent) 抽取的那块(1维数据表的分类下标)以及抽取出来的距离(0.0~1.0),3D饼图无效void setLabelBackgroundPaint(Paint paint) 分类标签的底色void setLabelFont(Font font) 分类标签的字体void setLabelPaint(Paint paint) 分类标签的字体颜色void setLabelLinkMargin(double margin) 分类标签与图的连接线边距void setLabelLinkPaint(Paint paint) 分类标签与图的连接线颜色void setLabelLinkStroke(Stroke stroke) 分类标签与图的连接线笔触void setLabelOutlinePaint(Paint paint) 分类标签边框颜色void setLabelOutlineStroke(Paint paint) 分类标签边框笔触void setLabelShadowPaint(Paint paint) 分类标签阴影颜色void setMaximumLabelWidth(double width) 分类标签的最大长度(0.0~1.0)void setPieIndex(int index) 饼图的索引(复合饼图中用到)void setSectionOutlinePaint(int section,Paint paint) 指定分类饼的边框颜色void setSectionOutlineStroke(int section,Stroke stroke) 指定分类饼的边框笔触void setSectionPaint(int section,Paint paint) 指定分类饼的颜色void setShadowPaint(Paint paint) 饼图的阴影颜色void setShadowXOffset(double offset) 饼图的阴影相对图的水平偏移void setShadowYOffset(double offset) 饼图的阴影相对图的垂直偏移void setLabelGenerator(PieSectionLabelGenerator generator) 分类标签的格式,设置成null则整个标签包括连接线都不显示void setToolTipGenerator(PieToolTipGenerator generator) MAP中鼠标移上的显示格式void setURLGenerator(PieURLGenerator generator) MAP中钻取链接格式PiePlot3D(PiePlot)类:void setDepthFactor(double factor) 3D饼图的Z轴高度(0.0~1.0)MultiplePiePlot(Plot)类:void setLimit(double limit) 每个饼图之间的数据关联(详细比较复杂)void setPieChart(JFreeChart pieChart) 每个饼图的显示方式(见JFreeChart类个PiePlot类)-----------------------------------------------------------------------------------------------------------AbstractRenderer类:void setItemLabelAnchorOffset(double offset) 数据标签的与数据点的偏移void setItemLabelsVisible(boolean visible) 数据标签是否可见void setItemLabelFont(Font font) 数据标签的字体void setItemLabelPaint(Paint paint) 数据标签的字体颜色void setItemLabelPosition(ItemLabelPosition position) 数据标签位置void setPositiveItemLabelPosition(ItemLabelPosition position) 正数标签位置void setNegativeItemLabelPosition(ItemLabelPosition position) 负数标签位置void setOutLinePaint(Paint paint) 图形边框的线条颜色void setOutLineStroke(Stroke stroke) 图形边框的线条笔触void setPaint(Paint paint) 所有分类图形的颜色void setShape(Shape shape) 所有分类图形的形状(如折线图的点)void setStroke(Stroke stroke) 所有分类图形的笔触(如折线图的线)void setSeriesItemLabelsVisible(int series,boolean visible) 指定分类的数据标签是否可见void setSeriesItemLabelFont(int series,Font font) 指定分类的数据标签的字体void setSeriesItemLabelPaint(int series,Paint paint) 指定分类的数据标签的字体颜色void setSeriesItemLabelPosition(int series,ItemLabelPosition position) 数据标签位置void setSeriesPositiveItemLabelPosition(int series,ItemLabelPosition position) 正数标签位置void setSeriesNegativeItemLabelPosition(int series,ItemLabelPosition position) 负数标签位置void setSeriesOutLinePaint(int series,Paint paint) 指定分类的图形边框的线条颜色void setSeriesOutLineStroke(int series,Stroke stroke) 指定分类的图形边框的线条笔触void setSeriesPaint(int series,Paint paint) 指定分类图形的颜色void setSeriesShape(int series,Shape shape) 指定分类图形的形状(如折线图的点)void setSeriesStroke(int series,Stroke stroke) 指定分类图形的笔触(如折线图的线)AbstractCategoryItemRenderer(AbstractRenderer)类:void setLabelGenerator(CategoryLabelGenerator generator) 数据标签的格式void setToolTipGenerator(CategoryToolTipGenerator generator) MAP中鼠标移上的显示格式void setItemURLGenerator(CategoryURLGenerator generator) MAP中钻取链接格式void setSeriesLabelGenerator(int series,CategoryLabelGenerator generator) 指定分类的数据标签的格式void setSeriesToolTipGenerator(int series,CategoryToolTipGenerator generator) 指定分类的MAP中鼠标移上的显示格式void setSeriesItemURLGenerator(int series,CategoryURLGenerator generator) 指定分类的MAP中钻取链接格式BarRenderer(AbstractCategoryItemRenderer)类:void setDrawBarOutline(boolean draw) 是否画图形边框void setItemMargin(double percent) 每个BAR之间的间隔void setMaxBarWidth(double percent) 每个BAR的最大宽度void setMinimumBarLength(double min) 最短的BAR长度,避免数值太小而显示不出void setPositiveItemLabelPositionFallback(ItemLabelPosition position) 无法在BAR中显示的正数标签位置void setNegativeItemLabelPositionFallback(ItemLabelPosition position) 无法在BAR中显示的负数标签位置BarRenderer3D(BarRenderer)类:void setWallPaint(Paint paint) 3D坐标轴的墙体颜色StackedBarRenderer(BarRenderer)类:没有特殊的设置StackedBarRenderer3D(BarRenderer3D)类:没有特殊的设置GroupedStackedBarRenderer(StackedBarRenderer)类:void setSeriesToGroupMap(KeyToGroupMap map) 将分类自由的映射成若干个组(KeyToGroupMap.mapKeyToGroup(series,group))LayeredBarRenderer(BarRenderer)类:void setSeriesBarWidth(int series,double width) 设定每个分类的宽度(注意设置不要使某分类被覆盖)WaterfallBarRenderer(BarRenderer)类:void setFirstBarPaint(Paint paint) 第一个柱图的颜色void setLastBarPaint(Paint paint) 最后一个柱图的颜色void setPositiveBarPaint(Paint paint) 正值柱图的颜色void setNegativeBarPaint(Paint paint) 负值柱图的颜色IntervalBarRenderer(BarRenderer)类:需要传IntervalCategoryDataset作为数据源GanttBarRenderer(IntervalBarRenderer)类:void setCompletePaint(Paint paint) 完成进度颜色void setIncompletePaint(Paint paint) 未完成进度颜色void setStartPercent(double percent) 设置进度条在整条中的起始位置(0.0~1.0)void setEndPercent(double percent) 设置进度条在整条中的结束位置(0.0~1.0)StatisticBarRenderer(BarRenderer)类:需要传StatisticCategoryDataset作为数据源LineAndShapeRenderer(AbstractCategoryItemRenderer)类:void setDrawLines(boolean draw) 是否折线的数据点之间用线连void setDrawShapes(boolean draw) 是否折线的数据点根据分类使用不同的形状void setShapesFilled(boolean filled) 所有分类是否填充数据点图形void setSeriesShapesFilled(int series,boolean filled) 指定分类是否填充数据点图形void setUseFillPaintForShapeOutline(boolean use) 指定是否填充数据点的Paint也被用于画数据点形状的边框LevelRenderer(AbstractCategoryItemRenderer)类:void setItemMargin(double percent) 每个分类之间的间隔void setMaxItemWidth(double percent) 每个分类的最大宽度CategoryStepRenderer(AbstractCategoryItemRenderer)类:void setStagger(boolean shouldStagger) 不同分类的图是否交错MinMaxCategoryRenderer(AbstractCategoryItemRenderer)类:void setDrawLines(boolean drawLines) 是否在每个分类线间画连接线void setGroupPaint(Paint groupPaint) 一组图形连接线的颜色void setGroupStroke(Stroke groupStroke) 一组图形连接线的笔触void setMaxIcon(Icon maxIcon) 最大值的ICONvoid setMinIcon(Icon minIcon) 最小值的ICONvoid setObjectIcon(Icon objectIcon) 所有值的ICONAreaRender(AbstractCategoryItemRenderer)类:没有特殊的设置StackedAreaRender(AreaRender)类:没有特殊的设置。

JFreeChart生成折线图并保存为图片import java.io.File;import java.io.FileNotFoundException; import java.io.FileOutputStream;import java.io.IOException;import org.jfree.chart.ChartFactory;import org.jfree.chart.ChartUtilities;import org.jfree.chart.JFreeChart;import org.jfree.chart.plot.PlotOrientation; import org.jfree.chart.plot.XYPlot;import org.jfree.data.xy.XYDataset;import org.jfree.data.xy.XYSeries;import org.jfree.data.xy.XYSeriesCollection;public class CreateJFreeChartXYLine {/*** 创建JFreeChart LineXY Chart(折线图)*/public static void main(String[] args) {//步骤1:创建XYDataset对象(准备数据)XYDataset dataset = createXYDataset();//步骤2:根据Dataset 生成JFreeChart对象,以及做相应的设置JFreeChart freeChart = createChart(dataset);//步骤3:将JFreeChart对象输出到文件,Servlet输出流等saveAsFile(freeChart, "F:\\jfreechart\\lineXY.png", 600, 400);}// 保存为文件public static void saveAsFile(JFreeChart chart, String outputPath,int weight, int height) {FileOutputStream out = null;try {File outFile = new File(outputPath);if (!outFile.getParentFile().exists()) {outFile.getParentFile().mkdirs();}out = new FileOutputStream(outputPath);// 保存为PNGChartUtilities.writeChartAsPNG(out, chart, weight, height);// 保存为JPEG// ChartUtilities.writeChartAsJPEG(out, chart, weight, height);out.flush();} catch (FileNotFoundException e) {e.printStackTrace();} catch (IOException e) {e.printStackTrace();} finally {if (out != null) {try {out.close();} catch (IOException e) {// do nothing}}}}// 根据XYDataset创建JFreeChart对象public static JFreeChart createChart(XYDataset dataset) {// 创建JFreeChart对象:ChartFactory.createXYLineChartJFreeChart jfreechart = ChartFactory.createXYLineChart("XYLine Chart Demo", // 标题"年分", // categoryAxisLabel (category轴,横轴,X轴标签)"数量", // valueAxisLabel(value轴,纵轴,Y轴的标签)dataset, // datasetPlotOrientation.VERTICAL,true, // legendfalse, // tooltipsfalse); // URLs// 使用CategoryPlot设置各种参数。

JFreechart完整柱状图import class AttendanceMain{p ublic static void main(String[] args) throws IOException{double[][] data = new double[][]{{100,96,98,95,99,100,92,93,91,94,96},{97,96,98,95,99,100,92,93,91,94,96},{97,96,98,95,99,100,92,93,91,94,96},{97,96,98,95,99,100,92,93,91,94,96}};String[] columnKeys = { "测控1班", "测控2班", "信号1班", "信号2班", "信号3班" ,"计通1班","计通2班","城轨1班","城轨2班","计应1班","计应2班"};String[] rowKeys = {"2021级","2021级","2021级","2021级"};new A ttendance(data,rowKeys,columnKeys );ut,;etItemFont(new Font("华文行楷",,20));//设置上下左右显示位置;;//这句代码解决了底部汉字乱码的问题(new Font("华文行楷",,20));//显示每一个柱的数值,并修改该数值的字体属性(new StandardCategoryItemLabelGenerator());//显示每一个柱的数值(true);//注意:此句很关键,若无此句,那数字的显示会被覆盖,给人数字没有显示出来的问题//(new ItemLabelPosition( , );(10D);// 设置柱形图上的文字偏离值//(true);(render);//利用咱们设计的效果//设置纵横坐标的显示位置//学校显示在下端(柱子竖直)或左侧(柱子水平);//人数显示在下端(柱子水平)或左侧(柱子竖直);//设定柱子上面的颜色(0, ; // 给series1 Bar(1, ("#8979FF")); // 给series2 Bar(2, ; // 给series4 Bar(3, new Color(200, 50, 50)); // 给series5 Bar(0,;//边框为黑色(1,;//边框为黑色(2,; //边框为黑色(3,;//边框为黑色FileOutputStream gf = null;try{gf = new F ileOutputStream("E:\\");//将报表保留为JPG文件(gf, //文件保留物理路径包括路径和文件名1f, //图片质量chart, //图表对象1600, //图像宽度668, //图像高度null); //显示信息}finally{try{//关闭输出流();"success");}catch(Exception e){}}}}。
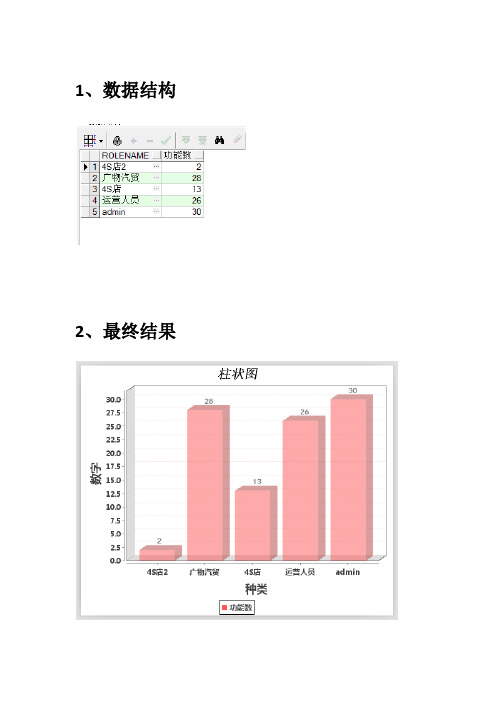
1、数据结构2、最终结果3、操作类public class BarTest {private static final long serialVersionUID=11;/*** 生成制图对象*@param is3D 是否为3D效果*@return JFreeChart对象*/public static JFreeChart createChart() {JFreeChart chart =null;chart = ChartFactory. createBarChart3D("柱状图","种类","数字",createDaSet(),PlotOrientation.VERTICAL,true,true,false);//设置柱状图,主标题的文字chart.setTitle(new TextTitle("柱状图",new Font("宋体",Font.BOLD+Font.ITALIC,20)));//设置柱状图最下方说明文字chart.getLegend().setItemFont(new Font("微软雅黑",Font.BOLD,12));CategoryPlot plot=chart.getCategoryPlot();plot.setForegroundAlpha(0.5F);//设置透明度,0.5F,1为不透明,0为全透明CategoryAxis axis=plot.getDomainAxis();//设置X轴坐标上标题的文字axis.setLabelFont(new Font("微软雅黑",Font.BOLD,18));//设置X轴坐标上的文字axis.setTickLabelFont(new Font("微软雅黑",Font.BOLD,12));ValueAxis valueAxis=plot.getRangeAxis();//设置Y轴坐标上标题的文字valueAxis.setLabelFont(new Font("微软雅黑",Font.BOLD,18));//设置Y轴坐标上的文字valueAxis.setTickLabelFont(new Font("微软雅黑",Font.BOLD,12));//设置网格背景颜色plot.setBackgroundPaint(Color.white);//设置网格竖线颜色plot.setDomainGridlinePaint(Color.pink);//设置网格横线颜色plot.setRangeGridlinePaint(Color.pink);//显示每个柱的数值,并修改该数值的字体属性BarRenderer3D render=new BarRenderer3D();render.setBaseItemLabelGenerator(new StandardCateg oryItemLabelGenerator());render.setBaseItemLabelsVisible(true);render.setBaseItemLabelPaint(Color.black);render.setBaseItemLabelFont(new Font("黑体",Font.BOLD,12));//默认的数字显示在柱子中,调整数字的显示render.setBasePositiveItemLabelPosition(new ItemLabelPosition(ItemLabelAnchor.OUTSIDE12,TextAnchor.BASELINE_LEFT));render.setItemLabelAnchorOffset(10D);//设置每个地区所包含的平行柱之间的距离//render.setItemMargin(0.3);plot.setRenderer(render);//设置横轴、纵轴的显示位置plot.setDomainAxisLocation(AxisLocation.BOTTOM_OR_ RIGHT);plot.setRangeAxisLocation(AxisLocation.BOTTOM_OR_L EFT);return chart;}/*** 创建CategoryDataset对象,连接数据库,获取数据*@return*/public static CategoryDataset createDaSet(){// 获取数据库连接Connection conn = ConnectionManager. getConnection();JDBCCategoryDataset dataset =null; //数据集合try{// 通过JDBC创建数据集合dataset =new JDBCCategoryDataset(conn);// SQL语句String sql ="select a.rolename,count(*) 功能数 from yxz_user_role a, yxz_role_function b, "+" yxz_system_function c whereb.functionid =c.fun_id and a.roleid = b.roleid group by a.rolename ";//System.out.println(sql);// 查询并向数据集合中添加数据dataset.executeQuery(sql);}catch(Exception e) {e.printStackTrace();}finally{// 关闭数据库连接ConnectionManager. closeConnection(conn);}return dataset;}//生成图片public static String saveAsFile(JFreeChart chart,String outputPath,int width,int height){FileOutputStream out=null;try{File file=new File(outputPath);if(!file.getParentFile().exists()){file.getParentFile().mkdirs();}out=new FileOutputStream(outputPath);//保存图片ChartUtilities. writeChartAsPNG(out, chart, width, height);//ChartUtilities.writeChartAsJPEG(out, chart, width, height);out.flush();}catch(FileNotFoundException e) {e.printStackTrace();}catch(Exception e) {e.printStackTrace();}finally{if(out !=null) {try{out.close();}catch(IOException e) {}}}return outputPath;}public static void main(String[] args) {//步骤2:根据Dataset 生成JFreeChart对象,以及做相应的设置JFreeChart chart = BarTest. createChart();BarTest. saveAsFile(chart,"c:\\jfreechart\\bar1.png", 500, 400);}}。
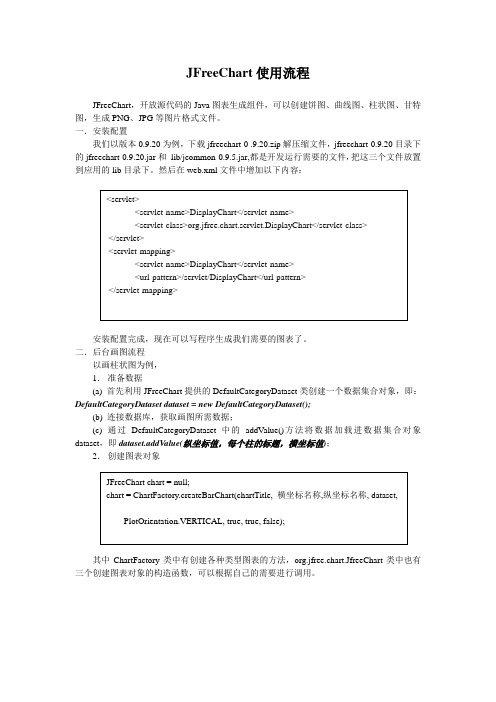
JFreeChart使用流程JFreeChart,开放源代码的Java图表生成组件,可以创建饼图、曲线图、柱状图、甘特图,生成PNG、JPG等图片格式文件。
一.安装配置我们以版本0.9.20为例,下载jfreechart-0 .9.20.zip解压缩文件,jfreechart-0.9.20目录下的jfreechart-0.9.20.jar和lib/jcommon-0.9.5.jar,都是开发运行需要的文件,把这三个文件放置到应用的lib目录下。
然后在web.xml文件中增加以下内容:安装配置完成,现在可以写程序生成我们需要的图表了。
二.后台画图流程以画柱状图为例,1.准备数据(a) 首先利用JFreeChart提供的DefaultCategoryDataset类创建一个数据集合对象,即:DefaultCategoryDataset dataset = new DefaultCategoryDataset();(b) 连接数据库,获取画图所需数据;(c) 通过DefaultCategoryDataset 中的addV alue()方法将数据加载进数据集合对象dataset,即dataset.addV alue(纵坐标值,每个柱的标题,横坐标值);2.创建图表对象其中ChartFactory类中有创建各种类型图表的方法,org.jfree.chart.JfreeChart类中也有三个创建图表对象的构造函数,可以根据自己的需要进行调用。
3.对图表对象进行设置通过CategoryPlot类和BarRenderer类对图表对象的一些属性进行设置,如图的背景色、柱之间的距离、图的链接、图标题的字体等。
4.生成图表文件在临时文件夹中生成图表文件,可以定制图表的高度和宽度。
filename为图表文件名,即:5.将图表文件写入PrintWriter中,其中pw为PrintWriter对象;三.前台开发在jsp页面中,调用后台画图JavaBean生成图表文件并返回图表文件名称,通过一个叫DisplayChart的servlet(即上面web.xml文件描述的那个servlet)来显示图表。
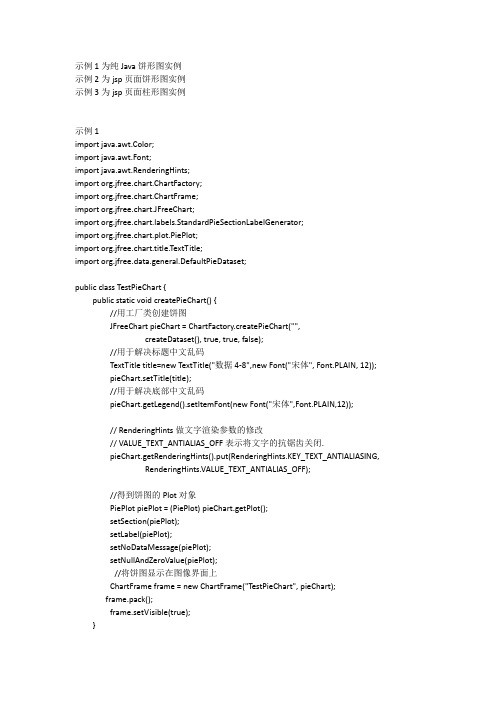
示例1为纯Java饼形图实例示例2为jsp页面饼形图实例示例3为jsp页面柱形图实例示例1import java.awt.Color;import java.awt.Font;import java.awt.RenderingHints;import org.jfree.chart.ChartFactory;import org.jfree.chart.ChartFrame;import org.jfree.chart.JFreeChart;import bels.StandardPieSectionLabelGenerator;import org.jfree.chart.plot.PiePlot;import org.jfree.chart.title.T extTitle;import org.jfree.data.general.DefaultPieDataset;public class TestPieChart {public static void createPieChart() {//用工厂类创建饼图JFreeChart pieChart = ChartFactory.createPieChart("",createDataset(), true, true, false);//用于解决标题中文乱码TextTitle title=new TextTitle("数据4-8",new Font("宋体", Font.PLAIN, 12));pieChart.setTitle(title);//用于解决底部中文乱码pieChart.getLegend().setItemFont(new Font("宋体",Font.PLAIN,12));// RenderingHints做文字渲染参数的修改// VALUE_TEXT_ANTIALIAS_OFF表示将文字的抗锯齿关闭.pieChart.getRenderingHints().put(RenderingHints.KEY_TEXT_ANTIALIASING, RenderingHints.VALUE_TEXT_ANTIALIAS_OFF);//得到饼图的Plot对象PiePlot piePlot = (PiePlot) pieChart.getPlot();setSection(piePlot);setLabel(piePlot);setNoDataMessage(piePlot);setNullAndZeroValue(piePlot);//将饼图显示在图像界面上ChartFrame frame = new ChartFrame("TestPieChart", pieChart);frame.pack();frame.setVisible(true);}public static DefaultPieDataset createDataset() {//设置数据DefaultPieDataset pieDataset = new DefaultPieDataset();pieDataset.setValue("经济", 0.1);pieDataset.setValue("政治", 3.63);pieDataset.setValue("车次", 2.84);pieDataset.setValue("里程", 2.1);pieDataset.setValue("秋", 2.80);return pieDataset;}public static void setSection(PiePlot pieplot) {//设置扇区颜色pieplot.setSectionPaint("经济", new Color(255, 142, 255));pieplot.setSectionPaint("政治", new Color(210, 128, 223));pieplot.setSectionPaint("车次", new Color(100, 96, 191));pieplot.setSectionPaint("里程", new Color(64, 255, 128));//设置扇区分离显示pieplot.setExplodePercent("秋", 0.2D);//设置扇区边框不可见pieplot.setSectionOutlinesVisible(false);}public static void setLabel(PiePlot pieplot) {//设置扇区标签显示格式:关键字:值(百分比)pieplot.setLabelGenerator(new StandardPieSectionLabelGenerator( "{0}:{1}({2} percent)"));//设置扇区标签颜色pieplot.setLabelBackgroundPaint(new Color(220, 220, 220));pieplot.setLabelFont((new Font("宋体", Font.PLAIN, 12)));}public static void setNoDataMessage(PiePlot pieplot) {//设置没有数据时显示的信息pieplot.setNoDataMessage("无数据");//设置没有数据时显示的信息的字体pieplot.setNoDataMessageFont(new Font("宋体", Font.BOLD, 14));//设置没有数据时显示的信息的颜色pieplot.setNoDataMessagePaint(Color.red);}public static void setNullAndZeroValue(PiePlot piePlot) {//设置是否忽略0和null值piePlot.setIgnoreNullValues(true);piePlot.setIgnoreZeroValues(true);}public static void main(String[] args) {createPieChart();}}示例2<%@ page language="java" import="java.io.*" pageEncoding="utf-8"%> <%@ page import="org.jfree.data.general.DefaultPieDataset"%><%@ page import="org.jfree.chart.*"%><%@ page import="org.jfree.chart.plot.*"%><%@ page import="org.jfree.chart.servlet.ServletUtilities"%><%@ page import="bels.StandardPieToolTipGenerator"%> <%@ page import="org.jfree.chart.urls.StandardPieURLGenerator"%><%@ page import="org.jfree.chart.entity.StandardEntityCollection"%><!DOCTYPE HTML PUBLIC "-//W3C//DTD HTML 4.01 Transitional//EN"><html><head><title>图形</title></head><body><%DefaultPieDataset data = new DefaultPieDataset();//数据初始化data.setValue("高中以下",380);data.setValue("高中",1620);data.setValue("大专",6100);data.setValue("本科",8310);data.setValue("硕士",3520);data.setValue("博士",180);//HttpSession session = request.getSession();PiePlot3D plot = new PiePlot3D(data);//生成一个3D饼图//plot.setURLGenerator(newStandardPieURLGenerator("DegreedView.jsp"));//设定图片链接JFreeChart chart = newJFreeChart("",JFreeChart.DEFAULT_TITLE_FONT, plot, true);chart.setBackgroundPaint(java.awt.Color.white);//可选,设置图片背景色chart.setTitle("程序员学历情况调查表-By Alpha");//可选,设置图片标题plot.setToolTipGenerator(newStandardPieToolTipGenerator());StandardEntityCollection sec = newStandardEntityCollection();ChartRenderingInfo info = new ChartRenderingInfo(sec);PrintWriter w = new PrintWriter(out);//输出MAP信息//500是图片长度,300是图片高度//String filename =ServletUtilities.saveChartAsPNG(chart,500,300,info,session);//.pngString filename =ServletUtilities.saveChartAsJPEG(chart,500,300,info,session);//.jpegChartUtilities.writeImageMap(w,"map0",info,true);String graphURL = request.getContextPath() +"/servlet/DisplayChart?filename=" + filename;%><P ALIGN="CENTER"><img src="<%=graphURL %>" width=500 height=300 border=0 usemap="#map0"> </P></body></html>注:web.xml配置<?xml version="1.0" encoding="UTF-8"?><web-app version="2.4"xmlns="/xml/ns/j2ee"xmlns:xsi="/2001/XMLSchema-instance"xsi:schemaLocation="/xml/ns/j2ee/xml/ns/j2ee/web-app_2_4.xsd"><servlet><servlet-name>DisplayChart</servlet-name><servlet-class>org.jfree.chart.servlet.DisplayChart</servlet-class> </servlet><servlet-mapping><servlet-name>DisplayChart</servlet-name><url-pattern>/servlet/DisplayChart</url-pattern></servlet-mapping><welcome-file-list><welcome-file>index.jsp</welcome-file></welcome-file-list></web-app>示例3<%@ page language="java" pageEncoding="utf-8"%><%@ page import="org.jfree.chart.ChartFactory"%><%@ page import="org.jfree.chart.ChartUtilities"%><%@ page import="org.jfree.chart.JFreeChart"%><%@ page import="org.jfree.chart.plot.PlotOrientation"%><%@ page import="org.jfree.data.category.DefaultCategoryDataset"%> <%@ page import="java.awt.Color"%><%@ page import="org.jfree.chart.renderer.category.BarRenderer3D"%> <%@ pageimport="bels.StandardCategoryItemLabelGenerator"%> <%@ page import="org.jfree.chart.axis.CategoryAxis"%><%@ page import="org.jfree.chart.plot.CategoryPlot"%><%@ page import="java.awt.*"%><%@ page import="org.jfree.chart.title.TextTitle"%><%@ page import="org.jfree.chart.axis.NumberAxis"%><!DOCTYPE HTML PUBLIC "-//W3C//DTD HTML 4.01 Transitional//EN"><html><head><title>柱形</title></head><body><%DefaultCategoryDataset dataset = newDefaultCategoryDataset();dataset.addValue(150, " 北京 ", " 苹果 ");dataset.addValue(530, " 上海 ", " 苹果 ");dataset.addValue(160, " 广州 ", " 苹果 ");dataset.addValue(120, " 北京 ", " 梨子 ");dataset.addValue(230, " 上海 ", " 梨子 ");dataset.addValue(360, " 广州 ", " 梨子 ");dataset.addValue(600, " 北京 ", " 葡萄 ");dataset.addValue(430, " 上海 ", " 葡萄 ");dataset.addValue(560, " 广州 ", " 葡萄 ");dataset.addValue(400, " 北京 ", " 香蕉 ");dataset.addValue(530, " 上海 ", " 香蕉 ");dataset.addValue(660, " 广州 ", " 香蕉 ");dataset.addValue(500, " 北京 ", " 荔枝 ");dataset.addValue(630, " 上海 ", " 荔枝 ");dataset.addValue(430, " 广州 ", " 荔枝 ");JFreeChart chart = ChartFactory.createBarChart3D(""," 水果种类-/Alpha/ ", " 销量 ", dataset,PlotOrientation.VERTICAL, true, false, false);chart.setBackgroundPaint(Color.WHITE);CategoryPlot plot = chart.getCategoryPlot();//设置字体,不然会中文乱码的Font font = new Font("宋体", Font.BOLD, 16);TextTitle title = new TextTitle("水果销量图统计-By Alpha", font);chart.setTitle(title); //标题//副标题//TextTitle subtitle = new TextTitle("副标题", new Font("黑体", Font.BOLD,12));//chart.addSubtitle(subtitle);NumberAxis numberaxis = (NumberAxis) plot.getRangeAxis();CategoryAxis domainAxis = plot.getDomainAxis();//设置X轴坐标上的文字domainAxis.setTickLabelFont(new Font("sans-serif",Font.PLAIN, 11));//设置X轴的标题文字domainAxis.setLabelFont(new Font("宋体", Font.PLAIN, 12));//设置Y轴坐标上的文字numberaxis.setTickLabelFont(new Font("sans-serif",Font.PLAIN, 12));//设置Y轴的标题文字numberaxis.setLabelFont(new Font("黑体", Font.PLAIN, 12));//底部汉字乱码的问题chart.getLegend().setItemFont(new Font("宋体", Font.PLAIN, 12));plot.setDomainAxis(domainAxis);BarRenderer3D renderer = new BarRenderer3D();renderer.setBaseOutlinePaint(Color.BLACK);// 设置每个地区所包含的平行柱的之间距离renderer.setItemMargin(0.1);// 显示每个柱的数值,并修改该数值的字体属性renderer.setItemLabelGenerator(new StandardCategoryItemLabelGenerator());renderer.setItemLabelsVisible(true);plot.setRenderer(renderer);// 设置柱的透明度plot.setForegroundAlpha(0.8f);ChartUtilities.writeChartAsJPEG(response.getOutputStream(), chart,640, 400);%></body></html>注:示例3中红色字体为解决中文乱码问题,具体见注释。
java利⽤JFreeChart实现各种数据统计图(柱形图,饼图,折线图)最近在做数据挖掘的课程设计,需要将数据分析的结果很直观的展现给⽤户,这就要⽤到数据统计图,要实现这个功能就需要⼏个第三⽅包了:1. jfreechart-1.0.13.jar2. jcommon-1.0.16.jar3. gnujaxp.jar先来看⼀下,最终效果图:主要是jfreechart-1.0.13.jar,但这三个包要齐全,我已经将所有与jfreechart有关的jar包与本⽂实例的⼯程(代码)⼀同压缩上传了,有兴趣的同学可以下载,接下来,我们⼀步步来实现本程序。
1,建,⽴java项⽬,在这个项⽬在建⽴⼀个新的⽂件夹lib;2,将上述三个jar包,复制到lib3,然后右键点击这个java项⽬,选择Properties4,在左侧列表⾥选中Java Build Path,右侧选中Libraries5,点击Add JARs6,然后去选择这个项⽬中lib⽂件夹中的三个jar,点击确定成功后,项⽬中会多⼀个⽂件夹为:Referenced Libraries⼆,实现柱形图的java代码:import java.awt.Font;import org.jfree.chart.ChartFactory;import org.jfree.chart.ChartPanel;import org.jfree.chart.JFreeChart;import org.jfree.chart.axis.CategoryAxis;import org.jfree.chart.axis.ValueAxis;import org.jfree.chart.plot.CategoryPlot;import org.jfree.chart.plot.PlotOrientation;import org.jfree.data.category.CategoryDataset;import org.jfree.data.category.DefaultCategoryDataset;public class BarChart {ChartPanel frame1;public BarChart(){CategoryDataset dataset = getDataSet();JFreeChart chart = ChartFactory.createBarChart3D("⽔果", // 图表标题"⽔果种类", // ⽬录轴的显⽰标签"数量", // 数值轴的显⽰标签dataset, // 数据集PlotOrientation.VERTICAL, // 图表⽅向:⽔平、垂直true, // 是否显⽰图例(对于简单的柱状图必须是false)false, // 是否⽣成⼯具false // 是否⽣成URL链接);//从这⾥开始CategoryPlot plot=chart.getCategoryPlot();//获取图表区域对象CategoryAxis domainAxis=plot.getDomainAxis(); //⽔平底部列表domainAxis.setLabelFont(new Font("⿊体",Font.BOLD,14)); //⽔平底部标题domainAxis.setTickLabelFont(new Font("宋体",Font.BOLD,12)); //垂直标题ValueAxis rangeAxis=plot.getRangeAxis();//获取柱状rangeAxis.setLabelFont(new Font("⿊体",Font.BOLD,15));chart.getLegend().setItemFont(new Font("⿊体", Font.BOLD, 15));chart.getTitle().setFont(new Font("宋体",Font.BOLD,20));//设置标题字体//到这⾥结束,虽然代码有点多,但只为⼀个⽬的,解决汉字乱码问题frame1=new ChartPanel(chart,true); //这⾥也可以⽤chartFrame,可以直接⽣成⼀个独⽴的Frame}private static CategoryDataset getDataSet() {DefaultCategoryDataset dataset = new DefaultCategoryDataset();dataset.addValue(100, "北京", "苹果");dataset.addValue(100, "上海", "苹果");dataset.addValue(100, "⼴州", "苹果");dataset.addValue(200, "北京", "梨⼦");dataset.addValue(200, "上海", "梨⼦");dataset.addValue(200, "⼴州", "梨⼦");dataset.addValue(300, "北京", "葡萄");dataset.addValue(300, "上海", "葡萄");dataset.addValue(300, "⼴州", "葡萄");dataset.addValue(400, "北京", "⾹蕉");dataset.addValue(400, "上海", "⾹蕉");dataset.addValue(400, "⼴州", "⾹蕉");dataset.addValue(500, "北京", "荔枝");dataset.addValue(500, "上海", "荔枝");dataset.addValue(500, "⼴州", "荔枝");return dataset;}public ChartPanel getChartPanel(){return frame1;}}效果图如下:但我们把private static CategoryDataset getDataSet(){}⽅法中的数据变化⼀下后,⼜会形成另⼀种效果,⽐如说我们改成:private static CategoryDataset getDataSet() {DefaultCategoryDataset dataset = new DefaultCategoryDataset();dataset.addValue(100, "苹果", "苹果");dataset.addValue(200, "梨⼦", "梨⼦");dataset.addValue(300, "葡萄", "葡萄");dataset.addValue(400, "⾹蕉", "⾹蕉");dataset.addValue(500, "荔枝", "荔枝");return dataset;}效果图如下:三,实现饼状图的java代码:package com.njue.testJFreeChart;import java.awt.Font;import java.text.DecimalFormat;import java.text.NumberFormat;import javax.swing.JPanel;import org.jfree.chart.ChartFactory;import org.jfree.chart.ChartPanel;import org.jfree.chart.JFreeChart;import bels.StandardPieSectionLabelGenerator;import org.jfree.chart.plot.PiePlot;import org.jfree.data.general.DefaultPieDataset;public class PieChart {ChartPanel frame1;public PieChart(){DefaultPieDataset data = getDataSet();JFreeChart chart = ChartFactory.createPieChart3D("⽔果产量",data,true,false,false);//设置百分⽐PiePlot pieplot = (PiePlot) chart.getPlot();DecimalFormat df = new DecimalFormat("0.00%");//获得⼀个DecimalFormat对象,主要是设置⼩数问题NumberFormat nf = NumberFormat.getNumberInstance();//获得⼀个NumberFormat对象StandardPieSectionLabelGenerator sp1 = new StandardPieSectionLabelGenerator("{0} {2}", nf, df);//获得StandardPieSectionLabelGenerator对象 pieplot.setLabelGenerator(sp1);//设置饼图显⽰百分⽐//没有数据的时候显⽰的内容pieplot.setNoDataMessage("⽆数据显⽰");pieplot.setCircular(false);pieplot.setLabelGap(0.02D);pieplot.setIgnoreNullValues(true);//设置不显⽰空值pieplot.setIgnoreZeroValues(true);//设置不显⽰负值frame1=new ChartPanel (chart,true);chart.getTitle().setFont(new Font("宋体",Font.BOLD,20));//设置标题字体PiePlot piePlot= (PiePlot) chart.getPlot();//获取图表区域对象piePlot.setLabelFont(new Font("宋体",Font.BOLD,10));//解决乱码chart.getLegend().setItemFont(new Font("⿊体",Font.BOLD,10));}private static DefaultPieDataset getDataSet() {DefaultPieDataset dataset = new DefaultPieDataset();dataset.setValue("苹果",100);dataset.setValue("梨⼦",200);dataset.setValue("葡萄",300);dataset.setValue("⾹蕉",400);dataset.setValue("荔枝",500);return dataset;}public ChartPanel getChartPanel(){return frame1;}}效果图如下:四,实现折线图的java代码:package com.njue.testJFreeChart;import java.awt.Font;import java.text.SimpleDateFormat;import org.jfree.chart.ChartFactory;import org.jfree.chart.ChartPanel;import org.jfree.chart.JFreeChart;import org.jfree.chart.axis.DateAxis;import org.jfree.chart.axis.ValueAxis;import org.jfree.chart.plot.XYPlot;import org.jfree.data.time.Month;import org.jfree.data.time.TimeSeries;import org.jfree.data.time.TimeSeriesCollection;import org.jfree.data.xy.XYDataset;public class TimeSeriesChart {ChartPanel frame1;public TimeSeriesChart(){XYDataset xydataset = createDataset();JFreeChart jfreechart = ChartFactory.createTimeSeriesChart("Legal & General单位信托基⾦价格", "⽇期", "价格",xydataset, true, true, true);XYPlot xyplot = (XYPlot) jfreechart.getPlot();DateAxis dateaxis = (DateAxis) xyplot.getDomainAxis();dateaxis.setDateFormatOverride(new SimpleDateFormat("MMM-yyyy"));frame1=new ChartPanel(jfreechart,true);dateaxis.setLabelFont(new Font("⿊体",Font.BOLD,14)); //⽔平底部标题dateaxis.setTickLabelFont(new Font("宋体",Font.BOLD,12)); //垂直标题ValueAxis rangeAxis=xyplot.getRangeAxis();//获取柱状rangeAxis.setLabelFont(new Font("⿊体",Font.BOLD,15));jfreechart.getLegend().setItemFont(new Font("⿊体", Font.BOLD, 15));jfreechart.getTitle().setFont(new Font("宋体",Font.BOLD,20));//设置标题字体}private static XYDataset createDataset() { //这个数据集有点多,但都不难理解 TimeSeries timeseries = new TimeSeries("legal & general欧洲指数信任", org.jfree.data.time.Month.class);timeseries.add(new Month(2, 2001), 181.80000000000001D);timeseries.add(new Month(3, 2001), 167.30000000000001D);timeseries.add(new Month(4, 2001), 153.80000000000001D);timeseries.add(new Month(5, 2001), 167.59999999999999D);timeseries.add(new Month(6, 2001), 158.80000000000001D);timeseries.add(new Month(7, 2001), 148.30000000000001D);timeseries.add(new Month(8, 2001), 153.90000000000001D);timeseries.add(new Month(9, 2001), 142.69999999999999D);timeseries.add(new Month(10, 2001), 123.2D);timeseries.add(new Month(11, 2001), 131.80000000000001D);timeseries.add(new Month(12, 2001), 139.59999999999999D);timeseries.add(new Month(1, 2002), 142.90000000000001D);timeseries.add(new Month(2, 2002), 138.69999999999999D);timeseries.add(new Month(3, 2002), 137.30000000000001D);timeseries.add(new Month(4, 2002), 143.90000000000001D);timeseries.add(new Month(5, 2002), 139.80000000000001D);timeseries.add(new Month(6, 2002), 137D);timeseries.add(new Month(7, 2002), 132.80000000000001D);TimeSeries timeseries1 = new TimeSeries("legal & general英国指数信任", org.jfree.data.time.Month.class);timeseries1.add(new Month(2, 2001), 129.59999999999999D);timeseries1.add(new Month(3, 2001), 123.2D);timeseries1.add(new Month(4, 2001), 117.2D);timeseries1.add(new Month(5, 2001), 124.09999999999999D);timeseries1.add(new Month(6, 2001), 122.59999999999999D);timeseries1.add(new Month(7, 2001), 119.2D);timeseries1.add(new Month(8, 2001), 116.5D);timeseries1.add(new Month(9, 2001), 112.7D);timeseries1.add(new Month(10, 2001), 101.5D);timeseries1.add(new Month(11, 2001), 106.09999999999999D);timeseries1.add(new Month(12, 2001), 110.3D);timeseries1.add(new Month(1, 2002), 111.7D);timeseries1.add(new Month(2, 2002), 111D);timeseries1.add(new Month(3, 2002), 109.59999999999999D);timeseries1.add(new Month(4, 2002), 113.2D);timeseries1.add(new Month(5, 2002), 111.59999999999999D);timeseries1.add(new Month(6, 2002), 108.8D);timeseries1.add(new Month(7, 2002), 101.59999999999999D);TimeSeriesCollection timeseriescollection = new TimeSeriesCollection(); timeseriescollection.addSeries(timeseries);timeseriescollection.addSeries(timeseries1);return timeseriescollection;}public ChartPanel getChartPanel(){return frame1;}}效果图如下:再来看⼀下主⽅法:import java.awt.GridLayout;import javax.swing.JFrame;public class mainClass {public static void main(String args[]){JFrame frame=new JFrame("Java数据统计图");frame.setLayout(new GridLayout(2,2,10,10));frame.add(new BarChart().getChartPanel()); //添加柱形图frame.add(new BarChart1().getChartPanel()); //添加柱形图的另⼀种效果 frame.add(new PieChart().getChartPanel()); //添加饼状图frame.add(new TimeSeriesChart().getChartPanel()); //添加折线图frame.setBounds(50, 50, 800, 600);frame.setVisible(true);}}五,总结以上都是⼀个简单的例⼦去实现了,想了解更深的同学可⾃⾏查询资料,其实以上代码都通俗易懂,只要结合⾃⼰的实际情况,便可开发出属于⾃⼰的Application,⼤家可以看出我这⾥是在Application上实现的,其实更多情况数据统计图在javaweb上应⽤更多,⼤家也可⾃⾏了解。
利用JFreeChart生成饼状图
在利用JFreeChart生成了的动态图表中,除了生成柱状图的图片格式外,还可以生成饼状图的图片格式。
本扩展练习的目的是:在提供了一组数据情况下,利用JFreeChart生成饼状图。
(1)新建一个命名为jPie3D.jsp文件。
【新建】|【JSP (advanced Templates)】命令,弹出【新建JSP页面】对话框,在对话框的文件名称中输入jPie3D.jsp,单击【完成】按钮。
(3)在jPie3D.Jsp文件中输入以下内容并保存。
图表的类别和图表的标题。
然后分别构造了一个PieDataset和JFreeChart对象用于得到各个类别的数值和设置图表的标题、显示的数据集等信息,最后设置图表的格式、文件名和图表浏览路径。
执行上述代码,结果如图8-7所示。
图8-7 实心3D饼状图。
最近公司使用jfreechart来生成统计图,使用了折线图,饼图等,因为用的1.0.8a版的jfreechart,与1.0.0版本的地方有很多不同,而且图片生成清晰度比老版的高,如下是我做的demo.1.所需包(1) jfreechart-1.0.8a.jar(2) jcommon-1.0.12.jar2.运行环境JDK 1.53.源代码import java.awt.Color;import java.awt.Font;import java.io.File;import java.io.FileOutputStream;import java.text.DecimalFormat;import java.text.NumberFormat;import org.jfree.chart.ChartFactory;import org.jfree.chart.ChartUtilities;import org.jfree.chart.JFreeChart;import org.jfree.chart.axis.CategoryAxis;import org.jfree.chart.axis.CategoryLabelPositions;import org.jfree.chart.axis.NumberAxis;import org.jfree.chart.axis.V alueAxis;import bels.StandardCategoryItemLabelGenerator;import bels.StandardPieSectionLabelGenerator;import org.jfree.chart.plot.CategoryPlot;import org.jfree.chart.plot.PiePlot3D;import org.jfree.chart.plot.PlotOrientation;import org.jfree.chart.renderer.category.BarRenderer;import org.jfree.chart.renderer.category.LineAndShapeRenderer;import org.jfree.chart.renderer.category.StackedBarRenderer;import org.jfree.chart.title.TextTitle;import org.jfree.data.category.CategoryDataset;import org.jfree.data.general.DatasetUtilities;import org.jfree.data.general.DefaultPieDataset;import org.jfree.data.general.PieDataset;/*** 实际取色的时候一定要16位的,这样比较准确** @author new*/public class CreateChartServiceImpl{private static final String CHART_PA TH = "E:/test/";public static void main(String[] args){// TODO Auto-generated method stubCreateChartServiceImpl pm = new CreateChartServiceImpl();// 生成饼状图pm.makePieChart();// 生成单组柱状图pm.makeBarChart();// 生成多组柱状图pm.makeBarGroupChart();// 生成堆积柱状图pm.makeStackedBarChart();// 生成折线图pm.makeLineAndShapeChart();}/*** 生成折线图*/public void makeLineAndShapeChart(){double[][] data = new double[][]{{ 672, 766, 223, 540, 126 },{ 325, 521, 210, 340, 106 },{ 332, 256, 523, 240, 526 } };String[] rowKeys ={ "苹果", "梨子", "葡萄" };String[] columnKeys ={ "北京", "上海", "广州", "成都", "深圳" };CategoryDataset dataset = getBarData(data, rowKeys, columnKeys); createTimeXYChar("折线图", "x轴", "y轴", dataset, "lineAndShap.png"); }/*** 生成分组的柱状图*/public void makeBarGroupChart(){double[][] data = new double[][]{ 672, 766, 223, 540, 126 },{ 325, 521, 210, 340, 106 },{ 332, 256, 523, 240, 526 } };String[] rowKeys ={ "苹果", "梨子", "葡萄" };String[] columnKeys ={ "北京", "上海", "广州", "成都", "深圳" };CategoryDataset dataset = getBarData(data, rowKeys, columnKeys); createBarChart(dataset, "x坐标", "y坐标", "柱状图", "barGroup.png");}/*** 生成柱状图*/public void makeBarChart(){double[][] data = new double[][]{{ 672, 766, 223, 540, 126 } };String[] rowKeys ={ "苹果" };String[] columnKeys ={ "北京", "上海", "广州", "成都", "深圳" };CategoryDataset dataset = getBarData(data, rowKeys, columnKeys); createBarChart(dataset, "x坐标", "y坐标", "柱状图", "bar.png");}/*** 生成堆栈柱状图*/public void makeStackedBarChart(){double[][] data = new double[][]{{ 0.21, 0.66, 0.23, 0.40, 0.26 },{ 0.25, 0.21, 0.10, 0.40, 0.16 } };String[] rowKeys ={ "苹果", "梨子" };String[] columnKeys ={ "北京", "上海", "广州", "成都", "深圳" };CategoryDataset dataset = getBarData(data, rowKeys, columnKeys); createStackedBarChart(dataset, "x坐标", "y坐标", "柱状图", "stsckedBar.png"); }/*** 生成饼状图*/public void makePieChart(){double[] data ={ 9, 91 };String[] keys ={ "失败率", "成功率" };createValidityComparePimChar(getDataPieSetByUtil(data, keys), "饼状图", "pie2.png", keys);}// 柱状图,折线图数据集public CategoryDataset getBarData(double[][] data, String[] rowKeys, String[] columnKeys){return DatasetUtilities.createCategoryDataset(rowKeys, columnKeys, data);}// 饼状图数据集public PieDataset getDataPieSetByUtil(double[] data,String[] datadescription){if (data != null && datadescription != null){if (data.length == datadescription.length){DefaultPieDataset dataset = new DefaultPieDataset();for (int i = 0; i < data.length; i++){dataset.setValue(datadescription[i], data[i]);}return dataset;}}return null;/*** 柱状图**@param dataset 数据集* @param xName x轴的说明(如种类,时间等)* @param yName y轴的说明(如速度,时间等)* @param chartTitle 图标题* @param charName 生成图片的名字* @return*/public String createBarChart(CategoryDataset dataset, String xName,String yName, String chartTitle, String charName){JFreeChart chart = ChartFactory.createBarChart(chartTitle, // 图表标题xName, // 目录轴的显示标签yName, // 数值轴的显示标签dataset, // 数据集PlotOrientation.VERTICAL, // 图表方向:水平、垂直true, // 是否显示图例(对于简单的柱状图必须是false)false, // 是否生成工具false // 是否生成URL链接);Font labelFont = new Font("SansSerif", Font.TRUETYPE_FONT, 12);/** V ALUE_TEXT_ANTIALIAS_OFF表示将文字的抗锯齿关闭,* 使用的关闭抗锯齿后,字体尽量选择12到14号的宋体字,这样文字最清晰好看*///chart.getRenderingHints().put(RenderingHints.KEY_TEXT_ANTIALIASING,RenderingHints.V ALUE_TEXT_ANTIALIAS_OFF);chart.setTextAntiAlias(false);chart.setBackgroundPaint(Color.white);// create plotCategoryPlot plot = chart.getCategoryPlot();// 设置横虚线可见plot.setRangeGridlinesVisible(true);// 虚线色彩plot.setRangeGridlinePaint(Color.gray);// 数据轴精度NumberAxis vn = (NumberAxis) plot.getRangeAxis();// vn.setAutoRangeIncludesZero(true);DecimalFormat df = new DecimalFormat("#0.00");vn.setNumberFormatOverride(df); // 数据轴数据标签的显示格式// x轴设置CategoryAxis domainAxis = plot.getDomainAxis();domainAxis.setLabelFont(labelFont);// 轴标题domainAxis.setTickLabelFont(labelFont);// 轴数值// Lable(Math.PI/3.0)度倾斜// domainAxis.setCategoryLabelPositions(CategoryLabelPositions// .createUpRotationLabelPositions(Math.PI / 3.0));domainAxis.setMaximumCategoryLabelWidthRatio(0.6f);// 横轴上的Lable 是否完整显示// 设置距离图片左端距离domainAxis.setLowerMargin(0.1);// 设置距离图片右端距离domainAxis.setUpperMargin(0.1);// 设置columnKey 是否间隔显示// domainAxis.setSkipCategoryLabelsToFit(true);plot.setDomainAxis(domainAxis);// 设置柱图背景色(注意,系统取色的时候要使用16位的模式来查看颜色编码,这样比较准确)plot.setBackgroundPaint(new Color(255, 255, 204));// y轴设置ValueAxis rangeAxis = plot.getRangeAxis();rangeAxis.setLabelFont(labelFont);rangeAxis.setTickLabelFont(labelFont);// 设置最高的一个Item 与图片顶端的距离rangeAxis.setUpperMargin(0.15);// 设置最低的一个Item 与图片底端的距离rangeAxis.setLowerMargin(0.15);plot.setRangeAxis(rangeAxis);BarRenderer renderer = new BarRenderer();// 设置柱子宽度renderer.setMaximumBarWidth(0.05);// 设置柱子高度renderer.setMinimumBarLength(0.2);// 设置柱子边框颜色renderer.setBaseOutlinePaint(Color.BLACK);// 设置柱子边框可见renderer.setDrawBarOutline(true);// // 设置柱的颜色renderer.setSeriesPaint(0, new Color(204, 255, 255));renderer.setSeriesPaint(1, new Color(153, 204, 255));renderer.setSeriesPaint(2, new Color(51, 204, 204));// 设置每个地区所包含的平行柱的之间距离renderer.setItemMargin(0.0);// 显示每个柱的数值,并修改该数值的字体属性renderer.setIncludeBaseInRange(true);renderer.setBaseItemLabelGenerator(new StandardCategoryItemLabelGenerator()); renderer.setBaseItemLabelsVisible(true);plot.setRenderer(renderer);// 设置柱的透明度plot.setForegroundAlpha(1.0f);FileOutputStream fos_jpg = null;try{isChartPathExist(CHART_PATH);String chartName = CHART_PA TH + charName;fos_jpg = new FileOutputStream(chartName);ChartUtilities.writeChartAsPNG(fos_jpg, chart, 500, 500, true, 10);return chartName;}catch (Exception e){e.printStackTrace();return null;}finally{try{fos_jpg.close();}catch (Exception e){e.printStackTrace();}}/*** 横向图** @param dataset 数据集* @param xName x轴的说明(如种类,时间等)* @param yName y轴的说明(如速度,时间等)* @param chartTitle 图标题* @param charName 生成图片的名字* @return*/public String createHorizontalBarChart(CategoryDataset dataset,String xName, String yName, String chartTitle, String charName){JFreeChart chart = ChartFactory.createBarChart(chartTitle, // 图表标题xName, // 目录轴的显示标签yName, // 数值轴的显示标签dataset, // 数据集PlotOrientation.VERTICAL, // 图表方向:水平、垂直true, // 是否显示图例(对于简单的柱状图必须是false)false, // 是否生成工具false // 是否生成URL链接);CategoryPlot plot = chart.getCategoryPlot();// 数据轴精度NumberAxis vn = (NumberAxis) plot.getRangeAxis();//设置刻度必须从0开始// vn.setAutoRangeIncludesZero(true);DecimalFormat df = new DecimalFormat("#0.00");vn.setNumberFormatOverride(df); // 数据轴数据标签的显示格式CategoryAxis domainAxis = plot.getDomainAxis();domainAxis.setCategoryLabelPositions(CategoryLabelPositions.UP_45); // 横轴上的// LableFont labelFont = new Font("SansSerif", Font.TRUETYPE_FONT, 12);domainAxis.setLabelFont(labelFont);// 轴标题domainAxis.setTickLabelFont(labelFont);// 轴数值domainAxis.setMaximumCategoryLabelWidthRatio(0.8f);// 横轴上的Lable 是否完整显示// domainAxis.setVerticalCategoryLabels(false);plot.setDomainAxis(domainAxis);ValueAxis rangeAxis = plot.getRangeAxis();// 设置最高的一个Item 与图片顶端的距离rangeAxis.setUpperMargin(0.15);// 设置最低的一个Item 与图片底端的距离rangeAxis.setLowerMargin(0.15);plot.setRangeAxis(rangeAxis);BarRenderer renderer = new BarRenderer();// 设置柱子宽度renderer.setMaximumBarWidth(0.03);// 设置柱子高度renderer.setMinimumBarLength(30);renderer.setBaseOutlinePaint(Color.BLACK);// 设置柱的颜色renderer.setSeriesPaint(0, Color.GREEN);renderer.setSeriesPaint(1, new Color(0, 0, 255));// 设置每个地区所包含的平行柱的之间距离renderer.setItemMargin(0.5);// 显示每个柱的数值,并修改该数值的字体属性renderer.setBaseItemLabelGenerator(new StandardCategoryItemLabelGenerator()); // 设置柱的数值可见renderer.setBaseItemLabelsVisible(true);plot.setRenderer(renderer);// 设置柱的透明度plot.setForegroundAlpha(0.6f);FileOutputStream fos_jpg = null;try{isChartPathExist(CHART_PATH);String chartName = CHART_PA TH + charName;fos_jpg = new FileOutputStream(chartName);ChartUtilities.writeChartAsPNG(fos_jpg, chart, 500, 500, true, 10);return chartName;}catch (Exception e){e.printStackTrace();return null;}finally{try{fos_jpg.close();}catch (Exception e){e.printStackTrace();}}}/*** 饼状图** @param dataset 数据集* @param chartTitle 图标题* @param charName 生成图的名字* @param pieKeys 分饼的名字集* @return*/public String createValidityComparePimChar(PieDataset dataset,String chartTitle, String charName, String[] pieKeys){JFreeChart chart = ChartFactory.createPieChart3D(chartTitle, // chart// titledataset,// datatrue,// include legendtrue, false);// 使下说明标签字体清晰,去锯齿类似于//chart.getRenderingHints().put(RenderingHints.KEY_TEXT_ANTIALIASING,RenderingHints.V ALUE_TEXT_ANTIALIAS_OFF);的效果chart.setTextAntiAlias(false);// 图片背景色chart.setBackgroundPaint(Color.white);// 设置图标题的字体重新设置titleFont font = new Font("隶书", Font.BOLD, 25);TextTitle title = new TextTitle(chartTitle);title.setFont(font);chart.setTitle(title);PiePlot3D plot = (PiePlot3D) chart.getPlot();// 图片中显示百分比:默认方式// 指定饼图轮廓线的颜色// plot.setBaseSectionOutlinePaint(Color.BLACK);// plot.setBaseSectionPaint(Color.BLACK);// 设置无数据时的信息plot.setNoDataMessage("无对应的数据,请重新查询。