曼昆经济学原理试题Chapter 02a
- 格式:doc
- 大小:107.50 KB
- 文档页数:4
曼昆《经济学原理(微观经济学分册)》第6版课后习题详解第一篇导言第1章经济学十大原理一、概念题1.稀缺性稀缺性是指在给定的时间内,相对于人的需求而言,经济资源的供给总是不足的,也就是资源的有限性与人类的欲望无限性之间的矛盾。
2.经济学经济学是研究如何将稀缺的资源有效地配置给相互竞争的用途,以使人类的欲望得到最大限度满足的科学。
其中微观经济学是以单个经济主体为研究对象,研究单个经济主体面对既定资源约束时如何进行选择的科学;宏观经济学则以整个国民经济为研究对象,主要着眼于经济总量的研究。
3.效率效率是指人们在实践活动中的产出与投入比值或者是效益与成本比值,比值大效率高,比值小效率低。
它与产出或收益大小成正比,与投入或成本成反比。
4.平等平等是指人与人的利益关系及利益关系的原则、制度、做法、行为等都合乎社会发展的需要,即经济成果在社会成员中公平分配的特性。
它是一个历史范畴,按其所产生的社会历史条件和社会性质的不同而不同,不存在永恒的公平;它也是一个客观范畴,尽管在不同的社会形态中内涵不同对其的理解不同,但都是社会存在的反映,具有客观性。
5.机会成本机会成本是指将一种资源用于某种用途,而未用于其他用途所放弃的最大预期收益。
其存在的前提条件是:①资源是稀缺的;②资源具有多种用途;③资源的投向不受限制。
6.理性人理性人是指系统而有目的地尽最大努力去实现其目标的人,是经济研究中所假设的、在一定条件下具有典型理性行为的经济活动主体。
7.边际变动边际变动是指对行动计划的微小增量调整。
8.激励激励是指引起一个人做出某种行为的某种东西。
9.市场经济市场经济是指由家庭和企业在市场上的相互交易决定资源配置的经济,而资源配置实际上就是决定社会生产什么、生产多少、如何生产以及为谁生产的过程。
10.产权产权是指个人拥有并控制稀缺资源的能力,也可以理解为人们对其所交易东西的所有权,即人们在交易活动中使自己或他人在经济利益上受益或受损的权力。
第二章像经济学家一样思考复习题1.经济学如何像一门科学?答:经济学家努力以科学家的客观态度来探讨经济问题。
用科学的方法提出理论、收集资料,并分析这些资料以努力证明或否定他们提出的理论来研究社会。
经济学家研究经济的过程和方法与自然科学的科学家研究自然是一样的。
所以说经济学也是一门科学。
2.为什么经济学家要做出假设?答:假设可以使解释这个世界更为容易。
对不同的问题作出不同的假设,略去对问题的答案没有实质影响的因素,突出实质性的内容,使我们可以集中进行思考。
3.经济模型应该准确地描述现实吗?答:经济模型不需要准确地描述现实。
所有的模型都是建立在假设的基础上的,它们忽略掉了大量不会对研究结果有实质性影响的细节,向我们说明什么是真正重要的。
模型是为了增进我们对现实的理解而简化了现实。
4.说出你的家庭参与要素市场的一种方式,以及参与产品市场的一种方式。
答:略。
5.举出一种没有包括在简单的循环流量图中的经济关系。
答:略。
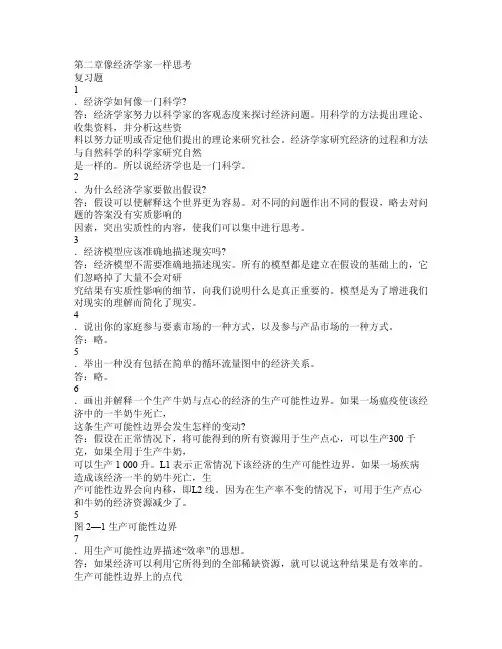
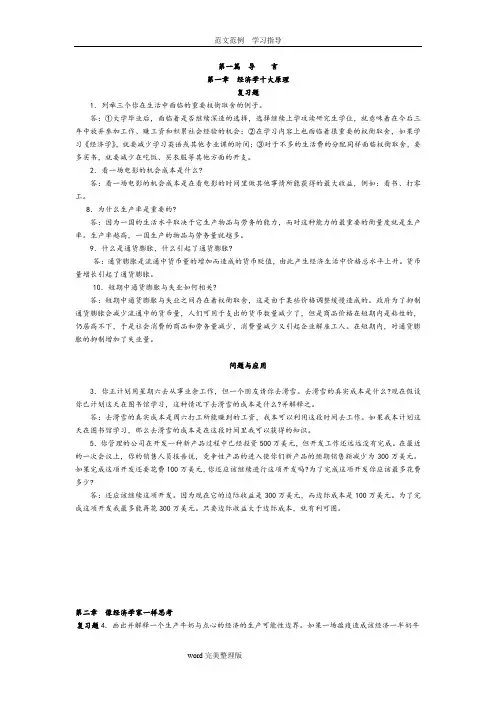
6.画出并解释一个生产牛奶与点心的经济的生产可能性边界。
如果一场瘟疫使该经济中的一半奶牛死亡,这条生产可能性边界会发生怎样的变动?答:假设在正常情况下,将可能得到的所有资源用于生产点心,可以生产300 千克,如果全用于生产牛奶,可以生产1 000 升。
L1 表示正常情况下该经济的生产可能性边界。
如果一场疾病造成该经济一半的奶牛死亡,生产可能性边界会向内移,即L2 线。
因为在生产率不变的情况下,可用于生产点心和牛奶的经济资源减少了。
5图2—1 生产可能性边界7.用生产可能性边界描述“效率”的思想。
答:如果经济可以利用它所得到的全部稀缺资源,就可以说这种结果是有效率的。
1Q4Why should policy makers think about incentives?Policymakers need to think about incentives so they can understand how people will respond to the policies they put in place. The text's example of seat belts shows that policy actions can have quite unintended consequences. If incentives matter a lot, they may lead to a very different type of policy; for example, some economists have suggested putting knives in steering columns so that people will drive much more carefully! While this suggestion is silly, it highlights the importance of incentives.Q6what does the invisible hand of the marketplace do?The "invisible hand" of the marketplace represents the idea that even though individuals and firms are all acting in their own self-interest, prices and the marketplace guide them to do what is good for society as a whole.2Q1How is economics like a science?Economics is like a science because economists use the scientific method. They devise theories, collect data, and then analyze these data in an attempt to verify or refute their theories about how the world works. Economists use theory and observation like other scientists, but they are limited in their ability to runcontrolled experiments. Instead, they must rely on natural experiments.Q5 Use a production possibilities frontier to describe the idea of “efficiency”? The idea of efficiency is that an outcome is efficient if the economy is getting all it can from the scarce resources it has available. In terms of the production possibilities frontier, an efficient point is a point on the frontier, such as point A in Figure 4. A point inside the frontier, such as point B, is inefficient since more of one good could be produced without reducing the production of another good. Q7What is the difference between a positive and a normative statement? Give an example of that.Positive statements are descriptive and make a claim about how the world is, while normative statements are prescriptive and make a claim about how the world ought to be. Here is an example. Positive: A rapid growth rate of money is the cause of inflation. Normative: The government should keep the growth rate of money low. 3Q1 Explain how absolute advantage and comparative advantage differ.Absolute advantage reflects a comparison of the productivity of one person, firm, or nation to that of another, while comparative advantage is based on the relative opportunity costs of the persons, firms, or nations. While a person, firm, or nation may have an absolute advantage in producing every good, they can't have a comparative advantage in every good.Q4Will a nation tend to export or import goods to Question2.A nation will export goods for which it has a comparative advantage because it has a smaller opportunity cost of producing those goods. As a result, citizens of all nations are able to consume quantities of goods that are outside their production possibilities frontiers.4Q5Propeye’s income declines, and as a result, he buys more spinach. Is spinach an inferior or a normal goods? What happens to Popeye’s demand curve for spinach? Since Popeye buys more spinach when his income falls, spinach is an inferior good for him. Since he buys more spinach, but the price of spinach is unchanged, his demand curve for spinach shifts out as a result of the decrease in his income. Q8 Dose a change in producers’ technology lead to a movement along the supply curve? Does a change in price lead to a movement along the supply curve or a shift in the supply curve?A change in producers' technology leads to a shift in the supply curve. A change in price leads to a movement along the supply curve.Q9 Define the equilibrium of a market. Describe the forces that move a market towards its equilibrium.The equilibrium of a market is the point at which the quantity demanded is equalto quantity supplied. If the price is above the equilibrium price, sellers want to sell more than buyers want to buy, so there is a surplus. Sellers try to increase their sales by cutting prices. That continues until they reach the equilibrium price. If the price is below the equilibrium price, buyers want to buy more than sellers want to sell, so there is a shortage. Sellers can raise their price without losing customers. That continues until they reach the equilibrium price.Q11 Describe the role of prices in market economies.Prices play a vital role in market economies because they bring markets into equilibrium. If the price is different from its equilibrium level, quantity supplied and quantity demanded are not equal. The resulting surplus or shortage leads suppliers to adjust the price until equilibrium is restored. Prices thus serve as signals that guide economic decisions and allocate scarce resources.5Q2 List and explain the four determinants of the price elasticity of demand discussed in the chapter.The determinants of the price elasticity of demand include how available close substitutes are, whether the good is a necessity or a luxury, how broadly defined the market is, and the time horizon. Luxury goods have greater price elastic ties than necessities, goods with close substitutes have greater elastic ties, goods in more narrowly defined markets have greater elastic ties, and the elasticity of demand is higher the longer the time horizon.Q4 On a supply-and-demand diagram, show equilibrium price, equilibrium quantity, and the total revenue received by producers.Figure 1 presents a supply-and-demand diagram, showing equilibrium price, equilibrium quantity, and the total revenue received by producers. Total revenue equals the equilibrium price times the equilibrium quantity, which is the area of the rectangle shown in the figure.Figure 16Q2Which causes a shortage of a good—a price ceiling or a price floor? Which causes a surplus?A shortage of a good arises when there is a binding price ceiling. A surplus of a good arises when there is a binding price floor.Q6How does a tax on a good affect the price paid by buyers, and the quantity sold?A tax on a good raises the price buyers pay, lowers the price sellers receive, and reduces the quantity sold.Q7What determines how the burden of a tax is divided between buyers and sellers? Why?The burden of a tax is divided between buyers and sellers depending on the elasticity of demand and supply. Elasticity represents the willingness of buyers or sellers to leave the market, which in turns depends on their alternatives. When a good is taxed, the side of the market with fewer good alternatives cannot easily leave the market and thus bears more of the burden of the tax.7Q1Explain how buyer’s willingness to pay, consumer’surplus, and the demand curve are related.Buyers' willingness to pay, consumer surplus, and the demand curve are all closely related. The height of the demand curve represents the willingness to pay of the buyers. Consumer surplus is the area below the demand curve and above the price, which equals each buyer's willingness to pay less the price of the good.Q2 Explain how seller’s costs, producer’s surplus, and the supply curve are related.Sellers' costs, producer surplus, and the supply curve are all closely related. The height of the supply curve represents the costs of the sellers. Producer surplus is the area below the price and above the supply curve, which equals the price minus each sellers' costs.Figure 413Q2 Give an example of an opportunity cost that accountant might not count as a cost. Why would the accountant ignore the cost?An accountant would not count the owner’s opportunity cost of alternative employment as an accounting cost. An example is given in the text in which Helen runs a cookie business, but she could instead work as a computer programmer. Because she's working in her cookie factory, she gives up the opportunity to earn $100 per hour as a computer programmer. The accountant ignores this opportunity cost because no money flow occurs. But the cost is relevant to Helen's decision to run the cookie factory.Q3What is marginal product, and what does it means if it is diminishing? Marginal product is the increase in output that arises from an additional unit of input. Diminishing marginal product means that the marginal product of an input declines as the quantity of the input increases.Q8Defind economies of scale and explain why they might arise. Define diseconomiesof scale and explain why then might arise.Economies of scale exist when long-run average total cost falls as the quantity of output increases, which occurs because of specialization among workers. Diseconomies of scale exist when long-run average total cost rises as the quantity of output increases, which occurs because of coordination problems inherent in a large organization.14Q2Draw the cost curves for a typical firm. For a given price, explain how the firm chooses the level of output that maximizes profit. Figure 2 shows the cost curves for a typical firm. For a given price (such as P*), the level of output that maximizes profit is the output where marginal cost equals price (Q*), as long as price is greater than average variable cost at that point (in the short run), or greater than average total cost (in the long run).Figure 2Q6 Does a firm’s price equal marginal cost in the short run, in the long run, or both? Explain.The firm's price equals the minimum of average total cost only in the long run.In the short run, price may be greater than average total cost, in which case the firm is making profits, or price may be less than average total cost, in which case the firm is making losses. But the situation is different in the long run. If firms are making profits, other firms will enter the industry, which will lower the price of the good. If firms are making losses, they will exit the industry, which will raise the price of the good. Entry or exit continues until firms are making neither profits nor losses. At that point, price equals average total cost. 15Q3Why is monopolist’s marginal revenue less than the price of its goods? Can marginal revenue be negative? Explain.A monopolist's marginal revenue is less than the price of its product because: (1) its demand curve is the market demand curve, so (2) to increase the amount sold, the monopolist must lower the price of its good for every unit it sells. (3) This cut in prices reduces revenue on the units it was already selling.A monopolist's marginal revenue can be negative because to get purchasers to buy an additional unit of the good, the firm must reduce its price on all units of the good. The fact that it sells a greater quantity increases revenue, but the decline in price decreases revenue. The overall effect depends on the elasticity of the demand curve. If the demand curve is inelastic, marginal revenue will be negative. Q4 Draw the demand, marginal-revenue, and marginal-cost curve for a monopolist. Show the profit-maximizing level of output. Show the profit-maximizing price.Figure 1 shows the demand, marginal-revenue, and marginal-cost curves for a monopolist. The intersection of the marginal-revenue and marginal-cost curves determines the profit-maximizing level of output, Q m. The demand curve then shows the profit-maximizing price, P m.Figure 116Q1If a group of sellers could form a cartel, what quantity and price would they try to set?If a group of sellers could form a cartel, they would try to set quantity and price like a monopolist. They would set quantity at the point where marginal revenue equals marginal cost, and set price at the corresponding point on the demand curve. Q5What is the prisoners’ dilemma and what does it have to do with oligopoly? The prisoners' dilemma is a game between two people or firms that illustrates why it is difficult for opponents to cooperate even when cooperation would make themall better off. Each person or firm has a great incentive to cheat on any cooperative agreement to make himself or itself better off.17Q2 Draw a diagram of the long-run equilibrium in a monopolistically competitive market. How is price related to average total cost? How is price related to marginal cost?In Figure 2, a firm has demand curve D1 and marginal-revenue curve MR1. The firm is making profits because at quantity Q1, price (P1) is above average total cost (ATC). Those profits induce other firms to enter the industry, causing the demand curve to shift to D2 and the marginal-revenue curve to shift to MR2. The result is a decline in quantity to Q2, at which point the price (P2) equals average total cost (ATC), so profits are now zero.Figure 223Q1 Explain why an economy’s income must equal its expenditure.An economy's income must equal its expenditure, since every transaction has a buyerand a seller. Thus, expenditure by buyers must equal income by sellers.24Q2 Describe the three problems that make the consumer price index an imperfect measure of the cost of living.The three problems in the consumer price index as a measure of the cost of living are: (1) substitution bias, which arises because people substitute toward goods that have become relatively less expensive; (2) the introduction of new goods, which are not reflected quickly in the CPI; and (3) unmeasured quality change.25Q2List and describe four determinants of productivity.The four determinants of productivity are: (1) physical capital, which is the stock of equipment and structures that are used to produce goods and services; (2) human capital, which consists of the knowledge and skills that workers acquire through education, training, and experience; (3) natural resources, which are inputs into production that are provided by nature; and (4) technological knowledge, which is society’s understanding of the best ways to produce goods and services. Questions are chosen from problems and applications.Chapter 1: Q9By specializing in each task, you and your roommate can finish the chores morequickly. If you divided each task equally, it would take you more time to cook than it would take your roommate, and it would take him more time to clean than it would take you. By specializing, you reduce the total time spent on chores. Similarly, countries can specialize and trade, making both better off. For example, suppose it takes Spanish workers less time to make clothes than French workers, and French workers can make wine more efficiently than Spanish workers. Then Spain and France can both benefit if Spanish workers produce all the clothes and French workers produce all the wine, and they exchange some wine for some clothes. Chapter 2: Q2a. Figure 6 shows a production possibilities frontier between guns and butter. It is bowed out because when most of the economy’s resources are being used to produce butter, the frontier is steep and when most of the economy’s resources are being used to produce guns, the frontier is very flat. When the economy is producing a lot of guns, workers and machines best suited to making butter are being used to make guns, so each unit of guns given up yields a large increase in the production of butter. Thus, the production possibilities frontier is flat. When the economy is producing a lot of butter, workers and machines best suited to making guns are being used to make butter, so each unit of guns given up yields a small increase in the production of butter. Thus, the production possibilities frontier is steep.b. Point A is impossible for the economy to achieve; it is outside theproduction possibilities frontier. Point B is feasible but inefficient because it’s inside the production possibilities frontier.Figure 6c. The Hawks might choose a point like H, with many guns and not much butter. The Doves might choose a point like D, with a lot of butter and few guns.d. If both Hawks and Doves reduced their desired quantity of guns by the same amount, the Hawks would get a bigger peace dividend because the production possibilities frontier is much steeper at point H than at point D. As a result, the reduction of a given number of guns, starting at point H, leads to a much larger increase in the quantity of butter produced than when starting at point D. Chapter 3: Q4a. Since a Canadian worker can make either two cars a year or 30 bushels of wheat, the opportunity cost of a car is 15 bushels of wheat. Similarly, the opportunity cost of a bushel of wheat is 1/15 of a car. The opportunity costs are the reciprocals of each other.b. See Figure 4. If all 10 million workers produce two cars each, they produce a total of 20 million cars, which is the vertical intercept of the productionpossibilities frontier. If all 10 million workers produce 30 bushels of wheat each, they produce a total of 300 million bushels, which is the horizontal intercept of the production possibilities frontier. Since the tradeoff between cars and wheat is always the same, the production possibilities frontier is a straight line.If Canada chooses to consume 10 million cars, it will need 5 million workers devoted to car production. That leaves 5 million workers to produce wheat, who will produce a total of 150 million bushels (5 million workers times 30 bushels per worker). This is shown as point A on Figure 4.c. If the United States buys 10 million cars from Canada and Canada continues to consume 10 million cars, then Canada will need to produce a total of 20 million cars. So Canada will be producing at the vertical intercept of the production possibilities frontier. But if Canada gets 20 bushels of wheat per car, it will be able to consume 200 million bushels of wheat, along with the 10 million cars. This is shown as point B in the figure. Canada should accept the deal because it gets the same number of cars and 50 million more bushes of wheat.Figure 4Chapter 4: Q1a. Cold weather damages the orange crop, reducing the supply of oranges. Thiscan be seen in Figure 6 as a shift to the left in the supply curve for oranges. The new equilibrium price is higher than the old equilibrium price.b. People often travel to the Caribbean from New England to escape cold weather, so demand for Caribbean hotel rooms is high in the winter. In the summer, fewer people travel to the Caribbean, since northern climes are more pleasant. The result, as shown in Figure 7, is a shift to the left in the demand curve. The equilibrium price of Caribbean hotel rooms is thus lower in the summer than in the winter, as the figure shows.Figure 6a Figure 7bc. When a war breaks out in the Middle East, many markets are affected. Since much oil production takes place there, the war disrupts oil supplies, shifting the supply curve for gasoline to the left, as shown in Figure 8. The result is a rise in the equilibrium price of gasoline. With a higher price for gasoline, the cost of operating a gas-guzzling automobile, like a Cadillac, will increase. As a result, the demand for used Cadillacs will decline, as people in the market for cars will not find Cadillacs as attractive. In addition, some people who already own Cadillacs will try to sell them. The result is that the demand curve for used Cadillacs shifts to the left, while the supply curve shifts to the right, as shownin Figure 9. The result is a decline in the equilibrium price of used Cadillacs.Figure 8c Figure 9cChapter 5: Q2a. For business travelers, the price elasticity of demand when the price of tickets rises from $200 to $250 is [(2,000 - 1,900)/1,950]/[(250 - 200)/225] = 0.05/0.22 = 0.23. For vacationers, the price elasticity of demand when the price of tickets rises from $200 to $250 is [(800 - 600)/700] / [(250 - 200)/225] = 0.29/0.22 = 1.32.b. The price elasticity of demand for vacationers is higher than the elasticity for business travelers because vacationers can choose more easily a different mode of transportation (like driving or taking the train). Business travelers are less likely to do so since time is more important to them and their schedules are less adaptable.Chapter 6: Q2a. The imposition of a binding price floor in the cheese market is shown in Figure3. In the absence of the price floor, the price would be P1and the quantity would be Q1. With the floor set at P f, which is greater than P1, the quantity demandedis Q2, while quantity supplied is Q3, so there is a surplus of cheese in the amount Q– Q2.3b. The farmers’ complaint that their total revenue has declined is correct if demand is elastic. With elastic demand, the percentage decline in quantity would exceed the percentage rise in price, so total revenue would decline.c. If the government purchases all the surplus cheese at the price floor, producers benefit and taxpayers lose. Producers would produce quantity Q3 of cheese, and their total revenue would increase substantially. But consumers would buy only quantity Q2 of cheese, so they are in the same position as before. Taxpayers lose because they would be financing the purchase of the surplus cheese through higher taxes.Figure 3aChapter 7: Q8a. The effect of falling production costs in the market for computers results in a shift to the right in the supply curve, as shown in Figure 14. As a result, the equilibrium price of computers declines and the equilibrium quantity increases. The decline in the price of computers increases consumer surplus from area A toA +B +C + D, an increase in the amount B + C + D.Prior to the shift in supply, producer surplus was areas B + E (the area above the supply curve and below the price). After the shift in supply, producer surplus is areas E + F + G. So producer surplus changes by the amount F + G –B, which may be positive or negative. The increase in quantity increases producer surplus, while the decline in the price reduces producer surplus. Since consumer surplus rises by B + C + D and producer surplus rises by F + G – B, total surplus rises by C + D + F + G.Figure 14A Figure 15bb. Since adding machines are substitutes for computers, the decline in the price of computers means that people substitute computers for adding machines, shifting the demand for adding machines to the left, as shown in Figure 15. The result is a decline in both the equilibrium price and equilibrium quantity of adding machines. Consumer surplus in the adding-machine market changes from area A + B to A + C, a net change of C – B. Producer surplus changes from area C + D + E to area E, a net loss of C + D. Adding machine producers are sad about technological advance in computers because their producer surplus declines.c. Since software and computers are complements, the decline in the price and increase in the quantity of computers means that the demand for software increases, shifting the demand for software to the right, as shown in Figure 16. The result is an increase in both the price and quantity of software. Consumer surplus in the software market changes from B + C to A + B, a net change of A – C. Producer surplus changes from E to C + D + E, an increase of C + D, so software producers should be happy about the technological progress in computers.d. Yes, this analysis helps explain why Bill Gates is one the world’s richest men, since his company produces a lot of software that is a complement with computers and there has been tremendous technological advance in computers.Figure 16Chapter 13: Q4a. The following table shows the marginal product of each hour spent fishing:Hours Fish FixedCost VariableCostTotalCostMarginalProduct0$10$0$10---11010515 102181010208324101525642810203045301025252b. Figure 7 graphs the fisherman's production function. The production function becomes flatter as the number of hours spent fishing increases, illustrating diminishing marginal product.Figure 7b Figure 8c c. The table shows the fixed cost, variable cost, and total cost of fishing.Figure 8 shows the fisherman's total-cost curve. It slopes up because catching additional fish takes additional time. The curve is convex because there are diminishing returns to fishing time?each additional hour spent fishing yields fewer additional fish.Chapter 14: Q9a. Figure 9 illustrates the situation in the U.S. textile industry. With no international trade, the market is in long-run equilibrium. Supply intersects demand at quantity Q1 and price $30, with a typical firm producing output q1.Figure 9b. The effect of imports at $25 is that the market supply curve follows the old supply curve up to a price of $25, then becomes horizontal at that price. As a result, demand exceeds domestic supply, so the country imports textiles from othercountries. The typical domestic firm now reduces its output from q1to q2, incurringlosses, since the large fixed costs imply that average total cost will be much higher than the price.c. In the long run, domestic firms will be unable to compete with foreign firms because their costs are too high. All the domestic firms will exit the industryand other countries will supply enough to satisfy the entire domestic demand.Chapter 15: Q4a. Figure 5 illustrates the market for groceries when there are many competing supermarkets with constant marginal cost. Output is Q C, price is P C, consumer surplus is area A, producer surplus is zero, and total surplus is area A.Figure 5aFigure 6bb. If the supermarkets merge, Figure 6 illustrates the new situation. Quantity declines from Q C to Q M and price rises to P M. Area A in Figure 5 is equal to areaB +C +D +E +F in Figure 6. Consumer surplus is now area B + C, producer surplusis area D + E, and total surplus is area B + C + D + E. Consumers transfer the amount of area D + E to producers and the deadweight loss is area F.Chapter 16: Q2a. OPEC members were trying to reach an agreement to cut production so they could raise the price.b. They were unable to agree on cutting production because each country has an incentive to cheat on any agreement. The turmoil is a decline in the price of oil because of increased production.c. OPEC would like Norway and Britain to join their cartel so they could act like a monopoly.Chapter 23: Q1a. Consumption increases because a refrigerator is a good purchased by a household. Investment increases because a house is an investment good.Consumption increases because a car is a good purchased by a household, but investment decreases because the car in Ford’s inventory had been counted as an investment good until it was sold.Consumption increases because pizza is a good purchased by a household. Government purchases increase because the government spent money to provide a goodto the public.Consumption increases because the bottle is a good purchased by a household, but net exports decrease because the bottle was imported.Investment increases because new structures and equipment were built.Chapter 24: Q4a. Since the increase in cost was considered a quality improvement, there was no increase registered in the CPI.b. The argument in favor of this is that consumers are getting a better good than before, so the price increase equals the improvement in quality. The problem is that the increased cost might exceed the value of the improvement in air quality, so consumers are worse off. In this case, it would be better for the CPI to at least partially reflect the higher cost.Chapter 25: Q4The opportunity cost of investing in capital is the loss of consumption that results from redirecting resources towards investment. Over-investment in capital is possible because of diminishing marginal returns. A country can "over-invest" in capital if people would prefer to have higher consumption spending and less future growth. The opportunity cost of investing in human capital is also the loss of consumption that is needed to provide the resources for investment. A country could "over-invest" in human capital if people were too highly educated for the。
曼昆《经济学原理(微观经济学分册)》第6版课后习题详解(1~2章)第一篇:曼昆《经济学原理(微观经济学分册)》第6版课后习题详解(1~2章)曼昆《经济学原理(微观经济学分册)》第6版课后习题详解第一篇导言第1章经济学十大原理一、概念题 1.稀缺性稀缺性是指在给定的时间内,相对于人的需求而言,经济资源的供给总是不足的,也就是资源的有限性与人类的欲望无限性之间的矛盾。
2.经济学经济学是研究如何将稀缺的资源有效地配置给相互竞争的用途,以使人类的欲望得到最大限度满足的科学。
其中微观经济学是以单个经济主体为研究对象,研究单个经济主体面对既定资源约束时如何进行选择的科学;宏观经济学则以整个国民经济为研究对象,主要着眼于经济总量的研究。
3.效率效率是指人们在实践活动中的产出与投入比值或者是效益与成本比值,比值大效率高,比值小效率低。
它与产出或收益大小成正比,与投入或成本成反比。
4.平等平等是指人与人的利益关系及利益关系的原则、制度、做法、行为等都合乎社会发展的需要,即经济成果在社会成员中公平分配的特性。
它是一个历史范畴,按其所产生的社会历史条件和社会性质的不同而不同,不存在永恒的公平;它也是一个客观范畴,尽管在不同的社会形态中内涵不同对其的理解不同,但都是社会存在的反映,具有客观性。
5.机会成本机会成本是指将一种资源用于某种用途,而未用于其他用途所放弃的最大预期收益。
其存在的前提条件是:①资源是稀缺的;②资源具有多种用途;③资源的投向不受限制。
6.理性人理性人是指系统而有目的地尽最大努力去实现其目标的人,是经济研究中所假设的、在一定条件下具有典型理性行为的经济活动主体。
7.边际变动边际变动是指对行动计划的微小增量调整。
8.激励激励是指引起一个人做出某种行为的某种东西。
9.市场经济市场经济是指由家庭和企业在市场上的相互交易决定资源配置的经济,而资源配置实际上就是决定社会生产什么、生产多少、如何生产以及为谁生产的过程。
第一篇导言第一章经济学十大原理复习题1.列举三个你在生活中面临的重要权衡取舍的例子。
答:①大学毕业后,面临着是否继续深造的选择,选择继续上学攻读研究生学位,就意味着在今后三年中放弃参加工作、赚工资和积累社会经验的机会;②在学习内容上也面临着很重要的权衡取舍,如果学习《经济学》,就要减少学习英语或其他专业课的时间;③对于不多的生活费的分配同样面临权衡取舍,要多买书,就要减少在吃饭、买衣服等其他方面的开支。
2.看一场电影的机会成本是什么?答:看一场电影的机会成本是在看电影的时间里做其他事情所能获得的最大收益,例如:看书、打零工。
8.为什么生产率是重要的?答:因为一国的生活水平取决于它生产物品与劳务的能力,而对这种能力的最重要的衡量度就是生产率。
生产率越高,一国生产的物品与劳务量就越多。
9.什么是通货膨胀,什么引起了通货膨胀?答:通货膨胀是流通中货币量的增加而造成的货币贬值,由此产生经济生活中价格总水平上升。
货币量增长引起了通货膨胀。
10.短期中通货膨胀与失业如何相关?答:短期中通货膨胀与失业之间存在着权衡取舍,这是由于某些价格调整缓慢造成的。
政府为了抑制通货膨胀会减少流通中的货币量,人们可用于支出的货币数量减少了,但是商品价格在短期内是粘性的,仍居高不下,于是社会消费的商品和劳务量减少,消费量减少又引起企业解雇工人。
在短期内,对通货膨胀的抑制增加了失业量。
问题与应用3.你正计划用星期六去从事业余工作,但一个朋友请你去滑雪。
去滑雪的真实成本是什么?现在假设你已计划这天在图书馆学习,这种情况下去滑雪的成本是什么?并解释之。
答:去滑雪的真实成本是周六打工所能赚到的工资,我本可以利用这段时间去工作。
如果我本计划这天在图书馆学习,那么去滑雪的成本是在这段时间里我可以获得的知识。
5.你管理的公司在开发一种新产品过程中已经投资500万美元,但开发工作还远远没有完成。
在最近的一次会议上,你的销售人员报告说,竞争性产品的进入使你们新产品的预期销售额减少为300万美元。
曼昆经济学原理试题及答案一、名词解释(每小题5分,共50分)机会成本科斯定理搭便车囚徒困境菲利普斯曲线供给侧凯恩斯革命看不见的手比较优势外部性二、简述题(第11、12、13题各12分,14题14分,共50分)1.简要描述银行存款的创建过程。
2.简述失业的根源及其类型。
3.简要描述节俭的对与错。
4.根据有关经济学原理,简析我国森林减少、珍稀动物来绝的原因及解决的措施。
三、论述题(每小题25分,共计50分)1.讨论人民币升值对中国经济的影响。
2.论述政府公共投资对国民经济的作用。
一、名词解释(每个子话题5分,共50分)1.机会成本:指人们利用一定资源获得某种收入时所放弃的在其他可能的用途中所能够获取的最大收入。
生产一单位的某种商品的机会成本是指生产者所放弃的使用相同的生产要素在其他生产用途中所能得到的最高收入。
机会成本的存在需要三个前提条件。
第一,资源是稀缺的;第二,资源具有多种生产用途;第三,资源的投无限制访问。
在从机会成本的角度审视生产过程时,制造商需要将生产要素投入到效益最大的项目中,以避免生产浪费,实现资源的最优配置。
机会成本的概念是基于资源的稀缺性。
在经济资源稀缺的前提下,当一个社会或企业利用一定的经济资源生产一定数量的一种或几种产品时,这些经济资源不能同时用于其他生产用途。
也就是说,这个社会或这个企业能够获得的一定数量的产品收入,是以放弃利用同样的经济资源生产其他产品所能获得的收入为代价的。
这也是机会成本的原因。
因此,一个社会生产一种产品的实际成本是它不能生产其他产品的成本。
因此,机会成本的含义是,任何生产资源或生产要素一般都有各种不同的方式或机会,也就是说,它可以用于生产各种产品。
然而,当一定数量的特定资源用于生产a类产品时,它们不能同时用于生产B类产品。
因此,生产一种产品的实际成本是不生产B产品的成本,或者等于这种资源生产B产品可能获得的最大回报。
如果一种资源决定用于一种产品,就牺牲了生产其他产品的机会;生产a级产品的收入来源于不从事或放弃生产其他产品的机会。
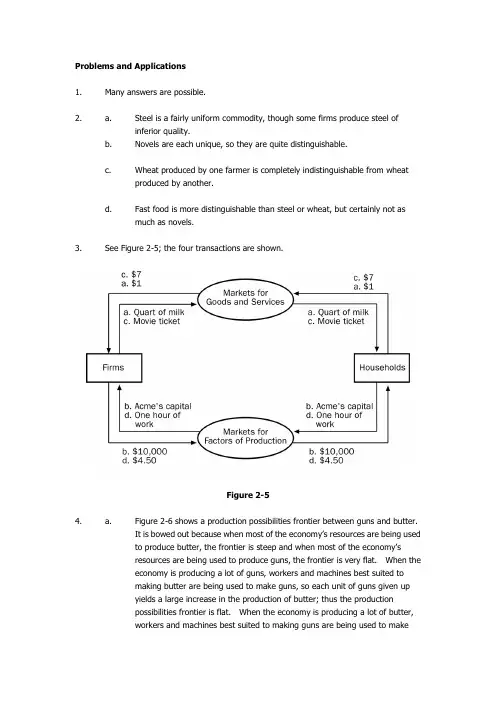
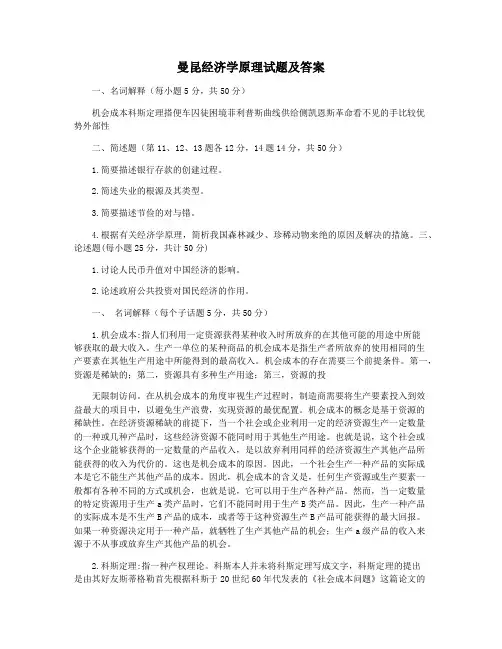
Problems and Applications1. Many answers are possible.2. a. Steel is a fairly uniform commodity, though some firms produce steel ofinferior quality.b. Novels are each unique, so they are quite distinguishable.c. Wheat produced by one farmer is completely indistinguishable from wheatproduced by another.d. Fast food is more distinguishable than steel or wheat, but certainly not asmuch as novels.3. See Figure 2-5; the four transactions are shown.Figure 2-54. a. Figure 2-6 shows a production possibilities frontier between guns and butter.It is bowed out because when most of the economy‟s resources are being usedto produce butter, the frontier is steep and when most of the economy‟sresources are being used to produce guns, the frontier is very flat. When theeconomy is producing a lot of guns, workers and machines best suited tomaking butter are being used to make guns, so each unit of guns given upyields a large increase in the production of butter; thus the productionpossibilities frontier is flat. When the economy is producing a lot of butter,workers and machines best suited to making guns are being used to makebutter, so each unit of guns given up yields a small increase in the productionof butter; thus the production possibilities frontier is steep.b. Point A is impossible for the economy to achieve; it is outside the productionpossibilities frontier. Point B is feasible but inefficient because it‟s inside theproduction possibilities frontier.Figure 2-6c. The Hawks might choose a point like H, with many guns and not much butter.The Doves might choose a point like D, with a lot of butter and few guns.d. If both Hawks and Doves reduced their desired quantity of guns by the sameamount, the Hawks would get a bigger peace dividend because the productionpossibilities frontier is much steeper at point H than at point D. As a result,the reduction of a given number of guns, starting at point H, leads to a muchlarger increase in the quantity of butter produced than when starting at pointD.5. See Figure 2-7. The shape and position of the frontier depend on how costly it is tomaintain a clean environment the productivity of the environmental industry. Gains in environmental productivity, such as the development of a no-emission auto engine, lead to shifts of the production-possibilities frontier, like the shift from PPF1 to PPF2shown in the figure.Figure 2-76. a. A family‟s decision about how much income to save is microeconomics.b. The effect of government regulations on auto emissions is microeconomics.c. The impact of higher saving on economic growth is macroeconomics.d. A firm‟s decision about how many workers to hire is microeconomics.e. The relationship between the inflation rate and changes in the quantity ofmoney is macroeconomics.7. a. The statement that society faces a short-run tradeoff between inflation andunemployment is a positive statement. It deals with how the economy is, nothow it should be. Since economists have examined data and found thatthere‟s a short-run negative relationship between inflation and unemployment,the statement is a fact, thus it‟s a positive statement.b. The statement that a reduction in the rate of growth of money will reduce therate of inflation is a positive statement. Economists have found that moneygrowth and inflation are very closely related. The statement thus tells howthe world is, and so it is a positive statement.c. The statement that the Federal Reserve should reduce the rate of growth ofmoney is a normative statement. It states an opinion about something thatshould be done, not how the world is.d. The statement that society ought to require welfare recipients to look for jobsis a normative statement. It doesn‟t state a fact about how the world is.Instead, it is a statement of how the world should be and is thus a normativestatement.e. The statement that lower tax rates encourage more work and more saving is apositive statement. Economists have studied the relationship between taxrates and work, as well as the relationship between tax rates and saving.They‟ve found a negative relationship in both cases. So the statementreflects how the world is, and is thus a positive statement.8. Two of the statements in Table 2-2 are clearly normative. They are: “5. If thefederal budget is to be balanced, it should be done over the business cycle rather than yearly” and “9. The government should restructure the welfare system along the lines of a …negative income tax.‟” Bot h are suggestions of changes that should be made,rather than statements of fact, so they are clearly normative statements.The other statements in the table are positive. All the statements concern how theworld is, not how the world should be. Note tha t in all cases, even though they‟restatements of fact, fewer than 100 percent of economists agree with them. You could say that positive statements are statements of fact about how the world is, but noteveryone agrees about what the facts are.9. As th e president, you‟d be interested in both the positive and normative views ofeconomists, but you‟d probably be most interested in their positive views. Economists are on your staff to provide their expertise about how the economy works. Theyknow many fa cts about the economy and the interaction of different sectors. So you‟d be most likely to call on them about questions of fact positive analysis. Since you‟re the president, you‟re the one who has the make the normative statements as to what should be done, with an eye to the political consequences. The normative statements made by economists represent their views, not necessarily either your‟s or theelectorate‟s.10. There are many possible answers.11. As of this writing, the chairman of the Federal Reserve is Alan Greenspan, the chair ofthe Council of Economic Advisers is Martin N. Baily, and the secretary of the treasury is Larry Summers.12. There are many possible answers.13. As time goes on, you might expect economists to disagree less about public policybecause they‟ll have opportunities to observe different policies that are put into place. As new policies are tried, their results will become known, and they can be evaluated better. It‟s likely that the disagreement about them will be reduced after they‟ve been tried in practice. For example, many economists thought that wage and price controls would be a good idea for keeping inflation under control, while others thought it was a bad idea. But when the controls were tried in the early 1970s, the results were disastrous. The controls interfered with the invisible hand of the marketplace and shortages developed in many products. As a result, most economists are now convinced that wage and price controls are a bad idea for controlling inflation.But it‟s unlikely that the differences between economists will ever be completely eliminated. Economists differ on too many aspects of how the world works. Plus, even as some policies get tried out and are either accepted or rejected, creative economists keep coming up with new ideas.。
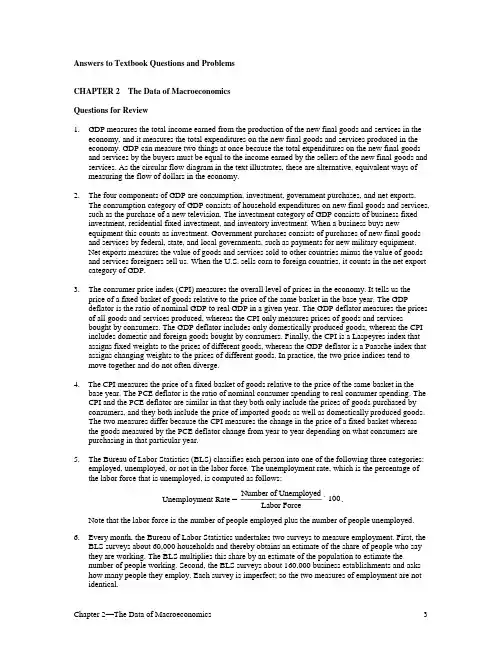
Answers to Textbook Questions and ProblemsCHAPTER 2 The Data of MacroeconomicsQuestions for Review1. GDP measures the total income earned from the production of the new final goods and services in theeconomy, and it measures the total expenditures on the new final goods and services produced in the economy. GDP can measure two things at once because the total expenditures on the new final goods and services by the buyers must be equal to the income earned by the sellers of the new final goods and services. As the circular flow diagram in the text illustrates, these are alternative, equivalent ways of measuring the flow of dollars in the economy.2. The four components of GDP are consumption, investment, government purchases, and net exports.The consumption category of GDP consists of household expenditures on new final goods and services, such as the purchase of a new television. The investment category of GDP consists of business fixed investment, residential fixed investment, and inventory investment. When a business buys newequipment this counts as investment. Government purchases consists of purchases of new final goods and services by federal, state, and local governments, such as payments for new military equipment.Net exports measures the value of goods and services sold to other countries minus the value of goods and services foreigners sell us. When the U.S. sells corn to foreign countries, it counts in the net export category of GDP.3. The consumer price index (CPI) measures the overall level of prices in the economy. It tells us theprice of a fixed basket of goods relative to the price of the same basket in the base year. The GDPdeflator is the ratio of nominal GDP to real GDP in a given year. The GDP deflator measures the prices of all goods and services produced, whereas the CPI only measures prices of goods and servicesbought by consumers. The GDP deflator includes only domestically produced goods, whereas the CPI includes domestic and foreign goods bought by consumers. Finally, the CPI is a Laspeyres index that assigns fixed weights to the prices of different goods, whereas the GDP deflator is a Paasche index that assigns changing weights to the prices of different goods. In practice, the two price indices tend to move together and do not often diverge.4. The CPI measures the price of a fixed basket of goods relative to the price of the same basket in the baseyear. The PCE deflator is the ratio of nominal consumer spending to real consumer spending. The CPI and the PCE deflator are similar in that they both only include the prices of goods purchased byconsumers, and they both include the price of imported goods as well as domestically produced goods.The two measures differ because the CPI measures the change in the price of a fixed basket whereas the goods measured by the PCE deflator change from year to year depending on what consumers are purchasing in that particular year.5. The Bureau of Labor Statistics (BLS) classifies each person into one of the following three categories:employed, unemployed, or not in the labor force. The unemployment rate, which is the percentage of the labor force that is unemployed, is computed as follows:Unemployment Rate = Number of UnemployedLabor Force´100.Note that the labor force is the number of people employed plus the number of people unemployed. 6. Every month, the Bureau of Labor Statistics undertakes two surveys to measure employment. First, theBLS surveys about 60,000 households and thereby obtains an estimate of the share of people who say they are working. The BLS multiplies this share by an estimate of the population to estimate thenumber of people working. Second, the BLS surveys about 160,000 business establishments and asks how many people they employ. Each survey is imperfect; so the two measures of employment are not identical.Problems and Applications1. From the main Web page click on the interactive data tab at the top, select GDP, begin usingthe data, section 1, and then table 1.1.1. Real GDP grew at a rate of 2.2 percent in quarter 4 of 2014.When compared to growth rates of −2.1percent, 4.6 percent, and 5 percent for the first three quarters of 2014, the rate of 2.2 percent was slightly below average. From the main Web page select the data tools tab, then top picks. Check the box for the unemployment rate and retrieve the data. The unemployment rate in March 2015 was 5.5 percent, which was about equal to the natural rate ofunemployment, or the long run average rate. From the main page, select the economic releases tab, then inflation and prices. Access the report for the CPI. In February 2015, the inflation rate for all items was 0 percent, and if food and energy were excluded the rate was 1.7 percent. The inflation rate was below average and below the Federal Reserve’s target of 2 percent.2. Value added by each person is equal to the value of the good produced minus the amount the personpaid for the materials needed to make the good. Therefore, the value added by the farmer is $1.00 ($1 –0 = $1). The value added by the miller is $2: she sells the flour to the baker for $3 but paid $1 for theflour. The value added by the baker is $3: she sells the bread to the engineer for $6 but paid the miller $3 for the flour. GDP is the total value added, or $1 + $2 + $3 = $6. Note that GDP equals the value of the final good (the bread).3. When a woman marries her butler, GDP falls by the amount of the butler’s salary. This happensbecause GDP measures total income, and therefore GDP, falls by t he amount of the butler’s loss i n salary. If GDP truly measures the value of all goods and services, then the marriage would not affect GDP since the total amount of economic activity is unchanged. Actual GDP, however, is an imperfect measure of economic activity because the value of some goods and services is left out. Once thebutler’s work becomes part of his household chores, his services are no longer counted in GDP. As this example illustrates, GDP does not include the value of any output produced in the home.4. a. The airplane sold to the U.S. Air Force counts as government purchases because the Air Force ispart of the government.b. The airplane sold to American Airlines counts as investment because it is a capital good sold to aprivate firm.c. The airplane sold to Air France counts as an export because it is sold to a foreigner.d. The airplane sold to Amelia Earhart counts as consumption because it is sold to a privateindividual.e. The airplane built to be sold next year counts as investment. In particular, the airplane is countedas inventory investment, which is where goods that are produced in one year and sold in anotheryear are counted.5. Data on parts (a) to (f) can be downloaded from the Bureau of Economic Analysis. Go to the Website, click on the interactive data tab at the top, select GDP, begin using the data, section 1, and then table 1.1.5. Choose the ―modify the data‖ option to select the years you in which you areinterested. By dividing each component (a) to (f) by nominal GDP and multiplying by 100, we obtain the following percentages:1950 1980 2014a. Personal consumption expenditures 64.0% 61.3% 68.5%b. Gross private domestic investment 18.8% 18.5% 16.4%c. Government consumption purchases 16.9% 20.6% 18.2%d. Net exports 0.2% –0.5% 3.1%e. National defense purchases 7.6% 6.3% 4.4%f. Imports 3.9% 10.3% 16.5%(Note: The above data was downloaded April 3, 2015, from the BEA Web site.)Among other things, we observe the following trends in the economy over the period 1950–2015:a. Personal consumption expenditures have been around two-thirds of GDP between 1980 and 2015.b. The share of GDP going to gross private domestic investment remained fairly steady.c. The share going to government consumption purchases rose sharply from 1950 to 1980.d. Net exports, which were positive in 1950, have been negative since that time.e. The share going to national defense purchases has fallen.f. Imports have grown rapidly relative to GDP.6.a. GDP measures the value of the final goods and services produced, or $1,000,000.b. NNP is equal to GNP minus depreciation. In this example, GDP is equal to GNP because there areno foreign transactions. Therefore, NNP is equal to $875,000.c. National income is equal to NNP, or $875,000.d. Employee compensation is equal to $600,000.e. Proprietors ’ income measures the income of the owner,and is equal to 150,000.f. Corporate profit is equal to corporate taxes plus dividends plus retained earnings, or $275,000. Retained earnings is calculated as sales minus wages minus dividends minus depreciation minus corporate tax, or $75,000.g. Personal income is equal to employee compensation plus dividends, or $750,000.h. Disposable personal income is personal income minus taxes, or $550,000.7. a. i.Nominal GDP is the total value of goods and services measured at currentprices. Therefore,Nominal GDP 2010 = P hotdogs 2010´Q hotdogs 2010()+P burgers 2010´Q burgers 2010()= ($2⨯200) + ($3⨯200)= $400 + $600= $1,000.Nominal GDP 2015 = P hotdogs 2015´Q hotdogs 2015()+P burgers 2015´Q burgers 2015()= ($4⨯ 250) + ($4⨯500)= $1,000 + $2,000= $3,000.ii. Real GDP is the total value of goods and services measured at constantprices. Therefore, to calculate real GDP in 2015 (with base year 2010), multiplythe quantities purchased in the year 2015 by the 2010 prices:Real GDP 2015 = P 2010hotdogs ´Q 2015hotdogs ()+P 2010burgers ´Q 2015burgers ()= ($2⨯ 250) + ($3⨯500)= $500 + $1,500= $2,000.Real GDP for 2010 is calculated by multiplying the quantities in 2010 by theprices in 2010. Since the base year is 2010, real GDP 2010 equals nominalGDP 2010, which is $10,00. Hence, real GDP increased between2010 and 2015.iii. The implicit price deflator for GDP compares the current prices of all goodsand services produced to the prices of the same goods and services in a baseyear. It is calculated as follows:Implicit Price Deflator 2015 = Nominal GDP 2010Real GDP 2010 = 1Using the values for Nominal GDP 2015 and real GDP 2015 calculated above:Implicit Price Deflator 2015=$3,000$2,000= 1.50.This calculation reveals that prices of the goods produced in the year 2015increased by 50 percent compared to the prices that the goods in the economysold for in 2010. (Because 2010 is the base year, the value for the implicitprice deflator for the year 2010 is 1.0 becausenominal and real GDP are thesame for the base year.)iv. The consumer price index (CPI) measures the level of prices in the economy.The CPI is called a fixed-weight index because it uses a fixed basket of goods over time to weight prices.If the base year is 2010, the CPI in 2015 is measuring the cost of the basket in 2015 relative to the cost in 2010. The CPI2015 is calculated as follows:CPI2015= (P2015hotdogs´Q2010hotdogs) + (P2015burgers´Q2010burgers)(P2010hotdogs´Q2010hotdogs) + (P2010burgers´Q2010burgers)= $16,000,000 $10,000,000= 1.6.This calculation shows that the price of goods purchased in 2015 increased by 60percentcompared to the prices these goods would have sold for in 2010. The CPIfor 2010, the baseyear, equals 1.0.b. The implicit price deflator is a Paasche index because it is computed with a changingbasket ofgoods; the CPI is a Laspeyres index because it is computed with afixed basket of goods. From(7.a.iii), the implicit price deflator for the year 2015 is1.50, which indicates that prices rose by 50percent from what they were in theyear 2010. From (7.a.iv.), the CPI for the year 2015 is 1.6,which indicates thatprices rose by 60 percent from what they were in the year 2010.If prices of all goods rose by, for example, 50 percent, then one could say unambiguouslythat the price level rose by 50 percent. Yet, in our example, relativeprices have changed. The price ofhot dogs rose by 1020 percent; the price of hamburgers roseby 33.33 percent, making hamburgers relatively less expensive.As the discrepancy between the CPI and the implicit price deflator illustrates,the change in the price level depends on how the goods’ prices are weighted.The CPI weights the price of goods by the quantities purchased in the year2010. The implicit price deflator weights the price of goods by the quantities purchasedin the year 2015. Since the quantity of the two goods was the same in2010, the CPI is placing equal weight on the two price changes. In 2015, the quantity ofhamburgers was twice as large as hot dogs, so there is twice as much weight placed on thehamburger price relative to the hot dog price. For this reason, the CPI shows a larger inflation rate – more weight is placed on the good with the larger price increase.8. a. The consumer price index uses the consumption bundle in year 1 to figure out howmuch weight toput on the price of a given good:CPI2=$2´10()+$1´0() $1´10()+$2´0()=P2red´Q1red()+P2green´Q1green()P1red´Q1red()+P1green´Q1green()= 2.According to the CPI, prices have doubled.b. Nominal spending is the total value of output produced in each year. In year 1 and year 2, Abbybuys 10 apples for $1 each, so her nominal spending remains constant at $10. For example,Nominal Spending2= P2red ´Q2red()+P2green´Q2green()= ($2 ⨯ 0) + ($1 ⨯ 10)= $10.c. Real spending is the total value of output produced in each year valued at the prices prevailing inyear 1. In year 1, the base year, her real spending equals her nominal spending of $10. In year 2, she consumes 10 green apples that are each valued at their year 1 price of $2, so her real spending is $20. That is,Real Spending2= P1red ´Q2red()+P1green´Q2green()= ($1 ⨯ 0) + ($2 ⨯ 10)= $20.Hence, Abby’s real spending rises from $10 to $20.d. The implicit price deflator is calculated by dividing Abby’s nominal spending inyear 2 by her realspending that year:Implicit Price Deflator2=Nominal Spending2 Real Spending2=$10 $20= 0.5.Thus, the implicit price deflator suggests that prices have fallen by half. The reasonfor this is that the deflator estimates how much Abby values her apples usingprices prevailing in year 1. Fromthis perspective green apples appear very valuable.In year 2, when Abby consumes 10 greenapples, it appears that her consumptionhas increased because the deflator values green apples more highly thanred apples. The only way she could still be spending $10 on a higherconsumptionbundle is if the price of the good she was consuming fell.e. If Abby thinks of red apples and green apples as perfect substitutes, then the costof living in thiseconomy has not changed—in either year it costs $10 to consume10 apples. According to the CPI, however, the cost of living has doubled. This isbecause the CPI only takes into account the factthat the red apple price has doubled;the CPI ignores the fall in the price of green apples becausethey were not inthe consumption bundle in year 1. In contrast to the CPI, the implicit pricedeflatorestimates the cost of living has been cut in half. Thus, the CPI, a Laspeyresindex,overstates the increase in the cost of living and the deflator, a Paascheindex, understates it.9. a. The labor force includes full time workers, part time workers, those who run their own business,and those who do not have a job but are looking for a job. The labor force consists of 70 people.The working age population consists of the labor force plus those not in the labor force. The 10discouraged workers and the 10 retired people are not in the labor force, but assuming they arecapable of working, they are part of the adult population. The adult population consists of 90people, so the labor force participation rate is equal to 70/90 or 77.8 percent.b. The number of unemployed workers is equal to 10, so the unemployment rate is 10/70 or 14.3percent.c. The household survey estimates total employment by asking a sample of households about theiremployment status. The household survey would report 60 people employed. The establishmentsurvey estimates total employment by asking a sample of businesses to report how many workers they are employing. In this case the establishment survey would report 55 people employed. The 5 people with 2 jobs would be counted twice, and the 10 people who run their own business wouldnot be counted.10. As Senator Robert Kennedy pointed out, GDP is an imperfect measure of economic performance orwell-being. In addition to the left-out items that Kennedy cited, GDP alsoignores the imputed rent on durable goods such as cars, refrigerators, and lawnmowers;many services and products produced as part of household activity, such as cooking andcleaning; and the value of goods produced and sold in illegal activities, such as the drugtrade. These imperfections in the measurement of GDP do notnecessarily reduce itsusefulness. As long as these measurement problems stay constant over time, then GDPis useful in comparing economic activity from year to year. Moreover, a large GDPallows us to afford better medical care for our children, newer books for their education,and more toys for their play. Finally, countries with higher levels of GDP tend to havehigher levels of life expectancy, better access to clean water and sanitation, and higherlevels of education. GDP is therefore a useful measure for comparing the level ofgrowth and development across countries.11. a. Real GDP falls because Disney World does not produce any services while it is closed. Thiscorresponds to a decrease in economic well-being because the income of workers and shareholders of Disney World falls (t he income side of the national accounts), and people’s consumption ofDisney World falls (the expenditure side of the national accounts).b. Real GDP rises because the original capital and labor in farm production now produce more wheat.This corresponds to an increase in the economic well-being of society, since people can nowconsume more wheat. (If people do not want to consume more wheat, then farmers and farmlandcan be shifted to producing other goods that society values.)c. Real GDP falls because with fewer workers on the job, firms produce less. This accurately reflectsa fall in economic well-being.d. Real GDP falls because the firms that lay off workers produce less. This decreases economic well-being because workers’ incomes fall (the inco me side), and there are fewer goods for people tobuy (the expenditure side).e. Real GDP is likely to fall, as firms shift toward production methods that produce fewer goods butemit less pollution. Economic well-being, however, may rise. The economy now produces lessmeasured output but more clean air. Clean air is not traded in markets and, thus, does not show up in measured GDP, but is nevertheless a good that people value.f. Real GDP rises because the high school students go from an activity in which they are notproducing market goods and services to one in which they are. Economic well-being, however,may decrease. In ideal national accounts, attending school would show up as investment because it presumably increases the future productivity of the worker. Actual national accounts do notmeasure this type of investment. Note also that future GDP may be lower than it would be if thestudents stayed in school, since the future work force will be less educated.g. Measured real GDP falls because fathers spend less time producing market goods and services.The actual production of goods and services need not have fallen because but unmeasuredproduction of child-rearing services rises. The well-being of the average person may very well rise if we assume the fathers and the children enjoy the extra time they are spending together.。
曼昆《经济学原理(微观经济学分册)》(第6版)第2章像经济学家一样思考课后习题详解跨考网独家整理最全经济学考研真题,经济学考研课后习题解析资料库,您可以在这里查阅历年经济学考研真题,经济学考研课后习题,经济学考研参考书等内容,更有跨考考研历年辅导的经济学学哥学姐的经济学考研经验,从前辈中获得的经验对初学者来说是宝贵的财富,这或许能帮你少走弯路,躲开一些陷阱。
以下内容为跨考网独家整理,如您还需更多考研资料,可选择经济学一对一在线咨询进行咨询。
一、概念题1.循环流量图(circular flow diagram)答:循环流量图是指表明物品和劳务、生产要素以及货币支付在家庭和企业之间如何流动的经济图形,如图2-1所示。
在这个模型中,经济由两类决策者——家庭和企业——所组成。
企业用劳动、土地和资本(建筑物和机器等)这些投入来生产物品和劳务,这些投入被称为生产要素。
家庭则拥有生产要素并消费企业生产的所有物品与劳务。
图2-1 循环流量图图2-1中,经济决策由家庭和企业做出。
家庭和企业在物品与劳务市场(在这个市场上,家庭是买者而企业是卖者)以及生产要素市场(在这个市场上,企业是买者而家庭是卖者)上相互交易。
外面一圈的箭头表示货币的流向,里面一圈的箭头表示相应的物品与劳务的流向。
循环流量图的形式是简化的,是整体经济的一个简化模型,因为它不包括国际贸易和政府。
2.生产可能性边界(production possibilities frontier)(深圳大学2007研;北京工业大学2008研)答:生产可能性边界也称为社会生产可能性边界或生产可能性曲线,指一个经济在可获得的生产要素与生产技术既定时所能生产的产品的产量的各种组合。
由于整个社会的经济资源是有限的,当这些经济资源都被充分利用时,增加一定量的一种产品的生产,就必须放弃一定量的另一种产品的生产。
整个社会生产的选择过程形成了一系列的产品间的不同产量组合,所有这些不同产量的组合就构成了社会生产的可能性边界。
经济学原理曼昆Chapter02第一篇:经济学原理曼昆Chapter 02Chapter 2 Thinking Like an EconomistMULTIPLE CHOICEFigure 2-1A12B1.Refer to Figure 2-1.Which shape refers to the markets for goods and services?a.oval Ab.oval Bc.rectangle 1d.rectangle 2a2.Refer to Figure 2-1.What is flowing from rectangle 1 to oval A?b a.revenue b.goods and services sold c.factors of productionbor, land, and capital3.Refer to Figure 2-1.Which of the following is an activity undertaken by the actors in rectangle 2? c a.produce and sell goods and services b.hire and use factors of production c.own and sell factors of production d.exchange goods and services between firms and householdsFigure 2-210987654321carsABCGDF204060E***80corn135Consider the production possibilities curve for a country that can produce cars, corn(in bushels), or a combination of the two.4.Refer to Figure 2-2.If this economy devotes all of its available resources to producing corn, then it will produced a.0 bushels of corn and 10 cars.b.135 bushels of corn and3 cars c.160 bushels of corn and 10 cars.d.160 bushels of corn and 0 cars.5.Refer to Figure 2-2.Which combination of points show production possibilities only achievable with improvementsin technology or increases in resources?d a.A, D, and E b.B and G c.C and F d.None of the above is correct.6.Refer to Figure 2-2.If this society moves from point D to point E,d a.it gives up 25 bushels of corn to get 3 cars.b.it gives up 135 bushels of corn to get 3 cars.c.it gives up 3 cars to get 135 bushels of corn.d.it gives up 3 cars to get 25 bushels of corn.7.Refer to Figure 2-2.If this society is producing at point C,d a.there is unemployment.b.production is efficient.c.growth can only be achieved through an advancement in technology.d.the opportunity cost of producing one more car is approximately 10 bushels of corn.8.Which of the following is a positive, as opposed to a normative, statement? b a.The US Department of Justice should allow a merger between AT&T and T-Mobile because it would have little effect on consumers.b.Antitrust laws should be used to prevent further concentration in the wireless telephone service market.c.The US Department of Justice sued AT&T to block its merger with T-Mobile.2d.The wireless telephone service market is too highly concentrated.9.Which of the following famous people did not major in economics in college?ba.Donald Trumpb.Natalie Portmanc.John Elwayd.Mick Jagger10.Which of the following statements is correct about environmental economists?d a.They view economics as a framework for natural resource allocation.b.They work at government agencies as well as universities and advocacy groups.c.They use economic arguments and systems to persuade companies to clean up pollution and conserve natural resources.d.All of the above arecorrect.11.In the ordered pair(20, 100), 20 is the a a.x-coordinate.b.y-coordinate.c.scatterplot.d.slope.12.Between the two ordered pairs(20, 100)and(30, 80), the slope isb a.1/2.b.-1/2.c.2.d.-2.Figure 2-4snowstorms***30405060708090snowblowers sold13.Refer to Figure 2-4.According to the graph, snowstorms aa.and snowblowers sold are positively correlated.b.and snowblowers sold are negatively correlatedc.and snowblowers sold are uncorrelated.d.are caused by more snowblowers being sold.314.Refer to Figure 2-4.Your friend John created the graph above to illustrate that snowstorms are caused by more snowblowers being sold.You inform him that his interpretation is incorrect due to a a.omitted variable bias.b.reverse causality.c.slope mismatch.d.shifting versus moving along a curve.15.Refer to Figure 2-4.Which of the following could be an omitted variable in the graph?d a.the price of snowblowers b.a change in consumers’ incomes c.a change in the seasons d.All of the above are correct.PROBLEMFigure 2-1A12B 1.2.3.4.Refer to Figure 2-1.What is the name of the model depicted in the figure?The Circular FlowRefer to Figure 2-1.What do the ovals represent in the figure?A: Markets for goods and service B: Markets for factors of productionRefer to Figure 2-1.What do the rectangles represent in the figure?1:Firms 2:HouseholdsRefer to Figure 2-1.What do the outer arrows represent in the figure?45.6.7.8.9.A to 1:revenue 1 toB :wages,rent, and profit B to 2 income 2 to A :spendingRefer to Figure 2-1.What do the inner arrows represent in the figure?A to 2:goods and services bought 2 to B:Labor,land,and capitalB to1:Factors of productionto A: goods and services soldRefer to Figure 2-1.What does the arrow going from oval A to rectangle 2 represent in the figure?A to 2:goods and services boughRefer to Figure 2-1.What does the arrow going from oval B to rectangle 2 represent in the figure?B to 2 incomeRefer to Figure 2-1.What are two elements not included in this figure that could be included in a more complex model?The three main factors of production, or categories of inputs, used by firms to produce goods and services areFigure 2-210987654321carsABCGDF204060E***80corn13510.11.12.13.Consider the production possibilities curve for a country that can produce cars, corn(in bushels), or a combination of the two.Refer to Figure 2-2.The bowed outward shape of the production possibilities curve indicates that opportunity cost of corn in terms of cars isRefer to Figure 2-2.Which point(s)on the graph is(are)efficient production possibilities?Refer to Figure 2-2.Which point(s)on the graph show unemployment of resources?Refer to Figure 2-2.Which point(s)on the graph is(are)unattainable given current resources and technology?514.15.16.17.18.19.20.21.Who would be more likely to study the effects of government spending on the unemployment rate, a macroeconomist or a microeconomist?Who would be more likely to study the effects of foreign competition on the accounting industry, a macroeconomist or a microeconomist?Who would be more likely to study the effects of rent control on housing in New York City, a macroeconomist or a microeconomist?Who would be more likely to study the inflation rate in the United States, a macroeconomist or a microeconomist?Is the following a positive or normative statement? The federal minimum wage is lower than many state minimum wages.Is the following a positive or normative statement? The Federal Reserve should set an inflation target and employ policies to meet the target.Is the following a positive or normative statement? The United States government should mandate that every citizen purchases health insurance.Is the following a positive or normative statement? The unemployment rate in Nevada is higher than the unemployment rate in New York.10987654321PriceABC***0Quantity22.Refer to Figure 2-3.What are the coordinates of point C?23.Refer to Figure 2-3.How are price and quantity related in this graph?624.Refer to Figure 2-3.What is the slope of the line?25.Refer to Figure 2-3.Is a move from point A to point B considered a shift of the curve or a movement along the curve? 第二篇:经济学原理曼昆课后答案 chapter 2Problems and Applications1.2.a.b.c.d.3.See Figure 2-5;the four transactions are shown.Fast food is more distinguishable than steel or wheat, but certainly not as much as novels.Wheat produced by one farmer is completely indistinguishable from wheat produced by another.Steel is a fairly uniform commodity, though some firms produce steel of inferior quality.Novels are each unique, so they are quite distinguishable.Many answers are possible.Figure 2-54.a.Figure 2-6 shows a production possibilities frontier between guns and butter.It is bowed out because when most of the economy‟s resources are being used to produce butter, the frontier is steep and when most of the economy‟s resources are being used to produce guns, the frontier is very flat.When the economy is producing a lot of guns, workers and machines best suited to making butter are being used to make guns, so each unit of guns given up yields a large increase in the production of butter;thus the production possibilities frontier is flat.When the economy is producing a lot of butter, workers and machines best suited to making guns are being used to make butter, so each unit of guns given up yields a small increase in the production of butter;thus the production possibilities frontier is steep.b.Point A is impossible for the economy to achieve;it is outside the production possibilities frontier.Point B is feasible but inefficient because it‟s inside the production possibilities frontier.Figure 2-6d.If both Hawks and Doves reduced their desired quantity of guns by the same amount, the Hawks would get a bigger peace dividend because the production possibilities frontier is much steeper at point H than at point D.As a result, the reduction of a given number of guns, starting at point H, leads to a much largerincrease in the quantity of butter produced than when starting at point D.5.See Figure 2-7.The shape and position of the frontier depend on how costly it is to maintain a clean environment the productivity of the environmental industry.Gains in environmental productivity, such as the development of a no-emission auto engine, lead to shifts of the production-possibilities frontier, like the shift from PPF1 to PPF2 c.The Hawks might choose a point like H, with many guns and not much butter.The Doves might choose a point like D, with a lot of butter and few guns.shown in the figure.6.a.b.c.d.e.7.a.b.c.Figure 2-7A family‟s decision about how much income to save is microeconomics.The effect of government regulations on auto emissions is microeconomics.The impact of higher saving on economic growth is macroeconomics.A firm‟s decision about how many workers to hire is microeconomics.The relationship between the inflation rate and changes in the quantity of money is macroeconomics.The statement that society faces a short-run tradeoff between inflation and unemployment is a positive statement.It deals with how the economy is, not how it should be.Since economists have examined data and found that there‟s a short-run negative relationship between inflation and unemployment, the statement is a fact, thus it‟s a positive statement.The statement that a reduction in the rate of growth of money will reduce the rate of inflation is a positive statement.Economists have found that money growth and inflation are very closely related.The statement thus tells how the world is, and so it is a positive statement.The statement that the Federal Reserve should reduce the rate of growth of money is a normative statement.It states an opinion about something that should be done, not how the world is.d.The statement thatsociety ought to require welfare recipients to look for jobs is a normative statement.It doesn‟t state a fact about how the world is.Instead, it is a statement of how the world should be and is thus a normative statement.e.The statement that lower tax rates encourage more work and more saving is a positive statement.Economists have studied the relationship between tax rates and work, as well as the relationship between tax rates and saving.They‟ve found a negative relationship in both cases.So the statement reflects how the world is, and is thus a positive statement.8.Two of the statements in Table 2-2 are clearly normative.They are: “5.If the federal budget is to be balanced, it should be done over the business cycle rather than yearly” and “9.The government should restructure the welfare system along the lines of a …negative income tax.‟” Both are suggestions of changes that should be made, rather than statements of fact, so they are clearly normative statements.The other statements in the table are positive.All the statements concern how the world is, not how the world should be.Note that in all cases, even though they‟re statements of fact, fewer than 100 percent of economists agree with them.You could say that positive statements are statements of fact about how the world is, but not everyone agrees about what the facts are.9.As the president, you ‟d be interested in both the positive and normative views of economists, but you‟d probably be most interested in their positive views.Economists are on your staff to provide their expertise about how the economy works.They know many facts about the economy and the interaction of different sectors.So you‟d be most likely to call on them about questions of fact positive analysis.Since you‟re the president, you‟re the one who has the make the normative statements as to what shouldbe done, with an eye to the political consequences.The normative statements made by economists represent their views, not necessarily either your‟s or the electorate‟s.10.11.As of this writing, the chairman of the Federal Reserve is Alan Greenspan, the chair of the Council of Economic Advisers is Martin N.Baily, and the secretary of the treasury is Larry Summers.12.13.As time goes on, you might expect economists to disagree less about public policy There are many possible answers.There are many possible answers.because they‟ll have opportunities to observe different policies that are put into place.As new policies are tried, their results will become known, and they can be evaluated better.It‟s likely that the disagreement about them will be reduced after they‟ve been tried in practice.For example, many economists thought that wage and price controls would be a good idea for keeping inflation under control, while others thought it was a bad idea.But when the controls were tried in the early 1970s, the results were disastrous.The controls interfered with the invisible hand of the marketplace and shortages developed in many products.As a result, most economists are now convinced that wage and price controls are a bad idea for controlling inflation.But it‟s unlikely that the differences between economists will ever be completely eliminated.Economists differ on too many aspects of how the world works.Plus, even as some policies get tried out and are either accepted or rejected, creative economists keep coming up with new ideas.第三篇:经济学原理曼昆课后答案 chapter 6Problems and Applications1.If the price ceiling of $40 per ticket is below the equilibrium price, then quantity demanded exceeds quantity supplied, so there’s a shortage of tickets.The policy decreases the number ofpeople who attend classical music concerts, since supply is lower because of the lower price.2.a.b.c.3.a.The imposition of a binding price floor in the cheese market is shown in Figure 6-3.In the absence of the price floor, the price would be P1 and the quantity would be Q1.With the floor set at Pf, which is greater than P1, the quantity demanded is Q2, while quantity supplied is Q3, so there is a surplus of cheese in the amount Q3$2.The quantity of beer sold declines to Q2.5.Reducing the payroll tax paid by firms and using part of the extra revenue to reduce the payroll tax paid by workers would not make workers better off because the division of the burden of a tax depends on supply and demand, not who must pay the tax.S ince the tax wedge would be larger, it’s likely that both firms and workers, who share the burden of any tax, would be worse off.6.If the government imposes a $500 tax on luxury cars, the price paid by consumers will rise less than $500, in general.The burden of any tax is shared by both producers and consumers−the price paid by consumers rises and the price received by producers falls, with the difference between the two equal to the amount of the tax.The only exceptions would be if the supply curve were perfectly elastic or the demand curve were perfectly inelastic, in which case consumers would bear the full burden of the tax and the price paid by consumers would rise by exactly $500.7.a.It doesn’t matter whether the tax is imposed on producers or consumers−the effect will be the same.With no tax, as shown in Figure 6-6, the demand curve is D1 and the supply curve is S1.If the tax is imposed on producers, the supply curve shifts up by the amount of the tax(50 cents)to S2.Then the equilibrium quantity is Q2, the price paid by consumers is P2, and the price received(after taxes are paid)by producers is P250 cents.Figure 6-6Figure 6-7b.The more elastic is the demand curve, the more effective this tax will be in reducing the quantity of gasoline consumed.Greater elasticity of demand means that quantity falls more in response to the rise in the price of gasoline.Figure 6-7 illustrates this result.Demand curve D1 represents an elastic demand curve, while demand curve D2 is more inelastic.To get the same tax wedge between demand and supply requires a greater reduction in quantity with demand curve D1 than for demand curve D2.c.d.The consumers of gasoline are hurt by the tax because they get less gasoline at a higher price.Workers in the oil industry are hurt by the tax as well.With a lower quantity of gasoline being produced, some workers may lose their jobs.With a lower price received by producers, wages of workers might decline.8.a.Figure 6-8 shows the effects of the minimum wage.In the absence of the minimum wage, the market wage would be w1 and Q1 workers would be employed.With the minimum wage(wm)imposed above w1, the market wage is wm, the number of employed workers is Q2, and the number of workers who are unemployed is Q3-Q2.Total wage payments to workers are shown as the area of rectangle ABCD, which equals wm times Q2.b.An increase in the minimum wage would decrease employment.The size of the effect on employment depends only on the elasticity of demand.The elasticity of supply doesn’t matter, because there’s a surplus of labor.c.The increase in the minimum wage would increase unemployment.The size of the rise in unemployment depends on both the elasticities of supply and demand.The elasticity of demand determines the quantity of labor demanded, the elasticity of supply determines the quantity of labor supplied, andthe difference between the quantity supplied and demanded of labor is the amount of unemployment.d.If the demand for unskilled labor were inelastic, the rise in the minimum wage would increase total wage payments to unskilled labor.With inelastic demand, the percentage decline in employment would be less than the percentage increase in the wage, so total wage payments increase.However, if the demand for unskilled labor were elastic, total wage payments would decline, since then the percentage decline in employment would exceed the percentage increase in the wage.9.a.Figure 6-8Figure 6-9Figure 6-9 shows the effect of a tax on gun buyers.The tax reduces the demand for guns from D1 to D2.The result is a rise in the price buyers pay for guns from P1 to P2, and a decline in the quantity of guns from Q1 to Q2.Figure 6-10b.Figure 6-10 shows the effect of a tax on gun sellers.The tax reduces the supply of guns from S1 to S2.The result is a rise in the price buyers pay for guns from P1 to P2, and a decline in the quantity of guns from Q1 to Q2.c.Figure 6-11 shows the effect of a binding price floor on guns.The increase in price from P1 to Pf leads to a decline in the quantity of guns from Q1 to Q2.There is excess supply in the market for guns, since the quantity supplied(Q3)exceeds the quantity demanded(Q2)at the price Pf.Figure 6-11d.10.a.Figure 6-12Figure 6-12 shows the effect of a tax on ammunition.The tax on ammunition reduces the demand for guns from D1 to D2, because ammunition and guns are complements.The result is a decline in the price of guns from P1 to P2, and a decline in the quantity of guns from Q1 to Q2.Programs aimed at making thepublic aware of the dangers of smoking reduce the demand for cigarettes, shown in Figure 6-13 as a shift from demand curve D1 to D2.The price support program increases the price of tobacco, which is the main ingredient in cigarettes.As a result, the supply of cigarettes shifts to the left, from S1 to S2.The effect of both programs is to reduce the quantity of cigarette consumption from Q1 to Q2.Figure 6-13b.c.11.a.b.The combined effect of the two programs on the price of cigarettes is ambiguous.The education campaign reduces demand for cigarettes, which tends to reduce the price.The tobacco price supports raise the cost of production of cigarettes, which tends to increase the price.The taxation of cigarettes further reduces cigarette consumption, since it increases the price to consumers.As shown in the figure, the quantity falls to Q3.The effect of a 50 cent per cone subsidy is to shift the demand curve up by 50 cents at each quantity, since at each quantity a consumer’s willingness to pay is 50 cents higher.The effects of such a subsidy are shown in Figure 6-14.Before the subsidy, the price is P1.After the subsidy, the price received by sellers is PS and the effective price paid by consumers is PD, which equals PS minus 50 cents.Before the subsidy, the quantity of cones sold is Q1;after the subsidy the quantity increases to Q2.Figure 6-14Because of the subsidy, consumers are better off, since they consume more at a lower price.Producers are also better off, since they sell more at a higher price.The government loses, since it has to pay for the subsidy.第四篇:曼昆经济学原理(推荐)《经济学原理》的主要内容包括:1.人们是如何决策的。
Chapter 2Thinking Like an EconomistTest A1. The production possibilities frontier is aa. map which shows the frontier beyond which agriculture is unprofitable.b. map which shows areas of the world in which capitalist production is now possible.c. graph that shows the various combinations of output that the economy can possibly producegiven the available resources and technology.d. graph which shows the various combinations of resources that can be used to produce a givenlevel of output.TYPE: M KEY1: D SECTION: 1 OBJECTIVE: 3 RANDOM: Y2. Which of the following concepts is NOT illustrated by the production possibilities frontier?a. efficiencyb. opportunity costc. equityd. tradeoffs3. On the production possibilities frontier shown, which point or points are possible for this economyto produce?a. A, B, C, Db. A, B, C, Fc. A, B, C, D, E, Fd. DRANDOM: Y10 Chapter 2/Thinking Like an Economist4. On the production possibilities frontier shown, which point or points are inefficient?a. A, B, Cb. E, Fc. Bd. D5. The opportunity cost of obtaining more of one good is shown on the production possibilities frontieras thea. amount of the other good which must be given up.b. market price of the additional amount produced.c. amount of resources which must be devoted to its production.d. number of dollars which must be spent to produce it.6. A production possibilities frontier will be linear and not bowed out ifa. no tradeoffs exist.b. the tradeoff between the two goods is always at a constant rate.c. the unemployment rate is zero.d. resources are allocated efficiently.7. In the production possibilities frontier shown, the shift of the frontier from A to B was most likelycaused by which of the following?a. more capital available in the economyb. more labor available in the economyc. a general technological breakthroughRANDOM: NChapter 2/Thinking Like an Economist 11 8. In the production possibilities frontier shown, what is the opportunity cost to society of themovement from point D to point B?a. 600 pretzelsb. 800 pretzelsc. 250 pretzelsd. 100 pretzels9. In the production possibilities frontier shown, the movement from point C to point E was most likelycaused bya. an increase in society’s preference for pretzels.b. a decrease in society’s preference for potato chips.c. unemployment.d. a and b10. Which of the following would be considered a topic of study in microeconomics?a. the effect of changes in saving rates on GDPb. the impact of minimum-wage laws on employment in the fast-food industryc. the impact of monetary policy on the rate of inflationd. the effect of tax policy on the rate of economic growth11. In the graph shown, the slope of the curve between points A and B isa. –2b. –1/2c. 1/2d. 21 ANSWER: c. graph that shows the various combinations of output that the economy can possiblyproduce given the available resources and technology.TYPE: M KEY1: D SECTION: 1 OBJECTIVE: 3 RANDOM: Y2 ANSWER: c. equityTYPE: M KEY1: D SECTION: 1 OBJECTIVE: 3 RANDOM: Y3 ANSWER: a. A, B, C, DTYPE: M KEY1: G SECTION: 1 OBJECTIVE: 3 GRAPH FORMAT: M QUESTION INSTRUCTION: 2 RANDOM: Y12 Chapter 2/Thinking Like an Economist4 ANSWER: d. DTYPE: M KEY1: G SECTION: 1 OBJECTIVE: 3 GRAPH FORMAT: M QUESTION INSTRUCTION: 2 RANDOM: Y5 ANSWER: a. amount of the other good which must be given up.TYPE: M KEY1: C SECTION: 1 OBJECTIVE: 3 RANDOM: Y6 ANSWER: b. the tradeoff between the two goods is always at a constant rate.TYPE: M KEY1: C SECTION: 1 OBJECTIVE: 1 RANDOM: Y7 ANSWER: d. technological improvement in the production of clothingTYPE: M KEY1: G SECTION: 1 OBJECTIVE: 3 GRAPH FORMAT: M QUESTION INSTRUCTION: 4 RANDOM: N8 ANSWER: c. 250 pretzelsTYPE: M KEY1: G SECTION: 1 OBJECTIVE: 3 GRAPH FORMAT: M QUESTION INSTRUCTION: 6 RANDOM: N9 ANSWER: c. unemployment.TYPE: M KEY1: G SECTION: 1 OBJECTIVE: 3 GRAPH FORMAT: M QUESTION INSTRUCTION: 6 RANDOM: N10 ANSWER: b. the impact of minimum-wage laws on employment in the fast-food industry TYPE: M KEY1: D SECTION: 1 OBJECTIVE: 4 RANDOM: Y11 ANSWER: b. –1/2TYPE: M KEY1: G GRAPH FORMAT: M QUESTION INSTRUCTION: 3 RANDOM: N。