曼昆经济学原理试题Chapter 09a
- 格式:doc
- 大小:180.00 KB
- 文档页数:9
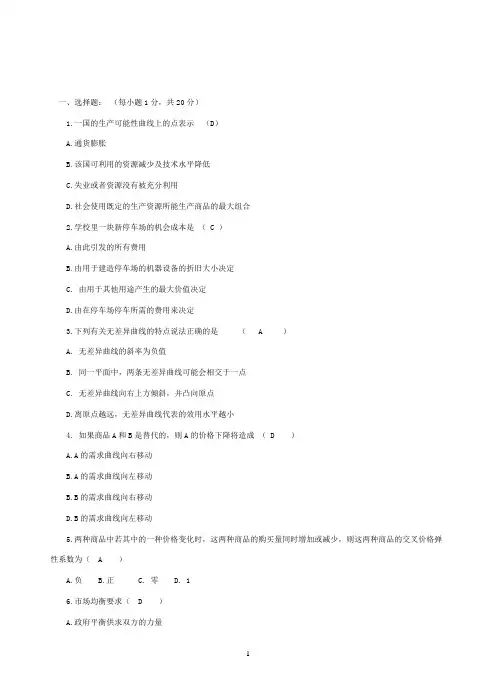
一、选择题:(每小题1分,共20分)1.一国的生产可能性曲线上的点表示(D)A.通货膨胀B.该国可利用的资源减少及技术水平降低C.失业或者资源没有被充分利用D.社会使用既定的生产资源所能生产商品的最大组合2.学校里一块新停车场的机会成本是( C )A.由此引发的所有费用B.由用于建造停车场的机器设备的折旧大小决定C. 由用于其他用途产生的最大价值决定D.由在停车场停车所需的费用来决定3.下列有关无差异曲线的特点说法正确的是( A )A. 无差异曲线的斜率为负值B. 同一平面中,两条无差异曲线可能会相交于一点C. 无差异曲线向右上方倾斜,并凸向原点D.离原点越远,无差异曲线代表的效用水平越小4. 如果商品A和B是替代的,则A的价格下降将造成( D )A.A的需求曲线向右移动B.A的需求曲线向左移动B.B的需求曲线向右移动D.B的需求曲线向左移动5.两种商品中若其中的一种价格变化时,这两种商品的购买量同时增加或减少,则这两种商品的交叉价格弹性系数为( A )A.负B.正C. 零D. 16.市场均衡要求( D )A.政府平衡供求双方的力量B.价格与数量相等C.价格保持不变D.在某一价格水平上,买者想要购买的数量恰好等于卖者想卖的数量7. 当总效用增加时,边际效用应该( C )A.为正值,并其值不断增加B. 为负值,并其值不断减少C.为正值,并其值不断减少D. 以上任何一种情况都有可能8.当生产函数Q=f ( L,K )的APL为递减时,则MPL( D )。
A.递减且为正B.递减且为负C.为零D.上述情况都可能9.在以下四种情况中,哪一种实现了生产要素的最适组合:( C )A. MPK / PK<MPL/ PLB. MPK / PK>MPL / PLC. MPK / PK=MPL/ PLD. MPK / PK ≥MPL/ PL10.边际成本低于平均成本时( B )。
A.平均成本上升B.平均成本下降C.成本下降D.平均可变成本上升11.长期边际成本曲线呈U型的原因是( A )。
人大经济学考研必备:曼昆《经济学原理》(第9章)第九章应用:国际贸易通过比较没有国际贸易时的国内价格和世界价格,可以确定自由贸易的影响。
国内价格低表明,该国在生产这种物品上有比较优势,而且将成为出口者。
国内价格高表明,世界其他国家在生产这种物品上有比较优势,而且该国将成为进口者。
当一国允许贸易并成为一种物品的出口者时,该物品的生产者状况变好,而该物品的消费者状况变坏。
当一国允许贸易并成为一种物品的进口者时,该物品的生产者状况变坏,而该物品的消费者状况变好。
但是这两种情况下,贸易的好处大于损失。
关税——进口的税——是市场接近于没有贸易时存在的均衡,因此,减少了贸易的好处。
虽然国内生产者的状况变好,而且政府增加了收入,但是消费者的损失大于这些好处。
d和f区域是关税带来的无谓损失。
进口配额的影响与关税类似。
但是,在进口配额时,进口许可证持有者得到了有关税时政府得到的收入(图中的蓝色区域),但是消费者的损失大于这些好处。
有各种配额限制贸易论:保护工作岗位,保卫国家安全,有助于幼稚产业,防止不公平竞争以及对外国的贸易限制做出反应。
尽管这些观点在某些情况下有某些优点,但经济学家相信,自由贸易通常是一种更好的政策。
第十章外部性第一节外部性和市场无效率所谓使市场最适合量,是考虑到外部性的影响之后的。
我们说,市场达到了所谓的均衡点的时候,有的时候可能并没有把外部性的因素考虑进去,比如我们家的那个橡胶厂,肯定没有把污染的因素考虑进去。
它的所谓的均衡,是建立在我们环境的污染这个基础之上的。
它的外部性是负的。
比如技术溢出(发明创新),它的外部性是正的。
外部性:一个人的行为对旁观者福利的影响。
正外部性;负外部性。
外部性的内在化:改变激励,以使人们考虑到自己行为的外部效应。
总之:政府可能对有负外部性的物品征税和对有正外部性的物品补助来把外部性内在化。
正外部性的例子:技术溢出。
对待技术溢出的方法:1. 政府旨在促进技术进步行业的经济干预——产业政策。

第4篇 经济周期理论:短期中的经济第9章 经济波动导论课后习题详解跨考网独家整理最全经济学考研真题,经济学考研课后习题解析资料库,您可以在这里查阅历年经济学考研真题,经济学考研课后习题,经济学考研参考书等内容,更有跨考考研历年辅导的经济学学哥学姐的经济学考研经验,从前辈中获得的经验对初学者来说是宝贵的财富,这或许能帮你少走弯路,躲开一些陷阱。
以下内容为跨考网独家整理,如您还需更多考研资料,可选择经济学一对一在线咨询进行咨询。
一、概念题1.奥肯定律(Okun ’s law )答:奥肯定律是表示失业率与实际国民收入增长率之间关系的经验统计规律,由美国经济学家奥肯在20世纪60年代初提出。
其主要内容是:失业率每高于自然失业率1个百分点,实际GDP 将低于潜在GDP 2个百分点。
奥肯定律的一个重要结论是:实际GDP 必须保持与潜在GDP 同样快的增长,以防止失业率的上升。
如果政府想让失业率下降,那么,该经济社会的实际GDP 的增长必须快于潜在GDP 的增长。
根据奥肯的研究,在美国,失业率每下降1%,实际国民收入增长2%。
但应该指出的是:①奥肯定律表明了失业率与实际国民收入增长率之间是反方向变动的关系;②两者的数量关系1∶2是一个平均数,在不同的时期,这一比率并不完全相同;③这一规律适用于经济没有实现充分就业时的情况。
在经济实现了充分就业时,这一规律所表示的自然失业率与实际国民收入增长率之间的关系要弱得多,一般估算是1∶0.76。
2.领先指标(leading indicators )答:领先指标是指一般先于整体经济变动的变量,可以帮助经济学家预测短期经济波动。
由于经济学家对前导指标可靠意见看法的不一致,导致经济学家给出不同的预测,其中就包括短期经济波动情况的预测。
领先指标的大幅度下降预示经济很可能会衰退,大幅度上升预示经济很可能会繁荣。
3.总需求(aggregate demand )答:总需求是指整个经济社会在任何一个给定的价格水平下对产品和劳务的需求总量。
曼昆《经济学原理》(微观)第五版测试题库(14)(1)Chapter 14Firms in Competitive MarketsTRUE/FALSE1. For a firm operating in a perfectly competitive industry, total revenue, marginal revenue, and average revenue are all equal.ANS: F DIF: 2 REF: 14-1 NAT: AnalyticLOC: Perfect competition TOP: Average revenue | Marginal rev-enueMSC: Interpretive2. For a firm operating in a perfectly competitive industry, marginal reve-nue and average revenue are equal.ANS: T DIF: 2 REF: 14-1 NAT: AnalyticLOC: Perfect competition TOP: Average revenue | Marginal rev-enueMSC: Interpretive3. If a firm notices that its average revenue equals the current market price, that firm must be participating in a competitive market.ANS: F DIF: 2 REF: 14-1 NAT: AnalyticLOC: Perfect competition TOP: Average revenueMSC: Interpretive4. A profit-maximizing firm in a competitive market will increase produc-tion when average revenue exceeds marginal cost. ANS: T DIF: 2 REF: 14-1 NAT: AnalyticLOC: Perfect competition TOP: Average revenueMSC: Interpretive5. Because there are many buyers and sellers in a perfectly competitive market, no one seller can influence the market price. ANS: T DIF: 1 REF: 14-1 NAT: AnalyticLOC: Perfect competition TOP: Competitive marketsMSC: Definitional6. Firms operating in perfectly competitive markets try to maximize prof-its.ANS: T DIF: 2 REF: 14-1 NAT: AnalyticLOC: Perfect competition TOP: Profit maximization929MSC: Applicative7. In competitive markets, firms that raise their prices are typically re-warded with larger profits.ANS: F DIF: 2 REF: 14-1 NAT: AnalyticLOC: Perfect competition TOP: Competitive marketsMSC: Interpretive8. When an individual firm in a competitive market increases its produc-tion, it is likely that the market price will fall. ANS: F DIF: 2 REF: 14-1 NAT: AnalyticLOC: Perfect competition TOP: Competitive marketsMSC: Interpretive9. In a competitive market, firms are unable to differentiate their product from that of other producers.ANS: T DIF: 1 REF: 14-1 NAT: AnalyticLOC: Perfect competition TOP: Competitive marketsMSC: Interpretive10. Firms in a competitive market are said to be price takers because there are many sellers in the market and the goods offered by the firms are very similar if not identical.ANS: T DIF: 2 REF: 14-1 NAT: AnalyticLOC: Perfect competition TOP: Competitive marketsMSC: Interpretive11. A firm's incentive to compare marginal revenue and marginal cost is an application of the principle that rational people think at the margin. ANS: T DIF: 1 REF: 14-2 NAT: AnalyticLOC: Perfect competition TOP: Profit maximizationMSC: Interpretive12. By comparing the marginal revenue and marginal cost from each unit produced, a firm in a competitive market can determine the profit-maximizing level of production.ANS: T DIF: 2 REF: 14-2 NAT: AnalyticLOC: Perfect competition TOP: Profit maximizationMSC: Interpretiveword⽂档可⾃由复制编辑Chapter 14/Firms in Competitive Markets 931 13. Firms operating in perfectly competitive markets produce an output level where marginal revenue equals marginal cost.ANS: T DIF: 2 REF: 14-2 NAT: AnalyticLOC: Perfect competition TOP: Marginal revenueMSC: Applicative14. A firm is currently producing 100 units of output per day. The man-ager reports to the owner that producing the 100th unit costs the firm $5. The firm can sell the 100th unit for $4.75. The firm should continue to pro-duce 100 units in order to maximize its profits (or minimize its losses). ANS: F DIF: 2 REF: 14-2 NAT: AnalyticLOC: Perfect competition TOP: Profit maximizationMSC: Analytical15. A firm is currently producing 100 units of output per day. The man-ager reports to the owner that producing the 100th unit costs the firm $5. The firm can sell the 100th unit for $5. The firm should continue to produce 100 units in order to maximize its profits (or minimize its losses).ANS: T DIF: 2 REF: 14-2 NAT: AnalyticLOC: Perfect competition TOP: Profit maximizationMSC: Analytical16. A firm is currently producing 100 units of output per day. The man-ager reports to the owner that producing the 100th unit costs the firm $5. The firm can sell the unit for $6. The firm should produce more than 100 units in order to maximize its profits (or minimize its losses).ANS: T DIF: 2 REF: 14-2 NAT: AnalyticLOC: Perfect competition TOP: Profit maximizationMSC: Analytical17. A dairy farmer must be able to calculate sunk costs in order to deter-mine how much revenue the farm receives for the typical gallon of milk. ANS: F DIF: 1 REF: 14-2 NAT: AnalyticLOC: Perfect competition TOP: Sunk costs MSC: I nterpretive18. Because nothing can be done about sunk costs, they are irrelevant to decisions about business strategy.ANS: T DIF: 2 REF: 14-2 NAT: AnalyticLOC: Perfect competition TOP: Sunk costs MSC: I nterpretive19. A miniature golf course is a good example of where fixed costs be-come relevant to the decision of when to open and when to close for the season.ANS: F DIF: 2 REF: 14-2 NAT: AnalyticLOC: Perfect competition TOP: Sunk costs MSC: I nterpretive20. A popular resort restaurant will maximize profits if it chooses to stay open during the less-crowded “off season” when its total revenues exceed its variable costs.ANS: T DIF: 2 REF: 14-2 NAT: AnalyticLOC: Perfect competition TOP: Sunk costs MSC: I nterpretive21. All firms maximize profits by producing an output level where marginal revenue equals marginal cost; for firms operating in perfectly competitive in-dustries, maximizing profits also means producing an output level where price equals marginal cost.ANS: T DIF: 2 REF: 14-2 NAT: AnalyticLOC: Perfect competition TOP: Profit maximizationMSC: Interpretive22. A firm operating in a perfectly competitive industry will continue to op-erate in the short run but earn losses if the market price is less than that firm’s average total cost but greater than the firm’s average variable cost. ANS: T DIF: 2 REF: 14-2 NAT: AnalyticLOC: Perfect competition TOP: Supply curveMSC: Interpretive23. A firm operating in a perfectly competitive industry will continue to op-erate in the short run but earn losses if the market price is less than that firm’s average variable co st.ANS: F DIF: 2 REF: 14-2 NAT: AnalyticLOC: Perfect competition TOP: Supply curveMSC: Interpretive24. A firm operating in a perfectly competitive industry will shut down in the short run but earn losses if the market price is less than that firm’s aver-age variable cost.ANS: T DIF: 2 REF: 14-2 NAT: AnalyticLOC: Perfect competition TOP: Supply curveMSC: Interpretiveword⽂档可⾃由复制编辑Chapter 14/Firms in Competitive Markets 933 25. In the short run, a firm should exit the industry if its marginal cost ex-ceeds its marginal revenue.ANS: F DIF: 2 REF: 14-2 NAT: AnalyticLOC: Perfect competition TOP: Supply curveMSC: Interpretive26. In making a short-run profit-maximizing production decision, the firm must consider both fixed and variable cost. ANS: F DIF: 2 REF: 14-2 NAT: AnalyticLOC: Perfect competition TOP: Profit maximizationMSC: Interpretive27. A firm will shut down in the short run if revenue is not sufficient to cov-er its variable costs of production.ANS: T DIF: 2 REF: 14-2 NAT: AnalyticLOC: Perfect competition TOP: Shut down MSC: I nterpretive28. Suppose a firm is considering producing zero units of output. We call this shutting down in the short run and exiting an industry in the long run. ANS: T DIF: 2 REF: 14-2 NAT: AnalyticLOC: Perfect competition TOP: Shut down MSC: I nterpretive29. Suppose a firm is considering producing zero units of output. We call this exiting an industry in the short run and shutting down in the long run. ANS: F DIF: 2 REF: 14-2 NAT: AnalyticLOC: Perfect competition TOP: Shut down MSC: I nterpretive30. A firm will shut down in the short run if revenue is not sufficient to cov-er all of its fixed costs of production.ANS: F DIF: 2 REF: 14-2 NAT: AnalyticLOC: Perfect competition TOP: Shut down MSC: I nterpretive31. The supply curve of a firm in a competitive market is the average va-riable cost curve above the minimum of marginal cost.ANS: F DIF: 2 REF: 14-2 NAT: AnalyticLOC: Perfect competition TOP: Supply curveMSC: Interpretive32. When a profit-maximizing firm in a competitive market experiences rising prices, it will respond with an increase in production.ANS: T DIF: 2 REF: 14-2 NAT: AnalyticLOC: Perfect competition TOP: Profit maximizationMSC: Interpretive33. The marginal firm in a competitive market will earn zero economic profit in the long run.ANS: T DIF: 2 REF: 14-2 NAT: AnalyticLOC: Perfect competition TOP: Economic profitMSC: Interpretive34. A profit-maximizing firm in a competitive market will earn zero ac-counting profits in the long run.ANS: F DIF: 2 REF: 14-2 NAT: AnalyticLOC: Perfect competition TOP: Accounting profitMSC: Interpretive35. In the long run, when price is less than average total cost for all possi-ble levels of production, a firm in a competitive market will choose to exit (or not enter) the market.ANS: T DIF: 2 REF: 14-2 NAT: AnalyticLOC: Perfect competition TOP: Profit maximizationMSC: Interpretive36. In the long run, when price is greater than average total cost, some firms in a competitive market will choose to enter the market.ANS: T DIF: 2 REF: 14-2 NAT: AnalyticLOC: Perfect competition TOP: Profit maximizationMSC: Interpretive37. In the long run, a firm should exit the industry if its total costs exceed its total revenues.ANS: T DIF: 2 REF: 14-2 NAT: AnalyticLOC: Perfect competition TOP: Profit maximizationMSC: Interpretive38. When a resource used in the production of a good sold in a competi-tive market is available in only limited quantities, the long-run supply curve is likely to be upward sloping.ANS: T DIF: 2 REF: 14-3 NAT: AnalyticLOC: Perfect competition TOP: Supply curveMSC: Interpretiveword⽂档可⾃由复制编辑Chapter 14/Firms in Competitive Markets 935 39. A firm operating in a perfectly competitive industry will continue to op-erate if it earns zero economic profits because it is likely to be earning posi-tive accounting profits.ANS: T DIF: 2 REF: 14-3 NAT: AnalyticLOC: Perfect competition TOP: Competitive marketsMSC: Interpretive40. A firm operating in a perfectly competitive industry will shut down in the short run if its economic profits fall to zero because it is likely to be earn-ing negative accounting profits.ANS: F DIF: 2 REF: 14-3 NAT: AnalyticLOC: Perfect competition TOP: Competitive marketsMSC: Interpretive41. A firm operating in a perfectly competitive market may earn positive, negative, or zero economic profit in the long run. ANS: F DIF: 2 REF: 14-3 NAT: AnalyticLOC: Perfect competition TOP: Long-run supply curveMSC: Interpretive42. A firm operating in a perfectly competitive market may earn positive, negative, or zero economic profit in the short run. ANS: T DIF: 2 REF: 14-3 NAT: AnalyticLOC: Perfect competition TOP: Long-run supply curveMSC: Interpretive43. A firm operating in a perfectly competitive market earns zero economic profit in the long run but remains in business because the firm’s revenues cover the business owners’ opportunity costs.ANS: T DIF: 2 REF: 14-3 NAT: AnalyticLOC: Perfect competition TOP: Zero-profit conditionMSC: Interpretive44. A competitive market will typically experience entry and exit until ac-counting profits are zero.ANS: F DIF: 2 REF: 14-3 NAT: AnalyticLOC: Perfect competition TOP: Zero-profit conditionMSC: Interpretive45. The long-run equilibrium in a competitive market characterized by firms with identical costs is generally characterized by firms operating at effi-cient scale.ANS: T DIF: 2 REF: 14-3 NAT: AnalyticLOC: Perfect competition TOP: Zero-profit conditionMSC: Interpretive46. In the long run, a competitive market with 1,000 identical firms will ex-perience an equilibrium price equal to the minimum of each firm's average total cost.ANS: T DIF: 2 REF: 14-3 NAT: AnalyticLOC: Perfect competition TOP: Zero-profit conditionMSC: Interpretive47. In a long-run equilibrium where firms have identical costs, it is possible that some firms in a competitive market are making a positive economic prof-it.ANS: F DIF: 2 REF: 14-3 NAT: AnalyticLOC: Perfect competition TOP: Zero-profit conditionMSC: Interpretive48. When economic profits are zero in equilibrium, the firm's revenue must be sufficient to cover all opportunity costs. ANS: T DIF: 2 REF: 14-3 NAT: AnalyticLOC: Perfect competition TOP: Zero-profit conditionMSC: Interpretive49. The short-run supply curve in a competitive market must be more elastic than the long-run supply curve.ANS: F DIF: 2 REF: 14-3 NAT: AnalyticLOC: Perfect competition TOP: Supply curveMSC: Interpretive50. The long-run supply curve in a competitive market is more elastic than the short-run supply curve.ANS: T DIF: 2 REF: 14-3 NAT: AnalyticLOC: Perfect competition TOP: Supply curveMSC: InterpretiveSHORT ANSWERword⽂档可⾃由复制编辑Chapter 14/Firms in Competitive Markets 937 1. Describe the difference between average revenue and marginal reve-nue. Why are both of these revenue measures important to a prof-it-maximizing firm?ANS:Average revenue is total revenue divided by the quantity of output. Marginal revenue is the change in total revenue from the sale of each additional unit of output. Marginal revenue is used to determine the profit-maximizing level of production, and average revenue is used to help determine the level of profits. Note that for all firms, price equals average revenue because AR=(PxQ)/Q=P. But only for a firm operating in a perfectly competitive industry does price al-so equal marginal revenue.DIF: 2 REF: 14-1 NAT: Analytic LOC: Perfect competitionTOP: Price MSC: D efinitional2. List and describe the characteristics of a perfectly competitive market. ANS:There are many buyers and sellers in the market. The goods offered by the various sellers are largely the same. Firms can freely enter or exit the market. DIF: 2 REF: 14-1 NAT: Analytic LOC: Perfect competitionTOP: Competitive markets MSC: D efinitional3. Why would a firm in a perfectly competitive market always choose to set its price equal to the current market price? If a firm set its price below the current market price, what effect would this have on the market?ANS:The firm could not sell any more of its product at a lower price than it could sell at the market price. As a result, it would needlessly forgo revenue if it set a price below the market price. If the firm set a higher price, it would not sell anything at all because a competitive market has many sellers who would supply the product at the market price.DIF: 2 REF: 14-1 NAT: Analytic LOC: Perfect competitionTOP: Profit maximization MSC: A nalytical4. Use a graph to demonstrate the circumstances that would prevail in a competitive market where firms are earning economic profits. Can this sce-nario be maintained in the long run? Explain your answer.ANS:In a competitive market where firms are earning economic profits, new firms will have an incentive to enter the market. This entry will expand the number of firms, increase the quantity of the good supplied, and drive down pricesword ⽂档可⾃由复制编辑 and profits. Entry will cease once firms are producing the output level where price equals the minimum of the average total cost curve, meaning that eachfirm earns zero economic profits in the long run.DIF: 2 REF: 14-2 NAT: AnalyticLOC: Perfect competition TOP: Profit maximization MSC: A nalytical5. Explain how a firm in a competitive market identifies the prof-it-maximizing level of production. When should the firm raise production, and when should the firm lower production? ANS:The firm selects the level of output at which marginal revenue is equal tomarginal cost. If MR > MC, profit will increase if the firm increases Q. If MR < MC, profit will increase if the firm decreases Q. DIF: 2 REF: 14-2 NAT: AnalyticLOC: Perfect competition TOP: Profit maximization MSC: A nalytical6. News reports from the western United States occasionally report inci-dents of cattle ranchers slaughtering a large number of newborn calves and burying them in mass graves rather than transporting them to markets. As-suming that this is rational behavior by profit-maximizing "firms," explain what economic factors may influence such behavior.ANS:If the selling price is not sufficient to cover the variable cost of sending the calves to market, this (potentially emotionally upsetting) behavior makes economic sense.DIF: 2 REF: 14-2 NAT: AnalyticLOC: Perfect competition TOP: Profit maximization MSC: A nalytical。
曼昆《经济学原理(微观经济学分册)》(第6版)第9章应用:国际贸易课后习题详解跨考网独家整理最全经济学考研真题,经济学考研课后习题解析资料库,您可以在这里查阅历年经济学考研真题,经济学考研课后习题,经济学考研参考书等内容,更有跨考考研历年辅导的经济学学哥学姐的经济学考研经验,从前辈中获得的经验对初学者来说是宝贵的财富,这或许能帮你少走弯路,躲开一些陷阱。
以下内容为跨考网独家整理,如您还需更多考研资料,可选择经济学一对一在线咨询进行咨询。
一、概念题1.世界价格(world price)答:世界价格也称世界市场价格,指一种物品在世界市场上交易的价格。
世界价格是由商品的国际价值决定的。
国际价值是世界市场商品交换的惟一依据,各国商品的国别价值都必须还原为国际价值,以便在国际市场上交换。
而各国商品的国别价值在多大程度上表现为国际价值,是与各国的经济技术水平、劳动强度和劳动生产率密切相关的。
一般来说,一国的经济技术水平和劳动生产率越高,其商品价值就越低于国际商品价值,若按照国际商品价值出售,就能获得较好的经济效益;相反则会在竞争中处于不利的地位。
2.关税(tariff)答:关税是指对在国外生产而在国内销售的物品征收的税。
与其他税收相比,关税有两个主要特点:第一,关税的征收对象是进出境的货物和物品;第二,关税具有涉外性,是对外贸易政策的重要手段。
征收关税的作用主要有两个方面:一是增加本国财政收入;二是保护本国的产业和国内市场。
其中以前者为目的而征收的关税称为财政关税,以后者为目的而征收的关税称为保护关税。
与任何一种物品销售税一样,关税会扭曲激励,使得稀缺资源的配置背离最优水平,使市场接近于没有贸易时的均衡,因此,减少了贸易的好处。
关税虽然使国内生产者的状况变好,而且政府增加了收入,但造成消费者的损失大于获得的这些好处。
关税造成的无谓损失具体表现为:第一,关税使国内生产者能收取的价格高于世界价格,结果,鼓励他们增加低效率地生产。

第一章经济学十大原理问题与应用2.你正想决定是否去度假。
度假的大部分成本(机票、旅馆、放弃的工资)都用美元来衡量,但度假的收益是心理的。
你将如何比较收益与成本呢??答:这种心理上的收益可以用是否达到既定目标来衡量。
对于这个行动前就会作出的既定目标,我们一定有一个为实现目标而愿意承担的成本范围。
在这个可以承受的成本范围内,度假如果满足了既定目标,如:放松身心、恢复体力等等,那么,就可以说这次度假的收益至少不小于它的成本。
3.你正计划用星期六去从事业余工作,但一个朋友请你去滑雪。
去滑雪的真实成本是什么?现在假设你已计划这天在图书馆学习,这种情况下去滑雪的成本是什么?请解释之。
答:去滑雪的真实成本是周六打工所能赚到的工资,我本可以利用这段时间去工作。
如果我本计划这天在图书馆学习,那么去滑雪的成本是在这段时间里我可以获得的知识。
4.你在篮球比赛的赌注中赢了100美元。
你可以选择现在花掉它或在利率为5%的银行中存一年。
现在花掉100美元的机会成本是什么呢?答:现在花掉100 美元的机会成本是在一年后得到105 美元的银行支付(利息+本金)。
6.你的室友做饭比你好,但你打扫房间比你的室友快。
如果你的室友承担全部做饭工作,你承担全部打扫工作,那么你所要花费的时间比你们平均分摊两种家务时花费的时间多了还是少了?试举一个类似的例子,说明专业化和贸易如何使两个国家的状况变得更好。
答:我们俩各自承担自己擅长的工作比我们平均分摊两种家务时,我要花费的时间少了,因为娴熟的技巧使工作效率提高。
举例:假设A 国比B 国擅长生产丝绸,而B 国生产皮毛制品的效率比A 国高,如果A 国专门生产丝绸,B国专门生产皮毛制品,由于它们各自在相关生产上的优势,会使两种商品的生产率提高,有更多的丝绸和皮毛制品在市场上供应。
这样,A、B 两国间的专业分工和相互贸易使两国消费者有更多的丝绸和皮毛制品可供消费,两国的生活水平都提高了。
7.解释下列每一项政府活动的动机是关注平等还是关注效率。
Chapter 7Consumers, Producers, and the Efficiency of MarketsTest A1. Welfare economics is the study ofa. the well-being of less fortunate people.b. welfare programs in the United States.c. the effect of income redistribution on work effort.d. how the allocation of resources affects economic well-being.TYPE: M KEY1: D OBJECTIVE: 1 RANDOM: Y2. The equilibrium of supply and demand in a marketa. maximizes the profits of producers.b. minimizes the costs incurred by consumers.c. maximizes the total benefits received by buyers and sellers.d. minimizes the expenditures of buyers.TYPE: M KEY1: D OBJECTIVE: 1 RANDOM: Y3. The area below a demand curve and above the price measuresa. total surplus.b. producer surplus.c. willingness to pay.d. consumer surplus.TYPE: M KEY1: D SECTION: 1 OBJECTIVE: 2 RANDOM: N4. Willingness to pay measures thea. maximum amount that a buyer will pay for a good.b. amount a seller actually receives for a good minus the minimum amount the seller is willing toaccept.c. maximum amount a buyer is willing to pay minus the minimum amount a seller is willing toaccept.d. amount a buyer is willing to pay for a good minus the amount the buyer actually pays for it. TYPE: M KEY1: D SECTION: 1 OBJECTIVE: 1 RANDOM: Y5. If a consumer is willing and able to pay $15.50 for a particular good but the price of the good is$16.00, then thea. market must not be a perfectly competitive market.b. consumer would have consumer surplus of $0.50.c. consumer would not purchase the good and would not have any consumer surplus.d. consumer would increase his/her willingness and ability to pay by earning more.TYPE: M KEY1: E SECTION: 1 OBJECTIVE: 1 RANDOM: Y70 Chapter 7/Consumers, Producers, and the Efficiency of Markets6. If Brock is willing to pay $500 for a new suit, but is able to buy the suit for $350, his consumersurplus isa. $850.b. $500.c. $350.d. $150.TYPE: M KEY1: E SECTION: 1 OBJECTIVE: 1 RANDOM: Y7. Sharon values a lawnmower at $300, but buys it for $200. Sharon’s willingness to pay isa. $500.b. $300.c. $200.d. $100.TYPE: M KEY1: E SECTION: 1 OBJECTIVE: 2 RANDOM: Y8. Consumer surplus is thea. quantity of a good consumers get free.b. total value of a good to a consumer.c. amount a consumer is willing to pay less the amount the consumer actually pays.d. amount a consumer has to pay less the amount the consumer was willing to pay. TYPE: M KEY1: D SECTION: 1 OBJECTIVE: 2 RANDOM: Y9. If you pay a price exactly equal to your willingness to pay, thena. you place little value on the good.b. your consumer surplus is $0.c. your consumer surplus is negative.d. your willingness to pay is less than your consumer surplus.TYPE: M KEY1: D SECTION: 1 OBJECTIVE: 2 RANDOM: YChapter 7/Consumers, Producers, and the Efficiency of Markets 7110. Refer to the graph shown. When the price rises from P1 to P2, consumer surplusa. increases by an amount equal to A.b. decreases by an amount equal to C.c. decreases by an amount equal to B + C.d. increases by an amount equal to B + C.TYPE: M KEY1: G SECTION: 1 OBJECTIVE: 2 GRAPH FORMAT: M RANDOM: N11. Consumer surplus equalsa. Value to buyers – Costs of sellers.b. Value to buyers – Amount paid by buyers.c. Amount received by sellers – Costs of sellers.d. Value to buyers – Amount paid by buyers + Amount received by sellers – Costs of sellers. TYPE: M KEY1: T SECTION: 1 OBJECTIVE: 2 INSTRUCTION: 1 RANDOM: N12. Cost is a measure of thea. producer shortage.b. seller’s willingness to sell.c. seller’s producer surplus.d. seller’s willingness to buy.TYPE: M KEY1: D SECTION: 2 OBJECTIVE: 3 RANDOM: Y13. Producer surplus is thea. amount a seller is paid less the cost of production.b. cost to sellers of participating in a market.c. amount represented by the area under the supply curve.d. area under the supply curve to the left of the amount sold.TYPE: M KEY1: D SECTION: 2 OBJECTIVE: 4 RANDOM: Y14. The marginal seller is the seller whoa. can produce at the lowest cost.b. has the greatest producer surplus.c. cannot compete with the other sellers in the market.d. would leave the market first if the price were any lower.TYPE: M KEY1: D SECTION: 2 OBJECTIVE: 4 RANDOM: Y72 Chapter 7/Consumers, Producers, and the Efficiency of Markets15. Producer surplus is the areaa. under the supply curve.b. below the price and above the supply curve.c. between the supply and demand curves.d. under the demand curve, and above the price.TYPE: M KEY1: D SECTION: 2 OBJECTIVE: 4 RANDOM: Y16. According to the graph shown, when the price is P2, producer surplus is equal toa. A.b. A + C.c. D + E.d. A + B + C.TYPE: M KEY1: G SECTION: 2 OBJECTIVE: 4 GRAPH FORMAT: M RANDOM: N17. According to the graph shown, when the price falls from P2 to P1, producer surplusa. decreases by an amount equal to A.b. decreases by an amount equal to A + B.c. decreases by an amount equal to A + C.d. increases by an amount equal to A + B.TYPE: M KEY1: G SECTION: 2 OBJECTIVE: 4 GRAPH FORMAT: M RANDOM: N18. Producer surplus measures thea. loss to sellers.b. well-being of sellers.c. well-being of society as a whole.d. well-being of buyers and sellers.TYPE: M KEY1: D SECTION: 2 OBJECTIVE: 4 RANDOM: YChapter 7/Consumers, Producers, and the Efficiency of Markets 73 19. Donald produces nails at a cost of $200 per ton. If he sells the nails for $500 per ton, his producersurplus isa. $700 per ton.b. $500 per ton.c. $300 per ton.d. $200 per ton.TYPE: M KEY1: E SECTION: 2 OBJECTIVE: 4 RANDOM: Y20. If Dale sells a shirt for $40, and his producer surplus from the sale is $23, his cost must have beena. $17.b. $23.c. $40.d. $63.TYPE: M KEY1: E SECTION: 2 OBJECTIVE: 4 RANDOM: Y21. We can say that the allocation of resources is efficient ifa. total surplus is maximized.b. consumer surplus is maximized.c. producer surplus is maximized.d. None of the above is correct.TYPE: M KEY1: D SECTION: 3 OBJECTIVE: 5 RANDOM: Y22. Total surplus in a market equalsa. Value to buyers – Amount paid by buyers.b. Value to buyers – Costs of sellers.c. Amount received by sellers – Costs of sellers.d. Amount received by sellers – Amount paid by buyers.TYPE: M KEY1: D SECTION: 3 OBJECTIVE: 5 RANDOM: Y74 Chapter 7/Consumers, Producers, and the Efficiency of Markets23. In the figure shown, at the market-clearing equilibrium, total surplus is represented by the areaa. A + B + C.b. A + B + D + F.c. A + B + C + D + E + F.d. A + B + C + D + E + F + G + H.TYPE: M KEY1: G SECTION: 3 OBJECTIVE: 5 GRAPH FORMAT: M RANDOM: Y24. According to the graph, at quantities greater than the equilibrium quantity in a free market,a. the cost to sellers is equal to the value to buyers.b. the value to buyers is greater than the cost to sellers.c. the cost to sellers is greater than the value to buyers.d. producer surplus would be greater than consumer surplus.TYPE: M KEY1: D SECTION: 3 OBJECTIVE: 5 RANDOM: Y25. The “invisible hand” refers to thea. automatic maximization of consumer surplus in free markets.b. marketplace as a place where government looks out for the self-interests of individualparticipants in the market.c. equity that results from market forces allocating the goods produced in the market.d. marketplace guiding the self-interests of market participants into promoting general economicwell-being.economic well-being.TYPE: M KEY1: D SECTION: 3 OBJECTIVE: 5 RANDOM: Y1 ANSWER: d. how the allocation of resources affects economic well-being.TYPE: M KEY1: D OBJECTIVE: 1 RANDOM: YChapter 7/Consumers, Producers, and the Efficiency of Markets 75 2 ANSWER: c. maximizes the total benefits received by buyers and sellers.TYPE: M KEY1: D OBJECTIVE: 1 RANDOM: Y3 ANSWER: d. consumer surplus.TYPE: M KEY1: D SECTION: 1 OBJECTIVE: 2 RANDOM: N4 ANSWER: a. maximum amount that a buyer will pay for a good.TYPE: M KEY1: D SECTION: 1 OBJECTIVE: 1 RANDOM: Y5 ANSWER: c. consumer would not purchase the good and would not have any consumer surplus. TYPE: M KEY1: E SECTION: 1 OBJECTIVE: 1 RANDOM: Y6 ANSWER: d. $150.TYPE: M KEY1: E SECTION: 1 OBJECTIVE: 1 RANDOM: Y7 ANSWER: b. $300.TYPE: M KEY1: E SECTION: 1 OBJECTIVE: 2 RANDOM: Y8 ANSWER: c. amount a consumer is willing to pay less the amount the consumer actually pays. TYPE: M KEY1: D SECTION: 1 OBJECTIVE: 2 RANDOM: Y9 ANSWER: b. your consumer surplus is $0.TYPE: M KEY1: D SECTION: 1 OBJECTIVE: 2 RANDOM: Y10 ANSWER: c. decreases by an amount equal to B + C.TYPE: M KEY1: G SECTION: 1 OBJECTIVE: 2 GRAPH FORMAT: M RANDOM: N11 ANSWER: b. Value to buyers – Amount paid by buyers.TYPE: M KEY1: T SECTION: 1 OBJECTIVE: 2 INSTRUCTION: 1 RANDOM: N12 ANSWER: b. seller’s willingness to sell.TYPE: M KEY1: D SECTION: 2 OBJECTIVE: 3 RANDOM: Y13 ANSWER: a. amount a seller is paid less the cost of production.TYPE: M KEY1: D SECTION: 2 OBJECTIVE: 4 RANDOM: Y14 ANSWER: d. would leave the market first if the price were any lower.TYPE: M KEY1: D SECTION: 2 OBJECTIVE: 4 RANDOM: Y76 Chapter 7/Consumers, Producers, and the Efficiency of Markets15 ANSWER: b. below the price and above the supply curve.TYPE: M KEY1: D SECTION: 2 OBJECTIVE: 4 RANDOM: Y16 ANSWER: d. A + B + C.TYPE: M KEY1: G SECTION: 2 OBJECTIVE: 4 GRAPH FORMAT: M RANDOM: N17 ANSWER: b. decreases by an amount equal to A + B.TYPE: M KEY1: G SECTION: 2 OBJECTIVE: 4 GRAPH FORMAT: M RANDOM: N18 ANSWER: b. well-being of sellers.TYPE: M KEY1: D SECTION: 2 OBJECTIVE: 4 RANDOM: Y19 ANSWER: c. $300 per ton.TYPE: M KEY1: E SECTION: 2 OBJECTIVE: 4 RANDOM: Y20 ANSWER: a. $17.TYPE: M KEY1: E SECTION: 2 OBJECTIVE: 4 RANDOM: Y21 ANSWER: a. total surplus is maximized.TYPE: M KEY1: D SECTION: 3 OBJECTIVE: 5 RANDOM: Y22 ANSWER: b. Value to buyers - Costs of sellers.TYPE: M KEY1: D SECTION: 3 OBJECTIVE: 5 RANDOM: Y23 ANSWER: c. A + B + C + D + E + F.TYPE: M KEY1: G SECTION: 3 OBJECTIVE: 5 GRAPH FORMAT: M RANDOM: Y24 ANSWER: c. the cost to sellers is greater than the value to buyers.TYPE: M KEY1: D SECTION: 3 OBJECTIVE: 5 RANDOM: Y25 ANSWER: d. marketplace guiding the self-interests of market participants into promoting generaleconomic well-being.TYPE: M KEY1: D SECTION: 3 OBJECTIVE: 5 RANDOM: Y。
Chapter 10ExternalitiesTest A1. In the absence of externalities the invisible hand of the marketplacea. induces people to act in a manner inconsistent with self-interest.b. is unable to resolve inherent inefficiencies in the market system.c. leads to a market outcome that maximizes total benefit to society.d. increases the transactions cost of contracting between parties to an exchange. ANSWER: c. leads to a market outcome that maximizes total benefit to society.TYPE: M KEY1: D SECTION: 1 OBJECTIVE: 1 RANDOM: Y2. An externality exists whena. a firm sells its product in a foreign market.b. markets are not able to reach equilibrium.c. the government intercedes in the operation of private markets by forcing the market to adjust tothe balance of supply and demand.d. a person engages in an activity that influences the well-being of a bystander and yet neitherpays nor receives payment for that effect.ANSWER: d. a person engages in an activity that influences the well-being of a bystander and yet neither pays nor receives payment for that effect.TYPE: M KEY1: D SECTION: 1 OBJECTIVE: 1 RANDOM: Y3. When a production externality has a beneficial (or positive) effect on a bystander,society could benefit froma. an increase in the production of this product.b. a decrease in the production of this product.c. the government placing a Pigovian tax on this product.d. the government not interfering in the market for this product.ANSWER: a. an increase in the production of this product.TYPE: M KEY1: D SECTION: 1 OBJECTIVE: 2 RANDOM: Y4. An externality willa. cause markets to allocate resources efficiently.b. usually be characterized as a form of market failure.c. strengthen the role of the “invisible hand” in the marketplace.d. always require the producer to compensate society.ANSWER: b. usually be characterized as a form of market failure.TYPE: M KEY1: D SECTION: 1 OBJECTIVE: 1 RANDOM: Y110 ❖ Chapter 10/Externalities5. An optimal tax on pollution (a negative production externality) would be one in whicha. a benevolent social planner is able to maximize production.b. producers internalize the cost of the pollution.c. producers choose not to produce any pollution.d. the value to consumers at market equilibrium exceeds the cost of production (including tax). ANSWER: b. producers internalize the cost of the pollution.TYPE: M KEY1: D SECTION: 1 OBJECTIVE: 5 RANDOM: Y6. The figure reflects the presence of aa. negative consumption externality.b. positive consumption externality.c. negative production externality.d. positive production externality.ANSWER: c. negative production externality.TYPE: M KEY1: D SECTION: 1 OBJECTIVE: 2 RANDOM: Y7. According to the figure, which price and quantity combination represents the social optimum?a. P1,Q0.b. P3,Q0.c. P1,Q1.d. P2,Q1.ANSWER: d. P2,Q1.TYPE: M KEY1: D SECTION: 1 OBJECTIVE: 2 RANDOM: Y8. Internalizing a negative production externality will cause the supply curve faced by an industry toa. shift to the left.b. shift to the right.c. remain unchanged.d. shift either right or left, depending on the industry.ANSWER: a. shift to the left.TYPE: M KEY1: D SECTION: 1 OBJECTIVE: 1 RANDOM: YChapter 10/Externalities ❖ 111 9. To enhance the well-being of society, a social planner will encourage firms to increase productionwhena. there is excess supply in the market.b. the firms are producing basic goods.c. technology spillovers are associated with production.d. negative externalities associated with production are imposed only upon consumers. ANSWER: c. technology spillovers are associated with production.TYPE: M KEY1: D SECTION: 1 OBJECTIVE: 2 RANDOM: Y10. A positive production externality will cause a market to producea. a quantity that is socially desirable.b. more than is socially desirable.c. less than is socially desirable.d. more than is market optimal.ANSWER: c. less than is socially desirable.TYPE: M KEY1: D SECTION: 1 OBJECTIVE: 2 RANDOM: Y11. Internalizing a positive production externality through a government subsidy will cause industrysupply toa. remain unchanged.b. increase by an amount equal to the subsidy.c. increase by an amount less than the subsidy.d. decrease by an amount greater than the subsidy.ANSWER: b. increase by an amount equal to the subsidy.TYPE: M KEY1: D SECTION: 1 OBJECTIVE: 2 RANDOM: Y12. A positive consumption externality occurs whena. Jack’s consumption is not beneficial to John.b. Jack receives personal benefits from his own consumption of a certain good.c. Jack’s benefit exceeds John’s benefit when they e ach consume the same good.d. Jack receives a benefit from John’s consumption of a certain good.ANSWER: d. Jack receives a benefit from John’s consumption of a certain good.TYPE: M KEY1: D SECTION: 1 OBJECTIVE: 1 RANDOM: Y13. A negative consumption externality will cause a private market to producea. more than is socially desirable.b. less than is socially desirable.c. less than is market optimal.d. the socially desirable quantity.ANSWER: a. more than is socially desirable.TYPE: M KEY1: D SECTION: 1 OBJECTIVE: 2 RANDOM: Y112 ❖ Chapter 10/Externalities14. When dealing with externalities, the market equilibrium can be moved closer to the social equilibriumbya. taxing negative externalities and subsidizing positive externalities.b. taxing both positive and negative externalities.c. subsidizing both positive and negative externalities.d. None of the above, because government has no corrective policy with regards to consumptionexternalities.ANSWER: a. taxing negative externalities and subsidizing positive externalities.TYPE: M KEY1: D SECTION: 1 OBJECTIVE: 5 RANDOM: Y15. Firms that are involved in different types of business could be evidence of an attempt toa. increase private profit at the expense of consumers.b. internalize some forms of positive externalities.c. increase the marginal external cost of production.d. reduce the impact of government regulation on their business.ANSWER: b. internalize some forms of positive externalities.TYPE: M KEY1: D SECTION: 2 OBJECTIVE: 3 RANDOM: Y16. All remedies for externalities share the goal ofa. increasing the allocation of resources.b. decreasing the allocation of resources.c. moving the allocation of resources toward the market equilibrium.d. moving the allocation of resources toward the social optimum.ANSWER: d. moving the allocation of resources toward the social optimum.TYPE: M KEY1: D SECTION: 2 OBJECTIVE: 5 RANDOM: Y17. Dick owns a dog whose barking annoys Dick’s neighbor Jane. Suppose that the benefit of owningthe dog is worth $500 to Dick and that Jane bears a cost of $700 from the barking. Assuming Dick has the legal right to keep the dog, a possible private solution to this problem is thata. Jane pays Dick $650 to get rid of the dog.b. Dick pays Jane $650 for her inconvenience.c. Jane pays Dick $500 to get rid of the dog.d. There is no private solution that would improve this situation.ANSWER: a. Jane pays Dick $650 to get rid of the dog.TYPE: M KEY1: D SECTION: 2 OBJECTIVE: 3 RANDOM: Y18. Which of the following is true of the Coase theorem ?a. The bargain outcome will be inefficient.b. Interested parties can reach an outcome in which everyone is better off.c. Interested parties will need an arbitrator in order to reach an agreement that is efficient.d. Government intervention is necessary to solve the problem of externalities.ANSWER: b. Interested parties can reach an outcome in which everyone is better off.TYPE: M KEY1: D SECTION: 2 OBJECTIVE: 3 RANDOM: YChapter 10/Externalities ❖ 113 19. Employing a lawyer to draft and enforce a private contract between parties wishing to solve anexternality problem is an example ofa. a sunk cost.b. an implicit cost.c. a transaction cost.d. an opportunity cost.ANSWER: c. a transaction cost.TYPE: M KEY1: D SECTION: 2 OBJECTIVE: 4 RANDOM: Y20. Pigovian taxesa. are rarely preferred to direct regulation.b. are frequently used to discourage imports.c. encourage consumers to avoid sales taxes by shopping on-line.d. give factory owners an economic incentive to reduce pollution.ANSWER: d. give factory owners an economic incentive to reduce pollution.TYPE: M KEY1: D SECTION: 3 OBJECTIVE: 5 RANDOM: Y21. A Pigovian taxa. is a form of regulation.b. allocates pollution to those factories that face the highest cost of reducing it.c. works well for all types of externalities.d. is deemed inferior to regulatory policy by most economists.ANSWER: b. allocates pollution to those factories that face the highest cost of reducing it.TYPE: M KEY1: D SECTION: 3 OBJECTIVE: 5 RANDOM: Y114 ❖ Chapter 10/Externalities22. Which of the graphs best depicts the case of a negative production externality?a. Panel Ab. Panel Bc. Panel Cd. Panel DANSWER: d. Panel DTYPE: M KEY1: D SECTION: 1 OBJECTIVE: 2 RANDOM: Y23. In some cases, pollution permits may be better than a Pigovian tax becausea. the government can set a maximum level of pollution using permits.b. pollution permits allow for a market solution while a Pigovian tax does not.c. pollution permits are never preferred over a Pigovian tax.d. pollution permits generate more revenue for the government than a Pigovian tax. ANSWER: a. the government can set a maximum level of pollution using permits. TYPE: M KEY1: D SECTION: 3 OBJECTIVE: 5 RANDOM: YChapter 10/Externalities ❖ 11524. Which of the following is NOT true concerning tradable pollution permits?a. Tradable pollution permits are a scarce resource.b. Tradable pollution permits can be traded in a market governed by supply and demand.c. Tradable pollution permits eventually lead to an efficient elimination of all pollution.d. Tradable pollution permits will be sold by firms that can reduce pollution at low costs. ANSWER: c. Tradable pollution permits eventually lead to an efficient elimination of all pollution. TYPE: M KEY1: D SECTION: 3 OBJECTIVE: 5 RANDOM: Y25. Which of the following policies is government most inclined to use when faced with a positiveexternality?a. permitsb. taxationc. subsidiesd. usage feesANSWER: c. subsidiesTYPE: M KEY1: D SECTION: 3 OBJECTIVE: 5 RANDOM: Y1 ANSWER: c. leads to a market outcome that maximizes total benefit to society.TYPE: M KEY1: D SECTION: 1 OBJECTIVE: 1 RANDOM: Y2 ANSWER: d. a person engages in an activity that influences the well-being of a bystander and yetneither pays nor receives payment for that effect.TYPE: M KEY1: D SECTION: 1 OBJECTIVE: 1 RANDOM: Y3 ANSWER: a. an increase in the production of this product.TYPE: M KEY1: D SECTION: 1 OBJECTIVE: 2 RANDOM: Y4 ANSWER: b. usually be characterized as a form of market failure.TYPE: M KEY1: D SECTION: 1 OBJECTIVE: 1 RANDOM: Y5 ANSWER: b. producers internalize the cost of the pollution.TYPE: M KEY1: D SECTION: 1 OBJECTIVE: 5 RANDOM: Y6 ANSWER: c. negative production externality.TYPE: M KEY1: D SECTION: 1 OBJECTIVE: 2 RANDOM: Y7 ANSWER: d. P2, Q1.TYPE: M KEY1: D SECTION: 1 OBJECTIVE: 2 RANDOM: Y8 ANSWER: a. shift to the left.TYPE: M KEY1: D SECTION: 1 OBJECTIVE: 1 RANDOM: Y116 ❖ Chapter 10/Externalities9 ANSWER: c. technology spillovers are associated with production.TYPE: M KEY1: D SECTION: 1 OBJECTIVE: 2 RANDOM: Y10 ANSWER: c. less than is socially desirable.TYPE: M KEY1: D SECTION: 1 OBJECTIVE: 2 RANDOM: Y11 ANSWER: b. increase by an amount equal to the subsidy.TYPE: M KEY1: D SECTION: 1 OBJECTIVE: 2 RANDOM: Y12 ANSWER: d. Jack receives a benefit from John’s consumption of a certain good. TYPE: M KEY1: D SECTION: 1 OBJECTIVE: 1 RANDOM: Y13 ANSWER: a. more than is socially desirable.TYPE: M KEY1: D SECTION: 1 OBJECTIVE: 2 RANDOM: Y14 ANSWER: a. taxing negative externalities and subsidizing positive externalities. TYPE: M KEY1: D SECTION: 1 OBJECTIVE: 5 RANDOM: Y15 ANSWER: b. internalize some forms of positive externalities.TYPE: M KEY1: D SECTION: 2 OBJECTIVE: 3 RANDOM: Y16 ANSWER: d. moving the allocation of resources toward the social optimum. TYPE: M KEY1: D SECTION: 2 OBJECTIVE: 5 RANDOM: Y17 ANSWER: a. Jane pays Dick $650 to get rid of the dog.TYPE: M KEY1: D SECTION: 2 OBJECTIVE: 3 RANDOM: Y18 ANSWER: b. Interested parties can reach an outcome in which everyone is better off. TYPE: M KEY1: D SECTION: 2 OBJECTIVE: 3 RANDOM: Y19 ANSWER: c. a transaction cost.TYPE: M KEY1: D SECTION: 2 OBJECTIVE: 4 RANDOM: Y20 ANSWER: d. give factory owners an economic incentive to reduce pollution. TYPE: M KEY1: D SECTION: 3 OBJECTIVE: 5 RANDOM: YChapter 10/Externalities ❖ 117 21 ANSWER: b. allocates pollution to those factories that face the highest cost of reducing it. TYPE: M KEY1: D SECTION: 3 OBJECTIVE: 5 RANDOM: Y22 ANSWER: d. Panel DTYPE: M KEY1: D SECTION: 1 OBJECTIVE: 2 RANDOM: Y23 ANSWER: a. the government can set a maximum level of pollution using permits.TYPE: M KEY1: D SECTION: 3 OBJECTIVE: 5 RANDOM: Y24 ANSWER: c. Tradable pollution permits eventually lead to an efficient elimination of all pollution. TYPE: M KEY1: D SECTION: 3 OBJECTIVE: 5 RANDOM: Y25 ANSWER: c. subsidiesTYPE: M KEY1: D SECTION: 3 OBJECTIVE: 5 RANDOM: Y。
曼昆《经济学原理(微观经济学分册)》(第6版)第9章应用:国际贸易课后习题详解跨考网独家整理最全经济学考研真题,经济学考研课后习题解析资料库,您可以在这里查阅历年经济学考研真题,经济学考研课后习题,经济学考研参考书等内容,更有跨考考研历年辅导的经济学学哥学姐的经济学考研经验,从前辈中获得的经验对初学者来说是宝贵的财富,这或许能帮你少走弯路,躲开一些陷阱。
以下内容为跨考网独家整理,如您还需更多考研资料,可选择经济学一对一在线咨询进行咨询。
一、概念题1.世界价格(world price)答:世界价格也称世界市场价格,指一种物品在世界市场上交易的价格。
世界价格是由商品的国际价值决定的。
国际价值是世界市场商品交换的惟一依据,各国商品的国别价值都必须还原为国际价值,以便在国际市场上交换。
而各国商品的国别价值在多大程度上表现为国际价值,是与各国的经济技术水平、劳动强度和劳动生产率密切相关的。
一般来说,一国的经济技术水平和劳动生产率越高,其商品价值就越低于国际商品价值,若按照国际商品价值出售,就能获得较好的经济效益;相反则会在竞争中处于不利的地位。
2.关税(tariff)答:关税是指对在国外生产而在国内销售的物品征收的税。
与其他税收相比,关税有两个主要特点:第一,关税的征收对象是进出境的货物和物品;第二,关税具有涉外性,是对外贸易政策的重要手段。
征收关税的作用主要有两个方面:一是增加本国财政收入;二是保护本国的产业和国内市场。
其中以前者为目的而征收的关税称为财政关税,以后者为目的而征收的关税称为保护关税。
与任何一种物品销售税一样,关税会扭曲激励,使得稀缺资源的配置背离最优水平,使市场接近于没有贸易时的均衡,因此,减少了贸易的好处。
关税虽然使国内生产者的状况变好,而且政府增加了收入,但造成消费者的损失大于获得的这些好处。
关税造成的无谓损失具体表现为:第一,关税使国内生产者能收取的价格高于世界价格,结果,鼓励他们增加低效率地生产。
第一篇导言第一章经济学十大原理复习题1.列举三个你在生活中面临的重要权衡取舍的例子。
答:①大学毕业后,面临着是否继续深造的选择,选择继续上学攻读研究生学位,就意味着在今后三年中放弃参加工作、赚工资和积累社会经验的机会;②在学习内容上也面临着很重要的权衡取舍,如果学习《经济学》,就要减少学习英语或其他专业课的时间;③对于不多的生活费的分配同样面临权衡取舍,要多买书,就要减少在吃饭、买衣服等其他方面的开支。
2.看一场电影的机会成本是什么?答:看一场电影的机会成本是在看电影的时间里做其他事情所能获得的最大收益,例如:看书、打零工。
8.为什么生产率是重要的?答:因为一国的生活水平取决于它生产物品与劳务的能力,而对这种能力的最重要的衡量度就是生产率。
生产率越高,一国生产的物品与劳务量就越多。
9.什么是通货膨胀,什么引起了通货膨胀?答:通货膨胀是流通中货币量的增加而造成的货币贬值,由此产生经济生活中价格总水平上升。
货币量增长引起了通货膨胀。
10.短期中通货膨胀与失业如何相关?答:短期中通货膨胀与失业之间存在着权衡取舍,这是由于某些价格调整缓慢造成的。
政府为了抑制通货膨胀会减少流通中的货币量,人们可用于支出的货币数量减少了,但是商品价格在短期内是粘性的,仍居高不下,于是社会消费的商品和劳务量减少,消费量减少又引起企业解雇工人。
在短期内,对通货膨胀的抑制增加了失业量。
问题与应用3.你正计划用星期六去从事业余工作,但一个朋友请你去滑雪。
去滑雪的真实成本是什么?现在假设你已计划这天在图书馆学习,这种情况下去滑雪的成本是什么?并解释之。
答:去滑雪的真实成本是周六打工所能赚到的工资,我本可以利用这段时间去工作。
如果我本计划这天在图书馆学习,那么去滑雪的成本是在这段时间里我可以获得的知识。
5.你管理的公司在开发一种新产品过程中已经投资500万美元,但开发工作还远远没有完成。
在最近的一次会议上,你的销售人员报告说,竞争性产品的进入使你们新产品的预期销售额减少为300万美元。
曼昆经济学原理试题及答案一、名词解释(每小题5分,共50分)机会成本科斯定理搭便车囚徒困境菲利普斯曲线供给侧凯恩斯革命看不见的手比较优势外部性二、简述题(第11、12、13题各12分,14题14分,共50分)1.简要描述银行存款的创建过程。
2.简述失业的根源及其类型。
3.简要描述节俭的对与错。
4.根据有关经济学原理,简析我国森林减少、珍稀动物来绝的原因及解决的措施。
三、论述题(每小题25分,共计50分)1.讨论人民币升值对中国经济的影响。
2.论述政府公共投资对国民经济的作用。
一、名词解释(每个子话题5分,共50分)1.机会成本:指人们利用一定资源获得某种收入时所放弃的在其他可能的用途中所能够获取的最大收入。
生产一单位的某种商品的机会成本是指生产者所放弃的使用相同的生产要素在其他生产用途中所能得到的最高收入。
机会成本的存在需要三个前提条件。
第一,资源是稀缺的;第二,资源具有多种生产用途;第三,资源的投无限制访问。
在从机会成本的角度审视生产过程时,制造商需要将生产要素投入到效益最大的项目中,以避免生产浪费,实现资源的最优配置。
机会成本的概念是基于资源的稀缺性。
在经济资源稀缺的前提下,当一个社会或企业利用一定的经济资源生产一定数量的一种或几种产品时,这些经济资源不能同时用于其他生产用途。
也就是说,这个社会或这个企业能够获得的一定数量的产品收入,是以放弃利用同样的经济资源生产其他产品所能获得的收入为代价的。
这也是机会成本的原因。
因此,一个社会生产一种产品的实际成本是它不能生产其他产品的成本。
因此,机会成本的含义是,任何生产资源或生产要素一般都有各种不同的方式或机会,也就是说,它可以用于生产各种产品。
然而,当一定数量的特定资源用于生产a类产品时,它们不能同时用于生产B类产品。
因此,生产一种产品的实际成本是不生产B产品的成本,或者等于这种资源生产B产品可能获得的最大回报。
如果一种资源决定用于一种产品,就牺牲了生产其他产品的机会;生产a级产品的收入来源于不从事或放弃生产其他产品的机会。
Chapter 3Interdependence and the Gains from Trade Test A1. A country’s consumption possibilities frontier can be outside its production possibilities frontiera. with trade.b. by allocating resources differently.c. by lowering unemployment in the country.d. by producing a greater variety of goods and services.2. If labor in Mexico is less productive than labor in the United States in all areas of production,a. neither nation can benefit from trade.b. Mexico can benefit from trade but the United States cannot.c. both nations can benefit from trade.d. Mexico will not have a comparative advantage in any good.22 Chapter 3/Interdependence and the Gains from Trade3. Refer to the table shown. For the Farmer, the opportunity cost of 1 pound of meat isa. 1/2 pound of potatoesb. 2 pounds of potatoes.c. 4 hours of labor.d. 8 hours of labor.4. Refer to the table shown. For the Rancher, the opportunity cost of 1 pound of meat isa. 1 hour of labor.b. 5 hours of labor.c. 4 pounds of potatoes.d. 1/4 pound of potatoes.5. Refer to the table shown. For the Farmer, the opportunity cost of 1 pound of potatoes isa. 1/2 pound of meat.b. 2 pounds of meat.c. 4 hours of labor.d. 8 hours of labor.6. Refer to the table shown. For the Rancher, the opportunity cost of 1 pound of potatoes isa. 4 hours of labor.b. 2 hours of labor.c. 4 pounds of meat.d. 1/4 pound of meat.7. Refer to the table shown. The Farmer has an absolute advantage in ______ and the Rancher has anabsolute advantage in ______.a. meat, meatb. meat, potatoesc. potatoes, meatd. neither good, both goods8. Refer to the table shown. The Rancher has a comparative advantage in ______ and the Farmer has acomparative advantage in ______.a. meat, potatoesb. both goods, neither goodc. potatoes, meatd. neither good, both goods9. Refer to the table shown. The Farmer and Rancher both could benefit by the Farmer specializing in______ and the Rancher specializing in ______.a. potatoes, meatb. meat, potatoesc. neither good, meatd. They cannot benefit by specialization and trade.Chapter 3/Interdependence and the Gains from Trade 23 These figures illustrate the production possibilities available to Tom and Nicole with 40 hours of labor.10. Refer to the graphs shown. The opportunity cost of 1 video for Tom isa. 1/2 book.b. 1 book.c. 2 books.d. 4 books.11. Refer to the graphs shown. The opportunity cost of 1 video for Nicole isa. 1/40 book.b. 1/8 book.c. 8 books.d. 40 books.RANDOM: N12. Refer to the graphs shown. The opportunity cost of 1 book for Nicole isa. 1/40 video.b. 1/8 video.c. 5 videos.d. 8 videos.TYPE: M KEY1: G SECTION: 2 OBJECTIVE: 3 GRAPH FORMAT: M QUESTION INSTRUCTION: 4 RANDOM: N13. Refer to the graphs shown. The opportunity cost of 1 book for Tom isa. 1/4 video.b. 1/2 video.c. 2 videos.d. 4 videos.TYPE: M KEY1: G SECTION: 2 OBJECTIVE: 3 GRAPH FORMAT: M QUESTION INSTRUCTION: 4 RANDOM: N24 Chapter 3/Interdependence and the Gains from Trade14. Refer to the graphs shown. Nicole has an absolute advantage in ______ and Tom has an absoluteadvantage in ______.a. books, videosb. videos, booksc. both goods, neither goodd. neither good, both goodsTYPE: M KEY1: G SECTION: 2 OBJECTIVE: 3 GRAPH FORMAT: M QUESTION INSTRUCTION: 4 RANDOM: N15. Refer to the graphs shown. Nicole has a comparative advantage in ______ and Tom has acomparative advantage in ______.a. books, videosb. both goods, neither goodc. videos, booksd. neither good, booksTYPE: M KEY1: G SECTION: 2 OBJECTIVE: 3 GRAPH FORMAT: M QUESTION INSTRUCTION: 4 RANDOM: N16. Refer to the graphs shown. Nicole should specialize in ______ and Tom should specialize in ______.a. videos, booksb. books, videosc. both goods, videosd. books, neither goodTYPE: M KEY1: G SECTION: 2 OBJECTIVE: 3 GRAPH FORMAT: M QUESTION INSTRUCTION: 4 RANDOM: N17. Refer to the graphs shown. If Tom and Nicole both specialize in the good in which they have acomparative advantage, total production of books will be ______ and total production of videos will be ______.a. 42, 9b. 40, 4c. 4, 40d. 9, 42TYPE: M KEY1: G SECTION: 2 OBJECTIVE: 3 GRAPH FORMAT: M QUESTION INSTRUCTION: 4 RANDOM: N18. Comparative advantage is based ona. capital costs.b. labor costs.c. dollar price.d. opportunity costs.TYPE: M KEY1: D SECTION: 2 OBJECTIVE: 3 RANDOM: Y19. Absolute advantage is found bya. comparing opportunity costs.b. calculating the dollar cost of production.c. first determining which country has a comparative advantage.d. comparing the productivity of one nation to that of another.TYPE: MKEY1: D SECTION: 2 OBJECTIVE: 3 RANDOM: YChapter 3/Interdependence and the Gains from Trade 2520. The principle of comparative advantage was developed bya. Adam Smith.b. Harry Truman.c. David Ricardo.d. John Maynard Keynes.TYPE: M KEY1: D SECTION: 3 OBJECTIVE: 4 RANDOM: Y21. Economists generally supporta. government management of trade.b. free international trade.c. trade restrictions.d. export subsidies.TYPE: M KEY1: D SECTION: 3 OBJECTIVE: 4 RANDOM: Y22. Karl Malone (1997 NBA MVP) is a better basketball player and truck driver than Gregory Mankiw(the author of your economics text). Which of the following is true?a. Karl Malone and Gregory Mankiw may benefit from trade.b. Karl Malone would be better off playing basketball and driving his own truck.c. Karl Malone will probably have a comparative advantage in both goods.d. Karl Malone will have a lower opportunity cost of playing basketball and truck driving thanwill Gregory Mankiw.TYPE: M KEY1: D SECTION: 3 OBJECTIVE: 4 RANDOM: Y23. Exports area. a limit placed on the quantity of goods brought into a country.b. goods produced domestically and sold abroad.c. usually a country’s least desirable product.d. goods produced abroad and sold domestically.TYPE: M KEY1: T SECTION: 3 OBJECTIVE: 4RANDOM: Y24. The United States could benefit bya. promoting imports and restricting exports.b. restricting imports and promoting exports.c. restricting both imports and exports.d. not restricting trade.TYPE: M KEY1: D SECTION: 3 OBJECTIVE: 4 RANDOM: Y25. The gains from trade area. higher from trade between a rich nation and a poor nation.b. a result of more efficient resource allocation.c. based on different wage rates between nations.d. based on the principle of absolute advantage.TYPE: M KEY1: D SECTION: 3 OBJECTIVE: 4 RANDOM: Y1 ANSWER: a. with trade.TYPE: M KEY1: D SECTION: 1 OBJECTIVE: 1 RANDOM: Y2 ANSWER: c. both nations can benefit from trade.TYPE: M KEY1: D SECTION: 2 OBJECTIVE: 1 RANDOM: Y26 Chapter 3/Interdependence and the Gains from Trade3 ANSWER: b. 2 pounds of potatoes.TYPE: M KEY1: T SECTION: 2 OBJECTIVE: 2 INSTRUCTION: 1 RANDOM: Y4 ANSWER: c. 4 pounds of potatoes.TYPE: M KEY1: T SECTION: 2 OBJECTIVE: 2 INSTRUCTION: 1 RANDOM: Y5 ANSWER: a. 1/2 pound of meat.TYPE: M KEY1: T SECTION: 2 OBJECTIVE: 2 INSTRUCTION: 1 RANDOM: Y6 ANSWER: d. 1/4 pound of meat.TYPE: M KEY1: T SECTION: 2 OBJECTIVE: 2 INSTRUCTION: 1 RANDOM: Y7 ANSWER: d. neither good, both goodsTYPE: M KEY1: T SECTION: 2 OBJECTIVE: 2 INSTRUCTION: 1 RANDOM: Y8 ANSWER: c. potatoes, meatTYPE: M KEY1: T SECTION: 2 OBJECTIVE: 2 INSTRUCTION: 1 RANDOM: Y9 ANSWER: b. meat, potatoesTYPE: M KEY1: T SECTION: 2 OBJECTIVE: 3 INSTRUCTION: 1 RANDOM: Y10 ANSWER: a. 1/2 book.TYPE: M KEY1: G SECTION: 2 OBJECTIVE: 3 GRAPH FORMAT: M QUESTION INSTRUCTION: 4 RANDOM: N11 ANSWER: c. 8 books.TYPE: M KEY1: G SECTION: 2 OBJECTIVE: 3 GRAPH FORMAT: M QUESTION INSTRUCTION: 4 RANDOM: N12 ANSWER: b. 1/8 video.TYPE: M KEY1: G SECTION: 2 OBJECTIVE: 3 GRAPH FORMAT: M QUESTION INSTRUCTION: 4 RANDOM: N13 ANSWER: c. 2 videosTYPE: M KEY1: G SECTION: 2 OBJECTIVE: 3 GRAPH FORMAT: M QUESTION INSTRUCTION: 4 RANDOM: NChapter 3/Interdependence and the Gains from Trade 27 14 ANSWER: c. both goods, neither goodTYPE: M KEY1: G SECTION: 2 OBJECTIVE: 3 GRAPH FORMAT: M QUESTION INSTRUCTION: 4 RANDOM: N15 ANSWER: a. books, videosTYPE: M KEY1: G SECTION: 2 OBJECTIVE: 3 GRAPH FORMAT: M QUESTION INSTRUCTION: 4 RANDOM: N16 ANSWER: b. books, videosTYPE: M KEY1: G SECTION: 2 OBJECTIVE: 3 GRAPH FORMAT: M QUESTION INSTRUCTION: 4 RANDOM: N17 ANSWER: b. 40, 4TYPE: M KEY1: G SECTION: 2 OBJECTIVE: 3 GRAPH FORMAT: M QUESTION INSTRUCTION: 4 RANDOM: N18 ANSWER: d. opportunity costs.TYPE: M KEY1: D SECTION: 2 OBJECTIVE: 3 RANDOM: Y19 ANSWER: d. comparing the productivity of one nation to that of another.TYPE: MKEY1: D SECTION: 2 OBJECTIVE: 3 RANDOM: Y20 ANSWER: c. David Ricardo.TYPE: M KEY1: D SECTION: 3 OBJECTIVE: 4 RANDOM: Y21 ANSWER: b. free international trade.TYPE: M KEY1: D SECTION: 3 OBJECTIVE: 4 RANDOM: Y22 ANSWER: a. Karl Malone and Gregory Mankiw may benefit from trade.TYPE: M KEY1: D SECTION: 3 OBJECTIVE: 4 RANDOM: Y23 ANSWER: b. goods produced domestically and sold abroad.TYPE: M KEY1: T SECTION: 3 OBJECTIVE: 4RANDOM: Y24 ANSWER: d. not restricting trade.TYPE: M KEY1: D SECTION: 3 OBJECTIVE: 4 RANDOM: Y25 ANSWER: b. a result of more efficient resource allocation.TYPE: M KEY1: D SECTION: 3 OBJECTIVE: 4 RANDOM: Y28 Chapter 3/Interdependence and the Gains from Trade。
经济学原理(曼昆)第七版--第9章应用:国际贸易多选题答案(★)第一篇:经济学原理(曼昆)第七版--第9章应用:国际贸易多选题答案第9章应用:国际贸易快速多选:1.如果一个不允许钢铁进行国际贸易的国家的国内价格低于世界价格,那么:A.该国在生产钢铁中有比较优势,如果开放贸易会成为钢铁出口国。
B.该国在生产钢铁中有比较优势,如果开放贸易会成为钢铁进口国。
C.该国在生产钢铁中没有比较优势,如果开放贸易会成为钢铁出口国。
D.该国在生产钢铁中没有比较优势,如果开放贸易会成为钢铁进口国。
【答案】A 【解析】由于该国的国内钢铁价格低于世界价格,说明该国在生产钢铁上具有比较优势,因此该国将成为出口国。
2.当Ectenia国在咖啡豆方面对世界开放贸易时,国内咖啡豆价格下降。
以下哪一个选项说明了这种情况?A.国内咖啡产量增加,而且Ectenia变成了咖啡进口国。
B.国内咖啡产量增加,而且Ectenia变成了咖啡出口国。
C.国内咖啡产量减少,而且Ectenia变成了咖啡进口国。
D.国内咖啡产量减少,而且Ectenia变成了咖啡出口国。
【答案】C 【解析】首先,由国内咖啡豆价格下降知,贸易使得Ectenia过总供给增加(国内市场上,总供给>总需求),则该国为咖啡豆的进口国。
由一国允许贸易并成为一种物品的进口者时,该物品消费者的状况变好了知,该国是咖啡的进口国。
并且,大量进口导致国内咖啡产业受冲击,国内该物品的生产者状况变坏了。
此题也可以用排除法。
3.当一国开放一种产品的贸易并成为一个进口国时,将带来哪种结果?A.生产者剩余减少,但消费者剩余和总剩余增加。
B.生产者剩余减少,消费者剩余增加,而进口对总剩余的影响不确定。
C.生产者剩余和总剩余都增加,但消费者剩余减少。
D.生产者剩余、消费者剩余和总剩余都增加。
【答案】A 【解析】由书上结果知,当一国开放一种产品的贸易并成为一个进口国时,消费者剩余增加,生产者剩余减少,总剩余增加。
二十三章1下列每种交易会影响CDP的哪一部分(如果有影响的话)?并解释之。
A.家庭购买了一台新冰箱。
答:家庭购买了一台新冰箱会增加GDP 中的消费(C)部分,因为家庭用于家用电器的支出计算在消费的耐用品类中。
B.杰妮姑妈买了一所新房子。
答:杰妮姑妈买了一所新房子会增加GDP 中的投资(1)部分,因为家庭住宅能长期供人居住,提供服务。
它比一般耐用消费品的使用寿命更长,因此把住宅房屋的投资计算在投资中。
C.福特汽车公司由其存货中出售了一部雷鸟牌汽车。
答:福利汽车公司由其存货中出售了一部雷鸟牌汽车会减少现期GDP 中的投资,因为销售中间物品存货时,企业的存货投资是负的,因而减少了当期的GDP。
C.你买了一个比萨饼。
答:我买了一个比萨饼会增加GDP 中的消费(C),因为我用于购买食品的支出计算在消费的非耐用品类中。
D.加利福尼亚重新铺设了101 号高速公路。
答:加利福尼亚重新铺设了101 号高速公路增加了GDP中的政府购买(G),因为修建高速公路是政府的行为。
E.你的父母购买了一瓶法国红酒。
答:我的父母购买了一瓶法国红酒会减少GDP中的净出口(NX),因为法国红酒是进口食品,它的购买增加了美国的进口。
F.本田公司扩大其在俄亥俄州马利斯维尔的工厂。
答:本田公司扩大其在俄亥俄州马利斯维尔的工厂增加了GDP中的净出口(NX),因为本田公司是一家日本企业,它在美国的投资减少了美国对日本本田汽车的进口,使NX 增加2.GDP组成部分中的“政府购买”并不包括用于社会保障这类转移支付的支出。
想想GDP 的定义,解释为什么转移支付不包括在政府购买内?答:因为转移支付并不是要交换现在生产的物品或劳务,从宏观经济的角度看,转移支付就像税收和回扣一样。
转移支付和税收一样改变了家庭收入,但并没有反映经济的生产。
由于GDP 是要衡量在某一既定时期一个国家从物品与劳务的生产中得到的收入,所以,不把转移支付包括在政府购买内。
6.考虑以下美国GDP的数据:A.1996 年到1997 年间名义收入增长率是多少?(注意:增长率是一个时期到下一个时期百分比的变动。
Chapter 9Application: International TradeTest A1. When the United States engages in international trade with China,a. it is an equal tradeoff so neither country benefits nor loses.b. China reaps economic benefits and the United States loses.c. both China and the United States reap economic benefits.d. China loses and the United States reaps economic benefits.ANSWER: c. both China and the United States reap economic benefits.TYPE: M KEY1: C OBJECTIVE: 1 RANDOM: Y2. Countries usually impose restrictions on free foreign trade to protecta. domestic consumers.b. foreign consumers.c. foreign producers.d. domestic producers.ANSWER: d. domestic producers.TYPE: M KEY1: D SECTION: 1 OBJECTIVE: 1 RANDOM: Y3. If a country allows trade and the domestic price of a good is higher than the world price,a. the country will become an importer of the good.b. the country will become an exporter of the good.c. the country will neither export nor import the good.d. additional information about demand is needed to determine whether the country will export orimport the good.ANSWER: a. the country will become an importer of the good.TYPE: M KEY1: C SECTION: 1 OBJECTIVE: 1 RANDOM: Y4. A country has a comparative advantage in a product if the world price isa. equal to its domestic price.b. higher than its domestic price.c. lower than its domestic price.d. There is no way to tell by comparing the world price with the domestic price.ANSWER: b. higher than its domestic price.TYPE: M KEY1: D SECTION: 1 OBJECTIVE: 1 RANDOM: Y5. When a country allows trade and becomes an exporter of a good,a. both domestic producers and domestic consumers are better off.b. both domestic producers and domestic consumers are worse off.c. domestic producers are better off, and domestic consumers are worse off.d. domestic producers are worse off, and domestic consumers are better off.ANSWER: c. domestic producers are better off, and domestic consumers are worse off.TYPE: M KEY1: D SECTION: 2 OBJECTIVE: 2 RANDOM: Y96 ❖ Chapter 9/Application: International Trade6. When a country allows trade and becomes an importer of a good,a. everyone in the country benefits.b. everyone in the country loses.c. the losses of the losers exceed the gains of the winners.d. the gains of the winners exceed the losses of the losers.ANSWER: d. the gains of the winners exceed the losses of the losers.TYPE: M KEY1: D SECTION: 2 OBJECTIVE: 2 RANDOM: Y7. When a country allows free trade,a. the domestic price will equal the world price.b. the domestic price will be lower than the world price.c. the domestic price will be greater than the world price.d. it does not matter what the world price is, the domestic price is the prevailing price. ANSWER: a. the domestic price will equal the world price.TYPE: M KEY1: D SECTION: 2 OBJECTIVE: 2 RANDOM: YThe before-trade domestic price of pineapple in the United States is $500 per ton. The world price of pineapple is $600 per ton. The United States is a price-taker in the pineapple market.8. According to this scenario, if trade in pineapple is allowed, the price of pineapple in the United Statesa. will decrease.b. will increase.c. will be unaffected.d. could increase or decrease.ANSWER: b. will increase.TYPE: M KEY1: T SECTION: 2 OBJECTIVE: 2 INSTRUCTION: 4 RANDOM: Y9. According to this scenario, if trade in pineapple is allowed, total well-being in the United Statesa. will decrease.b. will increase.c. will be unaffected.d. could increase or decrease.ANSWER: b. will increase.TYPE: M KEY1: T SECTION: 2 OBJECTIVE: 2 INSTRUCTION: 4 RANDOM: YChapter 9/Application: International Trade ❖ 9710. According to the graph, Argentina woulda. export Q3– Q1 saddles.b. export Q2– Q1 saddles.c. import Q3– Q1 saddles.d. import Q3– Q2 saddles.ANSWER: a. export Q3– Q1 saddles.TYPE: M KEY1: G SECTION: 2 OBJECTIVE: 3 GRAPH FORMAT: M QUESTION GRAPH: INSTRUCTION: 8 RANDOM: Y11. According to the graph, consumer surplus in Argentina after trade is equal toa. A.b. C.c. A + B.d. A + B + D.ANSWER: a. A.TYPE: M KEY1: G SECTION: 2 OBJECTIVE: 3 GRAPH FORMAT: M QUESTION GRAPH: INSTRUCTION: 8 RANDOM: Y12. According to the graph, the change in total surplus in Argentina because of trade is equal toa. F.b. A + B.c. B + D.d. D + E.ANSWER: a. F.TYPE: M KEY1: G SECTION: 2 OBJECTIVE: 3 GRAPH FORMAT: M QUESTION GRAPH: INSTRUCTION: 8 RANDOM: Y98 ❖ Chapter 9/Application: International Trade13. According to the graph, Spain woulda. export Q3 – Q1 barrels of oil.b. export Q2 – Q1 barrels of oil.c. import Q3– Q1 barrels of oil.d. import Q3– Q2 barrels of oil.ANSWER: c. import Q3– Q1 barrels of oil.TYPE: M KEY1: G SECTION: 2 OBJECTIVE: 3 GRAPH FORMAT: M QUESTION GRAPH: INSTRUCTION: 1 RANDOM: Y14. According to the graph, producer surplus in Spain after trade would be equal toa. C.b. C + B.c. A + B + C.d. B + C + D + E.ANSWER: a. C.TYPE: M KEY1: G SECTION: 2 OBJECTIVE: 3 GRAPH FORMAT: M QUESTION GRAPH: INSTRUCTION: 1 RANDOM: N15. According to the graph, producer surplus plus consumer surplus in Spain after trade is equal toa. A + B.b. A + B + C.c. B + C + D.d. A + B + C + D + E.ANSWER: d. A + B + C + D + E.TYPE: M KEY1: G SECTION: 2 OBJECTIVE: 3 GRAPH FORMAT: M QUESTION GRAPH: INSTRUCTION: 1 RANDOM: NChapter 9/Application: International Trade ❖ 9916. A tariff on a product makes domestic sellersa. better off and domestic buyers better off.b. worse off and domestic buyers better off.c. better off and domestic buyers worse off.d. worse off and domestic buyers worse off.ANSWER: c. better off and domestic buyers worse off.TYPE: M KEY1: D SECTION: 2 OBJECTIVE: 4 RANDOM: YThe United States is an importer of down pillows. The world price of these pillows is $25. The United States imposes a $10 tariff on pillows. The United States is a price-taker in the pillow market.17. As a result of the tariff the U.S. price of pillows will bea. $25 and the quantity of pillows purchased will increase.b. $35 and the quantity of pillows purchased will increase.c. $25 and the quantity of pillows purchased will decrease.d. $35 and the quantity of pillows purchased will decrease.ANSWER: d. $35 and the quantity of pillows purchased will decrease.TYPE: M KEY1: E SECTION: 2 OBJECTIVE: 4 INSTRUCTION: 2 RANDOM: N18. In the figure shown, consumer surplus after the tariff would be equal toa. A.b. A + B.c. A + C + G.d. A + B + C + D +E + F.ANSWER: b. A + B.TYPE: M KEY1: G SECTION: 2 OBJECTIVE: 4 GRAPH FORMAT: M QUESTION GRAPH: RANDOM: Y19. In the figure shown, as a result of the tariff, government tariff revenue would be equal toa. B.b. E.c. D + F.d. B + D + E + F.ANSWER: b. E.TYPE: M KEY1: G SECTION: 2 OBJECTIVE: 4 GRAPH FORMAT: M QUESTION GRAPH: RANDOM: Y100 ❖ Chapter 9/Application: International Trade20. When a quota is imposed on a market thea. supply curve (above the world price) shifts to the left by the amount of the quota.b. supply curve (above the world price) shifts to the right by the amount of the quota.c. demand curve (above the world price) shifts to the right by the amount of the quota.d. demand curve (above the world price) shifts to the left by the amount of the quota. ANSWER: b. supply curve (above the world price) shifts to the right by the amount of the quota. TYPE: M KEY1: D SECTION: 2 OBJECTIVE: 4 RANDOM: Y21. A tariff and an import quota will botha. increase the quantity of imports and raise domestic price.b. increase the quantity of imports and lower domestic price.c. reduce the quantity of imports and lower domestic price.d. reduce the quantity of imports and raise domestic price.ANSWER: d. reduce the quantity of imports and raise domestic price.TYPE: M KEY1: D SECTION: 2 OBJECTIVE: 4 RANDOM: Y22. In the figure shown, after the quota, imports would be equal toa. Q4 minus Q1.b. Q3 minus Q2.c. Q3 minus Q2.d. Q2 minus Q1.ANSWER: b. Q3 minus Q2.TYPE: M KEY1: G SECTION: 2 OBJECTIVE: 4 GRAPH FORMAT: M QUESTION GRAPH: RANDOM: Y23. In the figure shown, after the quota, deadweight loss would be equal toa. B.b. E.c. D + F.d. B + D + E + F.ANSWER: c. D + F.TYPE: M KEY1: G SECTION: 2 OBJECTIVE: 4 GRAPH FORMAT: M QUESTION GRAPH: RANDOM: YChapter 9/Application: International Trade ❖ 10124. Which of the following is NOT an argument for restricting trade?a. the jobs argumentb. the efficiency argumentc. the infant-industry argumentd. the national security argumentANSWER: b. the efficiency argumentTYPE: M KEY1: D SECTION: 3 OBJECTIVE: 5 RANDOM: Y25. The North American Free Trade Agreementa. increased trade restrictions among Canada, Mexico and the United States.b. reduced trade restrictions among Canada, Mexico and the United States.c. eliminated tariffs on imports to North America from the rest of the world.d. reduced trade restrictions among European countries.ANSWER: b. reduced trade restrictions among Canada, Mexico and the United States.TYPE: M KEY1: D SECTION: 3 OBJECTIVE: 5 RANDOM: Y1 ANSWER: c. both China and the United States reap economic benefits.TYPE: M KEY1: C OBJECTIVE: 1 RANDOM: Y2 ANSWER: d. domestic producers.TYPE: M KEY1: D SECTION: 1 OBJECTIVE: 1 RANDOM: Y3 ANSWER: a. the country will become an importer of the good.TYPE: M KEY1: C SECTION: 1 OBJECTIVE: 1 RANDOM: Y4 ANSWER: b. higher than its domestic price.TYPE: M KEY1: D SECTION: 1 OBJECTIVE: 1 RANDOM: Y5 ANSWER: c. domestic producers are better off, and domestic consumers are worse off.TYPE: M KEY1: D SECTION: 2 OBJECTIVE: 2 RANDOM: Y6 ANSWER: d. the gains of the winners exceed the losses of the losers.TYPE: M KEY1: D SECTION: 2 OBJECTIVE: 2 RANDOM: Y7 ANSWER: a. the domestic price will equal the world price.TYPE: M KEY1: D SECTION: 2 OBJECTIVE: 2 RANDOM: Y8 ANSWER: b. will increase.TYPE: M KEY1: T SECTION: 2 OBJECTIVE: 2 INSTRUCTION: 4 RANDOM: Y102 ❖ Chapter 9/Application: International Trade9 ANSWER: b. will increase.TYPE: M KEY1: T SECTION: 2 OBJECTIVE: 2 INSTRUCTION: 4 RANDOM: Y10 ANSWER: a. export Q3– Q1 saddles.TYPE: M KEY1: G SECTION: 2 OBJECTIVE: 3 GRAPH FORMAT: M QUESTION GRAPH: INSTRUCTION: 8 RANDOM: Y11 ANSWER: a. A.TYPE: M KEY1: G SECTION: 2 OBJECTIVE: 3 GRAPH FORMAT: M QUESTION GRAPH: INSTRUCTION: 8 RANDOM: Y12 ANSWER: a. F.TYPE: M KEY1: G SECTION: 2 OBJECTIVE: 3 GRAPH FORMAT: M QUESTION GRAPH: INSTRUCTION: 8 RANDOM: Y13 ANSWER: c. import Q3– Q1 barrels of oil.TYPE: M KEY1: G SECTION: 2 OBJECTIVE: 3 GRAPH FORMAT: M QUESTION GRAPH: INSTRUCTION: 1 RANDOM: Y14 ANSWER: a. C.TYPE: M KEY1: G SECTION: 2 OBJECTIVE: 3 GRAPH FORMAT: M QUESTION GRAPH: INSTRUCTION: 1 RANDOM: N15 ANSWER: d. A + B + C + D + E.TYPE: M KEY1: G SECTION: 2 OBJECTIVE: 3 GRAPH FORMAT: M QUESTION GRAPH: INSTRUCTION: 1 RANDOM: N16 ANSWER: c. better-off and domestic buyers worse-off.TYPE: M KEY1: D SECTION: 2 OBJECTIVE: 4 RANDOM: Y17 ANSWER: d. $35 and the quantity of pillows purchased will decrease.TYPE: M KEY1: E SECTION: 2 OBJECTIVE: 4 INSTRUCTION: 2 RANDOM: N18 ANSWER: b. A + B.TYPE: M KEY1: G SECTION: 2 OBJECTIVE: 4 GRAPH FORMAT: M QUESTION GRAPH: RANDOM: YChapter 9/Application: International Trade ❖ 103 19 ANSWER: b. E.TYPE: M KEY1: G SECTION: 2 OBJECTIVE: 4 GRAPH FORMAT: M QUESTION GRAPH: RANDOM: Y20 ANSWER: b. supply curve (above the world price) shifts to the right by the amount of the quota. TYPE: M KEY1: D SECTION: 2 OBJECTIVE: 4 RANDOM: Y21 ANSWER: d. reduce the quantity of imports and raise domestic price.TYPE: M KEY1: D SECTION: 2 OBJECTIVE: 4 RANDOM: Y22 ANSWER: b. Q3 minus Q2.TYPE: M KEY1: G SECTION: 2 OBJECTIVE: 4 GRAPH FORMAT: M QUESTION GRAPH: RANDOM: Y23 ANSWER: c. D + F.TYPE: M KEY1: G SECTION: 2 OBJECTIVE: 4 GRAPH FORMAT: M QUESTION GRAPH: RANDOM: Y24 ANSWER: b. the efficiency argumentTYPE: M KEY1: D SECTION: 3 OBJECTIVE: 5 RANDOM: Y25 ANSWER: b. reduced trade restrictions among Canada, Mexico and the United States.TYPE: M KEY1: D SECTION: 3 OBJECTIVE: 5 RANDOM: Y。