SigmaPlot 12.5 实例教程_图文.ppt
- 格式:ppt
- 大小:2.39 MB
- 文档页数:22
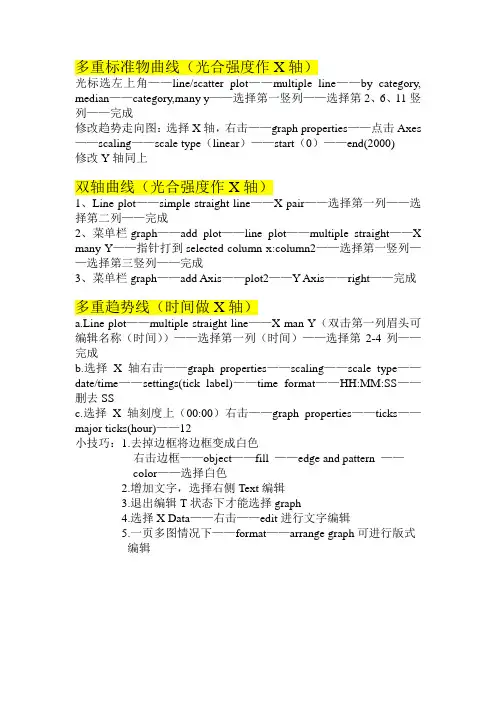
多重标准物曲线(光合强度作X轴)光标选左上角——line/scatter plot——multiple line——by category, median——category,many y——选择第一竖列——选择第2、6、11竖列——完成修改趋势走向图:选择X轴,右击——graph properties——点击Axes ——scaling——scale type(linear)——start(0)——end(2000)修改Y轴同上双轴曲线(光合强度作X轴)1、Line plot——simple straight line——X pair——选择第一列——选择第二列——完成2、菜单栏graph——add plot——line plot——multiple straight——X many Y——指针打到selected column x:column2——选择第一竖列——选择第三竖列——完成3、菜单栏graph——add Axis——plot2——Y Axis——right——完成多重趋势线(时间做X轴)a.Line plot——multiple straight line——X man Y(双击第一列眉头可编辑名称(时间))——选择第一列(时间)——选择第2-4列——完成b.选择X轴右击——graph properties——scaling——scale type——date/time——settings(tick label)——time format——HH:MM:SS——删去SSc.选择X轴刻度上(00:00)右击——graph properties——ticks——major ticks(hour)——12小技巧:1.去掉边框将边框变成白色右击边框——object——fill ——edge and pattern ——color——选择白色2.增加文字,选择右侧Text编辑3.退出编辑T状态下才能选择graph4.选择X Data——右击——edit进行文字编辑5.一页多图情况下——format——arrange graph可进行版式编辑。


通过实例讲SigmaPlot的使用(一)SigmaPlot是一个专业的科研绘图软件。
《Science》、《Nature》中大部分图表都是出自SigmaPlot 之手。
如果你没有使用过SigmaPlot,那么你开始使用的时候会遇到许多问题。
甚至不知道里面的xy pair,single Y等等之类是什么意思。
我今天就来以一个最基本的柱状图为例来说明他的使用。
我们认为对于图表绘制,最大的难点在于数据在表格中的排列格式。
如果你搞清了各种数据在表格中按照怎样的格式输入,那么你就能做出各种各样的图表。
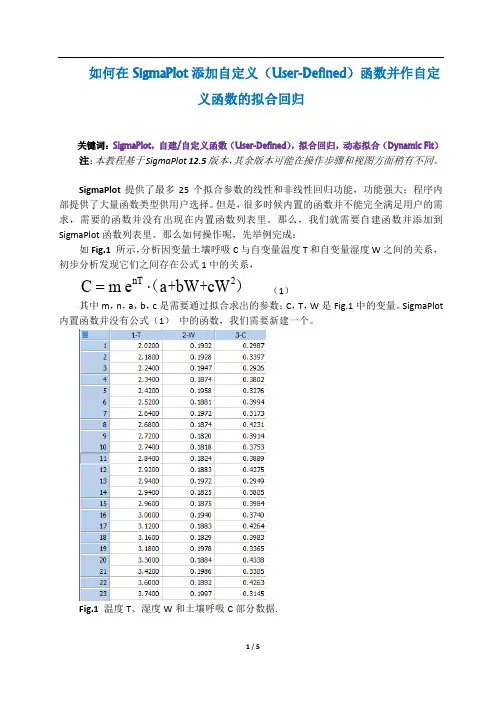
首先我们来看看下面这个带标准差值的柱状图(图一)。
我们假设这个图表是要描述某个指标在肿瘤组和正常组的若干个病人中的表达情况。
两组的指标的均值我们已经计算出来,标准差也计算出来了。
我们看看图表中的数据输入格式,并对照最终生成的图表。
非常明显。
第一根柱子对应表格中的第一行。
第二根柱子对应第二行。
每一行的第三列,分别填上相应组别标准差的值。
对于使用此软件次数很少的人来说,应该先掌握这种简单的数据输入格式。
标准差、均值等可以先通过另外的软件计算出来后填入,然后作图。
图一或许你不屑一顾的认为这种图Excel也可以做啊。
是的,这种图Excel是可以做,但是初学者先从简单的数据排列简单的图表练习起来,随着我们的之后讲解的深入,那些图表,Excel就不一定好做了,或者做起来很复杂。
好的,我们就从头来看看这个是如何做出来的吧。
假设你已经安装好了SigmaPlot,我这里使用的是SigmaPlot 11.0版本。
先打开软件,出现的向导页面点击取消。
然后出现的是图二的画面。
点击工具栏中的新建图标,新建一个所谓的notebook。
(之后的表格、图表等都将会自动放置在这个notebook里面)图二然后就出现图三的界面。
出现了一个空白的表格。
会用Excel的人都知道如何往里面输入数据的。
只需要单击相应的单元格选中,就可以依次输入数据了。
对照图四的数据排列结构输入数据吧。
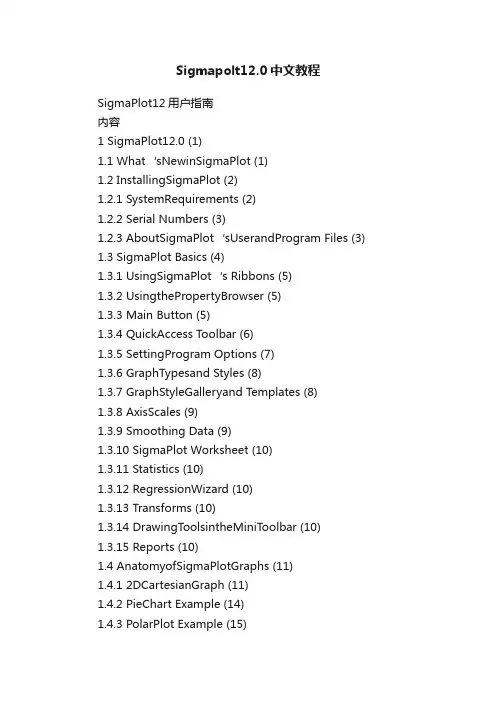
Sigmapolt12.0中文教程SigmaPlot12用户指南内容1 SigmaPlot12.0 (1)1.1 What‘sNewinSigmaPlot (1)1.2 InstallingSigmaPlot (2)1.2.1 SystemRequirements (2)1.2.2 Serial Numbers (3)1.2.3 AboutSigmaPlot‘sUserandProgram Files (3) 1.3 SigmaPlot Basics (4)1.3.1 UsingSigmaPlot‘s Ribbons (5)1.3.2 UsingthePropertyBrowser (5)1.3.3 Main Button (5)1.3.4 QuickAccess Toolbar (6)1.3.5 SettingProgram Options (7)1.3.6 GraphTypesand Styles (8)1.3.7 GraphStyleGalleryand Templates (8)1.3.8 AxisScales (9)1.3.9 Smoothing Data (9)1.3.10 SigmaPlot Worksheet (10)1.3.11 Statistics (10)1.3.12 RegressionWizard (10)1.3.13 Transforms (10)1.3.14 DrawingToolsintheMiniToolbar (10)1.3.15 Reports (10)1.4 AnatomyofSigmaPlotGraphs (11)1.4.1 2DCartesianGraph (11)1.4.2 PieChart Example (14)1.4.3 PolarPlot Example (15)1.4.4 ContourPlot Example (16)1.4.5 3DCartesianGraph Examples (17) 1.4.6 WaterfallPlot Example (19)1.4.7 AreaPlot Example (20)1.5 SigmaPlotHelp (20)1.5.1 SigmaPlot FAQs (20)1.5.2 CustomerService (21)1.5.3 TrainingSeminars (21)1.5.4 TellUsYour Thoughts (21)1.5.5 GettingTechnical Support (21) 1.5.6 ContactingSystatSoftware,Inc (21)1.5.7 References (22)2 CreatingandModifying Graphs (23) 2.1 SettingGraph Defaults (23)2.2 SigmaPlotGraph Types (24)2.3 SigmaPlotGraphStyles (25)2.3.1 Scatter Plots (25)2.3.2 Line Plots (30)2.3.3 Line&Scatter Plots (31)2.3.4 Area Plots (33)2.3.5 Polar Plots (34)2.3.6 RadarPlots (35)2.3.7 Ternary Plots (36)2.3.8 VerticalBarCharts (36)3SigmaPlot12User‘sGuide2.3.9 HorizontalBar Charts (38)2.3.10 BoxPlots (39)2.3.11 Contour Plots (39)2.3.12 3DLinePlots (40)2.4 ArrangingDatafor Graphs (40)2.4.1 ArrangingDatafor2D Plots (40)2.4.2 ArrangingDataforPolarPlots (46)2.4.3 ArrangingDataforaTernaryGraph (47)2.4.4 ArrangingDataforBubble Plots (48)2.4.5 ArrangingDatafor3DGraphs (50)2.5 CreatingGraphs (52)2.5.1 CreatingaGraphfromtheQuickStartScreen (53)2.5.2 CreatingGraphsUsingtheGraphWizard (54)2.5.3 EnteringDataRangesintotheGraphWizard (57)2.6 UsingtheGraphStyle Gallery (58)2.6.1 AddingStylestotheGraphStyle Gallery (59)2.6.2 ApplyingGraphStylestoPages (60)2.6.3 EditingGraphsintheGraphStyle Gallery (60)2.6.4 CreatingGraphStyleGalleryGraphsfromtheGraph Wizard (61)2.7 ModifyingGraphsUsingthePropertyBrowser (63)2.7.1 ModifyingPlotsand Axes (63)2.7.2 ModifyingGridsandPlanes,TitlesandLegends (63)2.7.3 SelectingaGraphoraPlot (64)2.7.4 PickingDifferentDatafortheCurrent Plot (65)2.7.5 ChangingGraphTypeandStyle (67)2.7.6 AddingNewPlots (68)2.7.7 CreatingAdditional Plots (69)2.7.8 Hiding,Showing,andDeleting Plots (70)2.7.9 SamplingFewerDataPoints (72)2.7.10 PlottingMissingandOutofAxisRangeDataPoints (73)2.8 CreatingandModifyingEmbeddedSigmaPlot Graphs (75)2.8.1 CreatingEmbedded Graphs (75)2.8.2 UsingEmbeddedGraph Options (75)2.8.3 EditingEmbedded Graphs (76)2.8.4 ViewingDataforanEmbedded Graph (77)2.8.5 ResizingEmbedded Graphs (77)2.8.6 CreatingSigmaPlotGraphsUsingMicrosoft Excel (77) 2.9 ChangingSymbolTypeandOtherSymbolOptions (78)2.9.1 ChangingSymbolType,Size,andColor (78)2.9.2 AutomaticallyIncrementingSymbols (79)2.9.3 UsingCharactersandTextas Symbols (81)2.9.4 UsingDifferentSymbolSizes (83)2.10 ChangingLineTypeandOtherLine Options (86)2.10.1 ChangingPlotLineAttributes (86)2.10.2 AutomaticallyIncrementingLines (88)2.11 ChangingPatternsandFill Colors (89)2.11.1 ChangingPlotFillPatternsand Colors (89)2.11.2 AutomaticallyIncrementingChart Fills (92)2.11.3 UsingCustomSymbol,Fill,Line,andColorIncrements (93) 2.12 ChangingBarandBoxWidthsand Spacing (95)2.12.1 UniformversusVariableBar Widths (99)2.13 AddingandModifyingDropLines (99)2.13.1 DropLinesforaSinglePoint (102)42.14 PlottingandSolving Equations (103)2.14.1 PlottingEquationsontoExistingGraphs (105)2.14.2 SettingEquation Parameters (106)2.14.3 PlottingSavedEquations (107)2.14.4 SolvingEquations (108)2.14.5 ResultsBoxTipsandTricks (110)2.14.6 EquationSolvingGuidelines (111)2.15 PlottingandModifyingRegression Lines (112)2.15.1 ModifyingandAddingLinearRegression Lines (112)2.15.2 ViewingandSavingRegressionEquation Results (113)2.15.3 AddingConfidenceandPrediction Intervals (114)2.15.4LinearRegression,Confidence,andPredictionCalculation (115)2.16 AddingReference Lines (117)2.16.1 DrawingReference Lines (118)2.17 CreatingHistograms (120)2.17.1 UsingtheHistogram Wizard (120)2.17.2 TheHistogramTransformFunction (123)3 GraphPage Basics (125)3.1 AboutGraph Pages (125)3.1.1 SettingPageOptions (125)3.1.2 ExportingGraphsandPages (126)3.1.3 PrintingGraph Pages (127)3.2 WorkingwithPageObjects (127)3.2.1 SelectingPageObjects (128)3.2.2 SelectingMultipleObjects (128)3.2.3 SelectingObjectsthatOverlayOneAnother (129)3.2.4 RealTimeMouse-Over Feedback (129)3.3 AddingAnotherGraphtoaPage (130)3.3.1 CreatingaNewGraphontheCurrentPage (130)3.3.2 CopyingaGraphontheSamePage (130)3.3.3 CopyingandPastingaGraphfromOnePagetoAnother (130)3.4 ZoomingInandOut (131)3.5 UsingGraphPagesasTemplates (131)3.5.1 ApplyingTemplates (131)3.5.2 TemplatesandNotebooks (133)3.5.3 ChangingthePageCreatedwiththeNewPage Button (134)3.5.4 ChangingtheTemplateFileUsedforNew Pages (135)3.5.5 AddingNewPagesto Template.jnt (136)3.6 Cutting,CopyingandPastingGraphsandotherPage Objects (136)3.6.1 CuttingandCopyingGraphs (136)3.6.2 PastingObjects (136)3.7 UsingOLEtoPaste,LinkandEmbedObjects (137)3.7.1 SigmaPlotand OLE (137)3.7.2 MethodsOfPlacing Objects (137)3.7.3 LinkingorEmbedding Objects (138)3.7.4 PlacingSigmaPlotObjectsintoOtherApplications (139)3.7.5 ViewasIcon (139)3.7.6 PlacingSigmaPlotGraphsintoOtherApplications (141)3.7.7 PastingObjectsontoaGraphPageorReport (143)3.7.8 PlacingObjectswithouttheClipboard (145)3.8 DraggingandDropping Graphs (146)3.8.1 DraggingandDroppingGraphsBetween Pages (146)3.9 HidingandDeletingObjectsfromthePage (147)5SigmaPlot12User‘sGuide3.9.1 HidingandViewingGraphsona Page (147)3.9.2 HidingGraphTitlesandLegends (147)3.9.3 RemovingGraphs,Plots,Titles,Legends,andOtherPageObjects (148)3.10 DrawingObjectsonthe Page (148)3.10.1 GraphPageT ools (148)3.10.2 Drawingan Object (149)3.11 ModifyingObjectColorsandLines (150)3.11.1 ChangingObjectFills (150)3.11.2 ChangingLines (150)3.11.3 ChangingLineEnding Attributes (151)3.12 MovingandSizingGraphsand Objects (151)3.12.1 UsingYourMousetoMoveGraphsand Objects (152) 3.12.2 UsingYourMousetoChangeGraphandObjectSize (153) 3.12.3 SettingaSpecificSizeandLocation (154)3.12.4 NudgingGraphsand Objects (155)3.12.5 MovingObjectstotheFrontorBack (155)3.12.6 GroupingandUngroupingObjects (156)3.13 ArrangingGraphsona Page (157)3.13.1 HowtoArrangeGraphsonaPage (157)3.13.2 HowtoAddNewPagestoLayout.jnt (158)3.13.3 HowtoCreateaCustomLayoutTemplate File (160)3.13.4 HowtoChangetheDefaultLayoutTemplateFile (160) 3.14 AligningPageObjects (161)3.14.1 WorkingwithGridsandRulers (162)3.15 EditingText (163)3.15.1 CreatingText Labels (164)3.15.2 EditingTextandIndividualCharacters (166)3.15.3 FormattingT ext (166)3.16 WorkingwithAutomatic Legends (167)3.16.1 EditingIndividualLegendEntries (167)3.16.2 SizingLegendSymbols (168)3.16.3 EditingAutomatic Legends (168)3.17 ChangingGraphPage Format (169)3.17.1 ChangingandDisplayingGraphPage Margins (170) 3.17.2 GraphPageSizeandOrientation (171)3.17.3 ChangingPageUnitsofMeasurement (172)3.17.4 ChangingPageColor (173)3.17.5 PageColorDefault Setting (174)3.17.6 Templates (174)3.18 UsingCustom Colors (175)3.18.1 Configuring YourDisplayfor Color (175)4 NotebookManager Basics (179)4.1 ProtectingNotebooks (180)4.1.1 SettingaPassword (180)4.1.2 ChangingorRemovingaPassword (182)4.1.3 CreatingaNotebookAudit List (184)4.2 WorkingwithSectionsintheNotebookManager (185)4.2.1 CreatingNewItemsintheNotebookManager (185)4.2.2 CopyingandPastingtoCreateNewSections (186)4.2.3 RenamingNotebookFilesandItems (186)4.2.4 In-placeEditingSectionandItem Names (186)4.2.5 CopyingaPagetoaSectionwithNoWorksheet (187)64.3 OpeningFilesintheNotebookManager (187)4.3.1 OpeningWorksheets,Reports,and Pages (188)4.3.2 CopyingandPastingItemsintheNotebookManager (189)4.3.3 DeletingItemsintheNotebookManager (189)5 WorksheetBasics (191)5.1 Opening Worksheets (191)5.2 SavingWorksheetsto Notebooks (191)5.3 SettingWorksheetDisplay Options (192)5.4 FreezingPanes (195)5.5 MovingAroundthe Worksheet (195)5.5.1 Goingtoa Cell (195)5.5.2 UsingtheWorksheetShortcut Menu (196)5.6 EnteringDataintoaWorksheet (196)5.6.1 EnteringDatesandTimes (197)5.6.2 InsertionandOverwriteModes (197)5.7 ImportingFilesfromOther Applications (198)5.7.1 CopyingandPastingDatafromOther Applications (199)5.7.2 ImportingODBC Databases (199)5.7.3 ImportingExcelasODBC (202)5.7.4SigmaPlot,SigmaStat,SigmaScan,andMochaWorksheets (203)5.7.5 MicroSoftExcel,Lotus1-2-3andQuattro Files (203)5.7.6 ImportingTextFiles (204)5.7.7 ImportingAxonFiles (205)5.7.8 SPSS(.SA V) (205)5.8 ExportingWorksheetData (205)5.8.1 HowtoExportaWorksheet (206)5.8.2 ExportingWorksheetsasTextFiles (207)5.8.3 Exportingto SYSTAT (207)5.9 DescriptiveStatisticsforWorksheets (207)5.9.1 AvailableStatistics (208)5.9.2 StatisticsOptions (209)5.9.3 EngineeringandENotation (211)5.10 DisplayingWorksheetData (212)5.10.1 SizingColumnsandRows (213)5.10.2 ChangingtheAppearanceoftheWorksheet Grid (214)5.10.3 SettingDataFeedback Colors (216)5.10.4 SettingDecimalPlaces (218)5.10.5 ChangingNumbersDisplay (220)5.10.6 ChangingDateandTimeDisplay (223)5.10.7 SettingDayZero (226)5.10.8 RegionalSettings (229)5.10.9 UsingDate/TimeFormatwithOtherPrograms (229)5.11 FormattingWorksheets (229)5.11.1 SettingRowandColumnSize (230)5.11.2 SwitchingBetweenDateandTimeandNumericDisplay (232)5.11.3 SortingData (233)5.12 Cutting,Copying,Pasting,MovingandDeletingData (233) 5.12.1 StackingColumns (234)5.12.2 SelectingaBlockof Data (234)5.12.3 CuttingandCopying Data (235)5.12.4 Pasting Data (235)5.12.5 MovingData (235)5.12.6 DeletingData (235)7SigmaPlot12User‘sGuide85.12.7 InsertingBlocksofCells,Columns,andRowsof Data (236) 5.12.8 DeletingBlocksofCells,Columns,andRowsofData (236) 5.12.9 SwitchingRowstoColumns (237)5.13 EnteringandPromotingColumnandRowTitles (237)5.13.1 UsingtheColumnandRowTitlesDialogBox (237)5.13.2 UsingaWorksheetRowforColumn Titles (239)5.13.3 UsingaWorksheetColumnforRow Titles (240)5.13.4 UsingaCellasaColumnorRowTitle (241)5.14 RemovingOutliersandOtherData (242)5.14.1 HighlightingOutliers (244)5.15 Indexing Data (246)5.15.1 CreatingIndexedData (246)5.15.2 UnindexingData (246)5.16 UsingExcelWorkbooksin SigmaPlot (247)5.16.1 UsingExcelasDefault Workbooks (247)5.16.2 SigmaPlotFunctionalitywithinExcelWorkbooks (247) 5.16.3 CreatingSigmaPlotGraphsWithExcel Workbooks (248) 5.16.4 UsingTransformsonDatainExcel Workbooks (248)5.16.5 UsingStatisticswith Excel (248)5.17 Printing Worksheets (248)5.17.1 PrintingtheCurrent Worksheet (248)5.17.2 Previewing Worksheets (249)5.17.3 PrintingColumn Statistics (250)5.17.4 SettingPrinting Options (251)5.17.5 ConfiguringPrinterSettings (252)6 Workingwith2D Plots (253)6.1 Scatter,Line,andLine/Scatter Plots (253)6.2 AreaPlots (254)6.3 Bar Charts (254)6.4 BoxPlots (255)6.5 Creating2DPlots (255)6.5.1 Creating2DPlotswithMultiple Curves (256)6.5.2 PlottingCategoryandGroupedData (256)6.6 Creating2DScatterPlotswithErrorBars (258)6.6.1 CreatingaRangePlot (261)6.7 Creating2DPlotswithAsymmetricErrorBars (262) 6.7.1 CreatingQuartilePlots (263)6.7.2 CreatingErrorBarPlotsUsingCategory Data (264) 6.8 ModifyingErrorBars (264)6.8.1 ChangingErrorBar Appearance (265)6.8.2 ChangingErrorBar Directions (265)6.8.3 CustomizingErrorBarDirections (267)6.8.4 ChangingtheMeanComputationMethod (267) 6.8.5 ChangingErrorBarSource (268)6.9 GroupedBar Charts (268)6.9.1 CreatingGroupedBarCharts (269)6.9.2 SpacingBarsfromDifferentPlots (270)6.9.3 GroupingColumnAveragedBars (271)6.10 CreatingBox Plots (273)6.10.1 ChangingOtherBoxPlotAttributes (275)6.10.2 ModifyingBoxPlots (276)6.10.3 ComputingPercentile Methods (277)6.11 CreatingArea Plots (277)6.11.1 CreatingSimpleandVerticalArea Plots (278)6.11.2 CreatingMultipleAreaandMultipleVerticalAreaPlots (280)6.11.3 CreatingComplexAreaPlots (281)6.11.4 ConvertingaMultipleAreaPlottoaComplexArea Plot (282)6.11.5 ShadinginDifferentDirections (283)6.11.6 ChangingAreaPlotFill Colors (284)6.11.7 ShadingBetweenTwoCurves (285)6.12 Bubble Plots (291)6.12.1 CreatingaBubblePlot (291)6.13 Vector Plots (292)6.13.1 CreatingaVectorPlot (292)6.13.2 ModifyingVectorPlot Arrowheads (294)6.14 RadarGraphs (295)6.14.1 CreatingaRadar Graph (296)6.15 AboutAxesandPlots (297)6.15.1 CreatingAdditionalAxesforMultiple Plots (297)6.15.2 CreatingMultipleAxesforaSinglePlot (298)7 Workingwith3DandContourGraphs (301)7.1 3DScatterandLine Plots (301)7.2 MeshPlots (302)7.3 3DBarCharts (303)7.4 Waterfall Plots (303)7.5 Creating3DScatterPlotsand3DBar Charts (304)7.5.1 Creatinga3DScatterPlotor3DBarChart: (304)7.6 CreatingTrajectoryPlots (305)7.6.1 CreatingaTrajectoryPlot (305)7.7 CreatingWaterfallPlots (306)7.7.1 CreatingaWaterfall Plot (307)7.7.2 ChangingtheColorofDropPlanesinWaterfallPlots (308) 7.8 CreatingMeshPlots (309)7.8.1 Creatinga3DMesh Plot (310)7.8.2 ModifyingMeshLinesandFillColor (311)7.8.3 ChangingGraphPerspective,Rotation,and Shading (311) 7.9 3DGraphAxis Placement (316)7.9.1 AxisPlacementDuringGraphRotation (316)7.9.2 Drawing,Modifying,andHidingFrameLines (316)7.10 CreatingContourPlots (318)7.10.1 CreatingaContour Plot (319)7.10.2 CreatingaFilledContourPlot (320)7.11 ModifyingContourPlots (320)7.11.1 DisplayingandChangingContourLines (321)7.11.2 AddingFillstoContourPlots (322)7.11.3 ModifyingInterpolatedFilledContours (322)7.11.4 ChangingContourVertical(ZData)RangeandScale (323) 7.11.5 ChangingContourLineIntervals (324)7.11.6 DisplayingandModifyingContourLabels (325)7.11.7 ChangingContourLabelSettings (327)8 WorkingwithPie,Polar,andTernary Plots (333)8.1 PieCharts (333)8.1.1 CreatingaPieChart (334)8.1.2 ModifyingPieCharts (335)8.1.3 RotatingthePie (335)8.1.4 AddingExplodingSlices (336)9SigmaPlot12User‘sGuide8.2 PolarPlots (338)8.2.1 CreatingaPolar Plot (338)8.2.2 ModifyingaPolar Plot (339)8.3 TernaryGraphs (340)8.3.1 TernaryPlotStyles (340)8.3.2 CreatingaTernaryPlot (340)8.3.3 ModifyingTernary Graphs (342)9 ModifyingAxes,TickMarks,andGrids (343)9.1 AxisScaleTypes (343)9.1.1 Linear (344)9.1.2 Common Log (344)9.1.3 NaturalLog (344)9.1.4 Probability (344)9.1.5 Probit (344)9.1.6 Logit (345)9.1.7 Category (345)9.1.8 Date/Time (346)9.1.9 Reciprocal (346)9.1.10 Weibull (347)9.2 ChangingAxisScalesandRange (347)9.2.1 ChangingAxis Range (347)9.3 ChangingScaleType (348)9.3.1 UsingaCategory Scale (349)9.3.2 UsingaDateandTime Scale (351)9.3.3 UsingaCustomAxisScale (351)9.4 Hiding,Displaying,andDeletingAxes (352) 9.4.1 ChangingAxisLine,Color,andThickness (353) 9.4.2 MovingAxes (354)9.5 SettingAxisBreaks (356)9.5.1 CreatinganAxis Break (357)9.6 WorkingwithAxisTitlesandTick Labels (359)9.6.1 EditinganAxis Title (359)9.6.2 RotatingAxis Titles (359)9.6.3 ViewingandHidingAxisTitlesandTickLabels (360)9.6.4 MovinganAxis Title (360)9.7 ChangingTickMarkIntervals (360)9.7.1 ChangingLinearandProbitScaleTickMarkIntervals (360) 9.7.2 TickIntervalsforLogAxes (362)9.7.3 NaturalLogandLogitScales (363)9.7.4 TickIntervalsforProbabilityScales (364)9.7.5 TickIntervalsforDate/TimeAxes (365)9.7.6 CustomizingTickIntervals (366)9.8 ChangingTickMarkAppearance (367)9.8.1 TickMarkDirection (368)9.8.2 HidingTickMarks (369)9.8.3 ChangingTickMarkLineAttributes (369)9.9 ChangingTick Labels (371)9.9.1 ChangingTickLabelFontandOtherTextAttributes (371) 9.9.2 ChangingTickLabelType (372)9.9.3 FormattingNumericTickLabels (373)9.9.4 FormattingSeriesTick Labels (376)9.9.5 AddingaPrefixorSuffixtoTickLabels (377)9.9.6 ChangingDateandTimeTickLabels (377)109.9.7 UsingCustom TickLabels (379)9.10 DisplayingGridLinesand Backplanes (381)9.10.1 Modifying Backplanes (381)9.10.2 ModifyingGridLines (382)9.10.3 HidingandViewingGridLines (384)9.11 ModifyingPolar Axes (385)9.11.1 AngularAxes (386)9.11.2 Radial Axes (388)9.12 ModifyingTernaryAxes (395)9.12.1 ModifyingTernaryAxisTitleLocation (396)9.12.2 ChangingT ernaryAxisRange,Scale,andDirection (397)9.12.3 ChangingT ernaryAxisTickMarksandTick Labels (402)10 UsingtheReportEditor (409)10.1 Creating Reports (409)10.2 SettingReport Options (410)10.3 SettingReportPageSizeand Margins (413)10.4 Exporting Reports (415)10.5 PrintingReports (416)10.6 InsertingtheCurrentDateandTimeintoaReport (419) 10.7 FormattingTextandParagraphs (420)10.8 UsingtheReportEditorRuler (420)10.8.1 ShowingandHidingReport Rulers (421)10.8.2 SettingReportRulerUnits (421)10.8.3 SettingTabs (422)10.8.4 SettingParagraph Indents (423)10.9 AddingTablestoReports (424)10.9.1 ChangingTableBorder Color (424)10.9.2 DeletingCells,Columns,andRowsfromTables (424) 10.9.3 AddingRowstoReportTables (425)10.9.4 AddingColumnstoReportTables (425)11 Publishing Graphs (427)11.1 PublishingGraphsontheWorldWideWeb (427)11.1.1 AbouttheSigmaPlot WebViewer (427)11.1.2 ExportingGraphsintoHTMLFormat (427)11.1.3 PasswordProtectingDataontheWorldWideWeb (428)11.1.4 ExportingDataAssociatedwiththeGraph (429) 11.2 SubmittingGraphsforPublication (430)11.2.1 FigureSubmission Requirements (430)11.2.2 CreatingFilesforFigureSubmission (431)11.2.3 WhyUseEPS? (432)11.2.4 About dpi (432)11.3 TheSubmission Assistant (432)11.3.1 UsingtheSubmissionAssistant (433)11.3.2 EditingaSubmissionProfile (434)12 AutomatingRoutineTasks (435)12.1 BeforeyouRecorda Macro (435)12.2 RecordingMacros (435)12.3 CreatingMacrosUsingtheMacroLanguage (437) 12.4 Editing Macros (438)12.4.1 GettingHelpforSaxBasicin SigmaPlot (439) 12.4.2 UsingtheMacroWindowToolbar (439)12.4.3 Color-CodedDisplay (441)12.4.4 ObjectandProcedureLists (441)11SigmaPlot12User‘sGuide12.4.5 SettingMacroWindow Options (441)12.4.6 PartsoftheMacroProgrammingLanguage (442) 12.4.7 ScrollingandMovingtheInsertionPoint (443) 12.4.8 EditingMacroCode (443)12.4.9 AddingExistingMacrostoaMacro (444)12.4.10 CreatingCustomDialog Boxes (444)12.4.11 UsingtheObjectBrowser (444)12.4.12 UsingtheAddProcedureDialogBox (445) 12.5 AboutUser-DefinedFunctions (445)12.5.1 CreatingUser-DefinedFunctions (446)12.6 UsingtheDebugWindow (446)12.6.1 DebugToolbarButtons (446)12.6.2 DebugWindowTabs (446)12.6.3 ImmediateT ab (446)12.6.4 WatchTab (447)12.6.5 StackTab (447)12.7 StreamliningProcedureswithMacros (447)12.7.1 OpeningSigmaPlotfromMicrosoftWordorExcel (447)12.7.2 RunningSigmaPlotMacrosfromtheCommandPrompt (448)12.7.3 CreatingMacrosasMenuCommands (448)12.8 UsingSigmaPlot‘sMacros (449)12.8.1 HowtoRunaMacro (449)12.9 SigmaPlot‘s Macros (450)12.9.1 AreaBelow Curves (451)12.9.2 BatchProcessExcelFiles (452)12.9.3 Bland-Altman Analysis (452)12.9.4 BorderPlots (454)12.9.5 ByGroupDataSplit (454)12.9.6 ColorTransition Values (454)12.9.7 Compute1stDerivative (455)12.9.8 DotDensity Plot (455)12.9.9 FrequencyPlot (456)12.9.10 FTestComparisonofCurves (456)12.9.11 GaussianCumulative Distribution (459)12.9.12 InsertGraphsintoMicrosoft Word (459)12.9.13 LabelSymbols (459)12.9.14 MergeColumns (460)12.9.15 PastetoPowerPoint Slide (460)12.9.16 Piper Plots (461)12.9.17 PlottingPolarandParametric Equations (463)12.9.18 PowerSpectralDensity (464)12.9.19 Quick Re-Plot (464)12.9.20 RankandPercentile (464)12.9.21 ROCCurveAnalysis (465)12.9.22 Standard Curve (480)12.9.23 SurvivalCurve (487)12.9.24 VectorPlot (487)13 SigmaPlotAutomationReference (489)13.1 AboutObjectsandCollections (489)13.2 About Properties (489)13.3 About Methods (490)13.4 Returning Objects (490)13.4.1 ReturningObjectsfromCollections (490)1213.4.2 DefiningVariables (491)14 UsingTransforms (493)14.1 NormalizingTernary Data .....................................................................493 1314.1.1 HowtoNormalizeTernaryData (493)14.2 Smoothing2Dand3D Data (494)14.2.1 Smoothing2DData (495)14.2.2 Smoothing3DData (499)14.3 UsingStatistical Transforms (502)14.3.1 Stacking Data (503)14.3.2 Indexing Data (503)14.3.3 UnindexingData (504)14.3.4 SimpleTransforms (504)14.3.5 CenteringData (505)14.3.6 StandardizingData (506)14.3.7 RankingData (507)14.3.8 CreatingInteractionVariables (507)14.3.9 CreatingDummy(Indicator)Variables (509)14.3.10 CreatingLaggedVariables (512)14.3.11 FilteringStringsandNumbers (513)14.3.12 GeneratingRandom Numbers (514)14.3.13 TranslatingMissingValueCodes (516)14.4 User-DefinedTransforms (517)14.4.1 HowtoCreateaUser-Defined Transform (517)14.4.2 TransformSyntaxandStructure (518)14.4.3 Transform Components (520)14.5 PerformingQuickTransforms (524)14.5.1 AutomaticUpdatingof Transforms (526)14.5.2 SettingTrigonometricUnitsforQuickTransforms (526) 14.5.3 SettingaQuickTransformasaColumn Title (527) 14.6 Transform Operators (527)14.6.1 OrderofOperation (528)14.6.2 OperationsonRanges (529)14.6.3 ArithmeticOperators (529)14.6.4 RelationalOperators (530)14.6.5 Logical Operators (531)14.7 Transform Examples (531)14.7.1 DataTransform Examples (532)14.7.2 GraphingTransform Examples (538)15 TransformFunction Reference (569)15.1 FunctionArguments (569)15.2 User-DefinedFunctions (569)15.3 TransformFunction Descriptions (570)15.3.1 abs (578)15.3.2 ape (579)15.3.4 arcsin (580)15.3.5 arctan (580)15.3.6 area (581)15.3.7 avg (581)15.3.8 block (582)15.3.9 blockheight,blockwidth (582) 15.3.10 cauchyden (582)15.3.11 cauchydist (583) SigmaPlot12User‘sGuide14 15.3.12 cauchyinv (583)15.3.13 cell (584)15.3.14 chisquareden (584)15.3.15 chisquaredist (585)15.3.16 chisquareinv (585)15.3.17 choose (585)15.3.18 col (586)15.3.19 complex (586)15.3.20 cos (587)15.3.21 cosh (587)15.3.22 count (587)15.3.23 data (588)15.3.24 diff (589)15.3.25 dist (589)15.3.26 dsinp (589)15.3.27 erf (590)15.3.28 erfc (590)15.3.29 exp (590)15.3.30 expden (591)15.3.31 expdist (591)15.3.33 factorial (592)15.3.34 fden (592)15.3.35 fdist (593)15.3.36 fft (593)15.3.37 finv (594)15.3.38 for (594)15.3.39 fwhm (595)15.3.40 gammaden (596) 15.3.41 gammadist (596) 15.3.42 gammainv (597) 15.3.43 gaussian (597)15.3.44 histogram (597) 15.3.45 if (598)15.3.46 if...then...else. (599) 15.3.47 imaginary(img) (599) 15.3.48 implicit (600)15.3.49 int (604)15.3.50 interpolate (604) 15.3.51 inv (605)15.3.52 invcpx (605)15.3.53 invfft (605)15.3.54 ln (606)15.3.55 log (606)15.3.56 logisden (607)15.3.57 logisdist (607)15.3.58 logisinv (607)15.3.59 loglogisden (608) 15.3.60 loglogisdist (608) 15.3.61 loglogisinv (609)15.3.62 lognormden (609)15.3.63 lognormdist (609)15.3.64 lognorminv (610)15.3.65 15.3.66 15.3.67 lookup (610) lowess (612)lowpass (613)15.3.68 max (613)15.3.69 mean (613)15.3.70 median (614)15.3.71 min (614)15.3.72 missing (614)15.3.73 mod (615)15.3.74 mulcpx (615)15.3.75 normden (616)15.3.76 normdist (616)15.3.77 norminv (617)15.3.78 nth (617)15.3.79 partdist (617)15.3.80 polynomial (618)15.3.81 prec (618)15.3.82 putinto (619)15.3.83 random (619)15.3.84 real (619)15.3.85 rgbcolor (620)15.3.86 root (620)15.3.87 round (622)15.3.88 runavg (622)15.3.89 sin (623)15.3.90 sinh (623)15.3.91 sinp (624)15.3.92 size (624)15.3.93 sort (625)15.3.94 sqrt (625)15.3.95 stddev (625)15.3.96 stderr (626)15.3.97 subblock (626)15.3.98 sum (627)15.3.99 tan (627)15.3.100 tanh (627)15.3.101 tden (628)15.3.102 tdist (628)15.3.103 tinv (629)15.3.104 total (629)15.3.105 weibullden (629)15.3.106 weibulldist (630)15.3.107 weibullinv (630)15.3.108 x25 (630)15.3.109 x50 (631)15.3.110 x75 (632)15.3.111 xatymax (632)15.3.112 xwtr (633)16 Nonlinear Regression (635)16.1 AbouttheRegressionWizard (635)16.2 AbouttheCurveFitter (636)16.2.1 Curve-fitting Algorithm (637)16.2.2 ReferencesfortheMarquardt-LevenbergAlgorithm (637)15SigmaPlot12User‘sGuide16.3 Opening.FIT Files (637)16.3.1 Adding.FITFilestoaLibraryorNotebook (638) 16.4 UsingtheRegression Wizard (638)16.4.1 SelectingtheEquationto Use (638)16.4.2 SelectingtheVariablestoFit (639)16.4.3 ViewingFitResults (639)16.4.4 SettingNumericOutput Options (639)16.4.5 SettingGraphOptions (640)16.4.6 SelectingColumnsforGraph Data (641)16.4.7 FinishingtheRegression (642)16.5 SettingNonlinearRegressionReport Options (642) 16.5.1 Assumption Checking (642)16.5.2 Residuals (643)16.5.3 MoreStatistics (645)16.5.4 Other Diagnostics (645)16.6 RunningaRegressionFromaNotebook (646) 16.7 CreatingNewRegressionEquations (647)16.8 ViewingandEditingCode (648)16.9 SavingRegressionEquationChanges (648)16.10 VariableOptions (649)16.10.1 MultipleIndependentVariables (649)16.11 EquationOptions (649)16.11.1 Parameters (650)16.11.2 Constraints (650)16.11.3 EnteringParameterConstraints (651)16.11.4 DefiningConstants (652)16.11.5 Fitwith Weight (652)16.11.6 Iterations (652)16.11.7 StepSize (653)16.11.8 Tolerance (654)16.12 WatchingTheFit Progress (654)16.12.1 Cancellinga Regression (655)16.13 InterpretingFit Results (655)16.13.1 CompletionStatusMessages (655)16.13.2 Rsqr (655)16.13.3 FitResults (655)16.13.4 ChangingtheRegressionEquationorVariables (656)16.13.5 More Iterations (656)16.13.6 CheckingUseofConstraints (656)16.13.7 Quittingthe Regression (657)16.14 SavingRegression Results (657)16.14.1 SavingtheResultsusingDefault Settings (657)16.14.2 SavingResultstotheWorksheet (657)16.15 GraphingRegressionEquations (658)16.15.1 DataPlottedforRegression Curves (659)16.16 ConfidenceandPrediction Bands (660)16.16.1 Confidence andPredictionBandComputationalFormulas (660)16.16.2 ChangingConfidenceandPredictionBandPercentageValues (661)16.17 InterpretingRegression Reports (664)16.17.1 Equation Code (664)16.17.2 RandRSquared (664)16.17.3 AdjustedRSquared (665)1616.17.4 StandardErroroftheEstimate (665)16.17.5 StatisticalSummaryTable (665)16.17.6 AnalysisofVariance(ANOV A)Table (666)16.17.7 PRESSStatistic (667)16.17.8 Durbin-WatsonStatistic (667)16.17.9 Normality Test (667)。

目录:z制作柱形图: (2)z制作肿瘤生长曲线 (8)z多组柱形图: (11)z多坐标轴作图 (14)制作柱形图:1.1 排列数据:1.2 选择左框中的vertical bar (对同一组数据的分析)1.3Symbol value指每个数据代表的什么。
这里我们要计算的是control、Yp等每列数据的平均值,应该选择column means(列平均)。
1.4选择x and many Y,X轴如果是数字,很容易出现1.000,输入1后加空格,就会被默认为是字符。
1.5图片制作好,在graph properties中修改,主要是让图片好看,还有符合杂志的要求,例如将X轴Y轴的数字变大(我常用的是14号)。
XY轴的名称可以再大些(24号)。
X data,Y data双击可以改写。
线条,框架点击可以直接delete。
1.6X轴中的control、Yp、Ys….如果太长,可以双击这些词,会出现下图。
点击tick labelfont,点击paragraph,在rotation中选择旋转角度,一般25,35度都可以。
1.7统计学比较的话,我只用过最简单的,就是t-test。
1.8比较group1和group2的差异性,直接鼠标点击这一行,比较的就是这两行数据的差别。
(注意的是有的数据安排一行中会出现其他的数据,在统计时,就要把相应的数据copy 在一边单独比较)有差别时,使用图片右侧T选项(同Photoshop)在相应的bar上写*。
1.9最后图片都处理好了,使用ctrl+A(全选),用图片右侧的group项组合(同PPT)。
1.10选中图片,点file中的export file,输出图片,一般使用TIFF格式,保证图片分辨率。
这种图片一般保存需要600dpi。
最后OK。
z 制作肿瘤生长曲线1. 数据排列(X 轴如果是数字,很容易出现1.000,输入1后加空格,就会被默认为是字符。
)2. 这种不同于一条曲线,是要比较3-6条曲线之间的不同。

如何使用SigmaPlot作图如何使用SigmaPlot作图SigmaPlot是一个专业的绘图软件,如果你没有使用过SigmaPlot,那么你开始使用的时候会遇到很多的问题,可能都不知道里面的XY pair,sigle Y是什么意思。
下面小编就以一个最基本的柱状图为例,来为大家讲解它的使用。
如果你搞清了个钟头数据在表格中是按照怎样的格式和规则输入,那么你就能做出各式各样的图表了。
1.首先下载并双击打开SigmaPlot作图软件,如图一(小编这里用的是SigmaPlot13.0,但各个版本差距不大)图一2.打开会弹出如图二窗口,这里是问你要不要打开一个新的netbook,点击OK则是直接新建,点击cancel是取消,这里我们点击cancel取消(当然可以直接新建,但是这里小编要教你如何在软件内新建netbook)图二3.用过excel的人都知道,将鼠标放在工具栏左上角的西格玛(Σ)图标上,然后出现的是图三画面,点击工具栏中的新建图标(New),接着点击notebook,即新建一个notebook。
(之后表格、图表都将会自动放置在这个notebook里面)图三4.之后就会出现这样的界面了。
接下来输入数据是没有难度的,选中单元格,对照上面的输入就可以了,下面就是输入的结果,如图四图四5.点击工具栏“Create Graph”,选择我们想要做出的图形,小编这里就以简单的柱形图示例,如图五。
图五6.点击柱形图后,会出现如下界面,选中“XY Pair”点击下一步即可,如图六图六7.继续点击选择按钮,如图七所示,选中后点击“完成”。
图七8.点击完成后会弹出一个新界面,即图形展示界面,我们新做的柱形图就在这里,如图八图八。
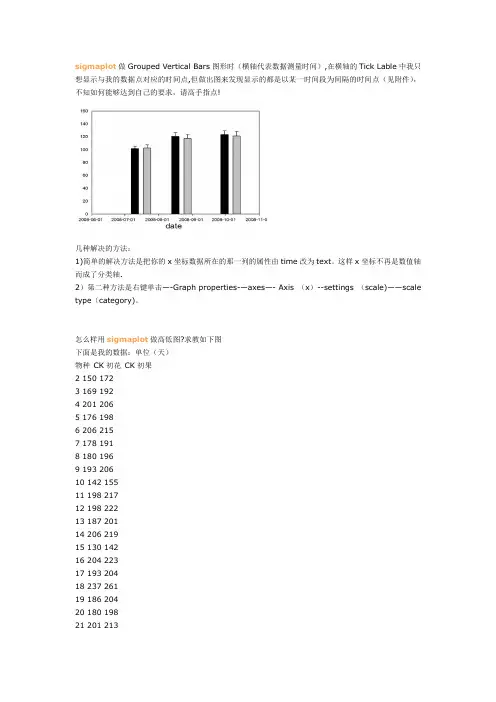
sigmaplot做Grouped Vertical Bars图形时(横轴代表数据测量时间),在横轴的Tick Lable中我只想显示与我的数据点对应的时间点,但做出图来发现显示的都是以某一时间段为间隔的时间点(见附件),不知如何能够达到自己的要求,请高手指点!几种解决的方法:1)简单的解决方法是把你的x坐标数据所在的那一列的属性由time改为text。
这样x坐标不再是数值轴而成了分类轴.2)第二种方法是右键单击—-Graph properties-—axes—- Axis (x)--settings (scale)——scale type(category)。
怎么样用sigmaplot做高低图?求教如下图下面是我的数据:单位(天)物种CK初花CK初果2 150 1723 169 1924 201 2065 176 1986 206 2157 178 1918 180 1969 193 20610 142 15511 198 21712 198 22213 187 20114 206 21915 130 14216 204 22317 193 20418 237 26119 186 20420 180 19821 201 21323 193 20124 193 20625 130 15926 232 24927 205 225怎样做出同一物种初花和初果间的高低图,多谢准噶尔无叶豆个体始花日期(●)、开花高峰日期(▼)、终花日期(○)和花期持续时间变化解答——-————-—————-—————-———-———————--————-Creating 2D Plots with Asymmetric Error BarsCreate 2D scatter plots with error bars using two adjacent worksheet columns as the error bar source to independently control the error bar values。