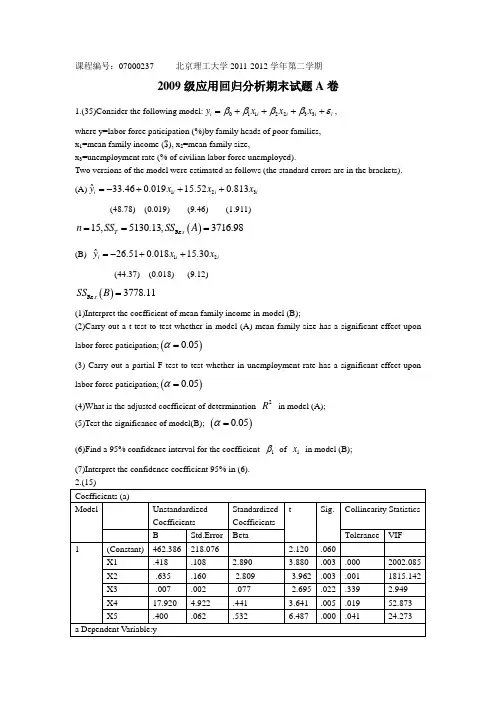
课程编号:07000237 北京理工大学2011-2012学年第二学期2009级应用回归分析期末试题A 卷1.(35)Consider the following model:0112233i i i i i y x x x ββββε=++++,where y=labor force paticipation (%)by family heads of poor families, x 1=mean family income ($), x 2=mean family size,x 3=unemployment rate (% of civilian labor force unemployed).Two versions of the model were estimated as follows (the standard errors are in the brackets).(A)123ˆ33.460.01915.520.813i i i i yx x x =-+++ (48.78) (0.019) (9.46) (1.911)()Re 15,5130.13,3716.98T s n SS SS A ===(B) 12ˆ26.510.01815.30i i i yx x =-++ (44.37) (0.018) (9.12)()Re 3778.11s SS B =(1)Interpret the coefficient of mean family income in model (B);(2)Carry out a t-test to test whether in model (A) mean family size has a significant effect upon labor force paticipation;()0.05α=(3) Carry out a partial F-test to test whether in unemployment rate has a significant effect upon labor force paticipation;()0.05α=(4)What is the adjusted coefficient of determination 2R in model (A); (5)Test the significance of model(B);()0.05α=(6)Find a 95% confidence interval for the coefficient 1β of 1x in model (B); (7)Interpret the confidence coefficient 95% in (6).x 1=national income (100 million yuan) x 2=volume of consumption (100 million yuan) x 3=volume of passengers on railway (ten thousands persons) x 4=length of airline of civil aviation (ten thousands persons) x 5=number of inbound tourist arrivals (ten thousands persons) y=volume of passengers of civil aviation (ten thousands persons)(1)What problem do the VIFs imply? (2)Which regression coefficients may have the wrong sign? (3)Discuss the reasons for the problem in (2).3.(12)Consider the following model (n=8):2012y x x βββε=+++where y=body temperature of a pig (centi) x=time length after the pig is infected (hours)(1)Test the significance of 2x ;()0.05α= (2)Predict body temperature at x=80; (3)If the observations of x lie in (8,64),what ’s your suggestion about the prediction in (2); 4.(18)()()()2,:,,0,,0y X X n p rk X p E Var V V βεεεσ=+⨯===>, (1)Find GLSE for β;(2)Find an unbiased estimator for 2σ.5.(20)Full model ()()112220,,1,2,,,cov ,0,i i i i i i j y x x E i j n i ji j ββεεσεε⎧⎪=++⎪⎪==⎨⎪⎧=⎪=⎨⎪≠⎩⎩subset model ()()1120,,1,2,,,cov ,0,i i i i i j y x E i j n i ji j βεεσεε⎧⎪=+⎪⎪==⎨⎪⎧=⎪=⎨⎪≠⎩⎩(1)Under subset model caculate OLSE 1ˆβfor 1β; (2)Assume full model is true,caculate ()()11ˆˆ,E Var ββ. Attached list:()()()()()0.0250.0250.0250.050.0511 2.201,12 2.1788,5 2.5706,1,11 4.8443,2,12 3.8853t t t F F =====课程编号:MTH17095 北京理工大学2012-2013学年第二学期2010级应用回归分析期末试题A 卷Attached list:()()()0.050.050.041,22 4.30,1,23 4.28,3,22 3.418,F F F ===()()0.0250.02522 2.074,23 2.0687t t ==1.(28)Consider the following model:01122ˆyx x βββ=++,n=25,where y=deliver time (minutes), x 1=number of cases of product, x 2=distance walked by the route driver (feet).Two versions of the model were estimated as follows (the standard errors are in the brackets).(A)12ˆ 2.341 1.6160.014yx x =++ (1.097) (0.171) (0.004)()Re 5784.543,233.732T s SS SS A ==(B) 1ˆ 3.321 2.176yx =+ (1.371) (0.124)()Re 402.134s SS B =(1)Interpret the coefficient of number of cases of product in model (A);(2)Carry out a t-test to test whether for model (A) number of cases of product has a significant effect upon deliver time;()0.05α=(3)Carry out a partial F-test to test whether distance has a significant effect upon deliver time;()0.05α=(4)Test the significance of model(B);()0.05α=(5)Find a 95% confidence interval for the parameter 1β from model (B);(6)Find a 90% Bonferroni confidence interval for the parameter 0β and 1β from model (B); (7)Explain the result in (6).2.(18) Consider the following model:01122ˆyx x βββ=++,n=25,where y=deliver time (minutes), x 1=number of cases of product, x 2=distance walked by the route driver (feet).(1)What are the horizontal scale and vertical scale in the following partial regression plot?What does the plot indicate?(2)It is reported that studentized residual at point 9 9993.2138,0.4983r h ==,where ii h is the ith diagonal element of hat matrix H,and COOK ’s distance 9 3.418D =.Interpret the results. (3)The correlation coefficients 12r between x 1 and x 2 is 120.824r =.What does the result imply? What are sources of the problem?3.(15)To study the relationship between the annual per capita expenditure on education and the annual per capita consumption expenditure,two models are used to fit the data,where y:The annual per capita expenditure on education, x:The annual per capita consumption expenditure.4.(21) Consider the simple linear regression model:011y x ββε=++,with ()()20,E Var εεσ==,and ε uncorrelated.(1)Show ()221R xx E MS S σβ=+; (2) Show ()2Re s E MS σ=.5.(18)A linear regression model is written as follows: 11223344y x x x x ββββε=++++,()()20,E Var εεσ==.The data is shown in the following table:(2)Caculate OLSE 1ˆβ for 1β; (3)Caculate ()1ˆVar β.课程编号:MTH17095 北京理工大学2013—2014学年第二学期2011级应用回归分析期末试题*卷(年份推断为2011,试卷类型未知)附表:()()0.050.0255,10 3.33,10 2.2281F t ==1.(28分)中国民航客运量回归方程为:(括号里是标准误差)12345ˆ450.90.3540.5610.007321.5780.435yx x x x x =+--++, (178.08)(0.085) (0.125) (0.002) (4.030) (0.052)16,13843371.750,13818876.769n SST SSR ===其中:y —民航客运量(万人) x 1—国民收入(亿元) x 2—消费额(亿元)x 3—铁路客运量(万人) x 4—民航航线里程(万公里) x 5—来华旅游入境人数(万人) (1)解释回归方程中民航航线里程的回归系数; (2)检验回归方程的显著性;()0.05α= (3)计算回归方程的决定系数,并作出解释; (4)计算回归的标准误差,解释这一结果; (5)对模型中来华旅游入境人数对民航客运量是否有显著影响进行t-检验; (6)建立x 4的回归系数4β的置信水平为95%的置信区间。