关联规则挖掘英文PPT
- 格式:pdf
- 大小:67.91 KB
- 文档页数:3

![[课件]数据挖掘 8-association rule mining](https://uimg.taocdn.com/35194e0203d8ce2f00662395.webp)
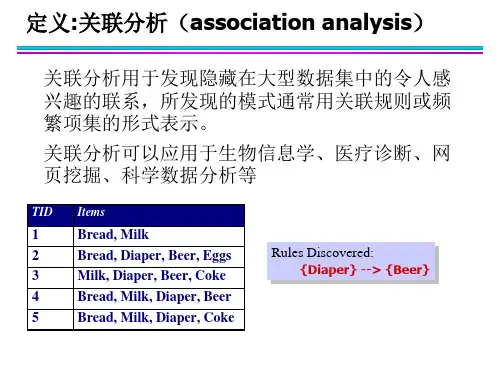
©Wu Yangyang 1OutlineAssociation rule mining (关联规则挖掘)A formal definition (形式化定义)Association rule classification (关联规则分类)Mining single-dimensional Boolean association rules(一维布尔型关联规则挖掘)Problems and solutions(问题与解决办法)6.2.1 A Formal DefinitionA⇒C[50%, 66.67%]Finding interesting associations among sets of data items or6.2.2 Association Rule Classification6.2.3 Mining single-dimensional Boolean association rules(1)6.2.3 Mining single-dimensional Boolean association rules(2) Example:6.2.3 Mining single-dimensional Boolean association rules(3) The Apriori6.2.3 Mining single-dimensional Boolean association rules(4) Algorithm to generate candidates (6.2.3 Mining single-dimensional Boolean association rules(5)Database D6.2.3 Mining single-dimensional Boolean association rules(6) Generating association rule from frequent itemsets©Wu Yangyang 106.2. Association rule mining6.2.4 Presentation of Association Rules(Table Form)6.2 Association rule mining6.2.4 Presentation of Association Rules(Plane Graph)6.2 Association rule mining6.2.4 Presentation of Association Rules(Rule Graph)Discussion(1)Is Apriori Fast Enough?The bottleneck(瓶颈) of Apriori: candidate generationHuge candidate sets(巨大的候选集):104frequent 1-itemset will generate 107candidate 2-itemsetsTo discover a frequent pattern of size 100, e.g., {a1, a2, …, a100}, one needs to generate 2100 ≈1030candidates.Multiple scans of database(多次扫描数据库):Needs (n +1 ) scans, n is the length of the longest patternDiscussion(2)How to Improve Apriori’s Efficiency?Hash-based itemset countingwhen scanning each transaction in the DB to generate L k-1,we can generate all of the k-itemsets for each transaction,hash them into the different buckets of a hash table, and increase thecorresponding bucket counts.A k-itemset whose corresponding hashing bucket count is below thethreshold cannot be frequent, and thus should be removed.Transaction reductionA transaction that does not contain any frequent k-itemset is uselessin subsequent scans.Therefore such a transaction can be marked or removed from further consideration.PartitioningDiscussion(4)Dynamic itemset counting(动态项集记数):Partition database into blocks marked by start points.Add new candidate itemsets only when all of their subsets are estimated to be frequentMining Frequent Patterns Without Candidate Generation:Compress a large database into a compact, Frequent-Pattern tree (FP-tree) structure Mining multilevel, multidimensional, Constraint-based association rules Association analysis in other types of data: spatial data, multimedia data, time series data, etc.Based on quantitative concept lattice。


INFO411/911Laboratory exercises onAssociation Rule MiningOverview:Association rule mining can help uncover relationships between seemingly unrelated data in a transactional database. In data mining, association rules are useful in discovering consequences of commonly observed patterns within a set of transactions.What you need:1.R software package (already installed on the lab computers)2.The file "laboratory_week5.zip" on Moodle.Preparation:1.Work in a group of size two to three (minimum size of a group is two. But no more thanthree students are to work together). Penalties apply if a group exeeds these limits.2.Boot computer into Windows mode.3.Download laboratory_week5.zip then save to an arbitrary folder, say"C:\Users\yourname\Desktop"4.Uncompress laboratory_week5.zip into this folder5.Start "R"6.Change the working directory by entering: setwd("C:/Users/yourname/Desktop")(Note that R expects forward slashes rather than backwars slashes as used by Windows.) Your task:Your are to submit a PDF document which contains your answers of the questions in this laboratory exercise. One document is to be submitted by each group. The header of the document must list the name and student number of all students in the group. Clearly indicate which question you have answered.The following link provides a documentation of the association rule module in R (called arules). The link can help you develop a better understanding of the usage and parameters of the association rule package in R: /web/packages/arules/arules.pdfWork through the following step and answer given questions:Step1: Familiarize yourself with the arules package in R.Start R and type:library(arules)to load the package. We shall start from the analysis of a small file sample1.csv that contains some transactional data. To load data into R enter:sample1.transactions <- read.transactions("sample1.csv", sep=",")To get information about the total number of transactions in a file sample1.csv enter:sample1.transactionsTo get a summary of data set sample1.csv enter:summary(sample1.transactions)The data set is described as sparse matrix that consists of 10 rows and five columns. The density ofthe matrix is 0.48.Next, list of the most frequent items and the distribution of items per transactions. In our case two transactions consist of one item, five transactions consist of two items, two transactions consist of three items and one transaction consists of four items. To discover the association rules enter: sample1.apriori <- apriori(sample1.transactions)The results start from a summary of parameters used for the execution of the Apriori algorithm. Note that a default value for confidence and support is being used. The minimum (minlen) and maximum (maxlen) number of items in an items follows. The default target is rules. It could also be itemsets. The other targets can be set in the call to apriori with the parameter argument which takes a list of keyword arguments. To list the association rules found by Apriori algorithm enter:inspect(sample1.apriori)It is possible to change the values of the parameters support and confidence to get more association rules:sample1.apriori <- apriori(sample1.transactions,parameter=list(supp=0.5,conf=1.0))R's implementation of Apriori algorithm is also capable of processing data stored in a file with transaction ID and a single item per line. For example the file sample2.csv contains the same data as the file sample1.csv. To load such data into R enter:sample2.transactions <-read.transactions("sample2.csv",sep=",",format="single",cols=c(1,2))To discover and to list the association rules found by Apriori algorithm enter:sample2.apriori <- apriori(sample2.transactions,parameter=list(supp=0.5,conf=1.0))inspect(sample2.apriori)Use the data set sample4.csv. To load data into R enter:sample4.transactions <- read.transactions("sample4.csv", sep=",")R should reply with a message: cannot coerce list with transactions with duplicated items. The message means that at least one of the transactions in an input data set has duplicated items. Indeed, a transaction beer, milk, bread, sausage, beer has a duplicated item beer. To eliminate duplicated items load data into R in the following way:sample4.transactions <- read.transactions("sample4.csv", sep=",",rm.duplicates=TRUE)Task1: Visualize the mined association rules from sample1.csv.Compute the association rules of the data in file sample1.csv by setting the support threshold to 0.12 and confidence threshold to 1.0. Show the association rules.Load the association rule visualization module in R:library(arulesViz)Then plot the association rules by usingplot(sample1.apriori,method="graph")Explain what can be seen in this graph.Task2:Mine association rules from the data set words.csv. List information of the transactions included inthe data set and list a summary of the data set. Discover the association rules for the default values of the parameters support and condence. Find the largest values of the parameters support and confidence such that discovery of association rules provides a nonempty set of nontrivial rules (a rule is trivial if its left or right hand side is empty). List the association rule(s) found.Task3:Load the survival data of passangers on the Titanic:load("titanic.raw.rdata")Explain the output shown by the commandstr(titanic.raw)Mine association rules that only have "survived=No" or "Survived=Yes" on the RHS:rules <-apriori(titanic.raw,parameter=list(minlen=2,supp=0.005,conf=0.8),appearance=list (rhs=c("Survived=No", "Survived=Yes"),default="lhs"))Sort by "lift" then show resultsrules.sorted<-sort(rules,by="lift")inspect(rules.sorted)Explain the output shown by the call of "inspect".Create the following two plots then explain what is shownplot(rules)plot(rules,method="graph",control=list(type="items"))Write up all your answers, then submit your answer as a PDF document via the link provided on MOODLE. One submission per group!Submission site closes on Monday 03/April at 23:55。