Comparision of Fixed and Rotating Spray Plate Sprinklers
- 格式:pdf
- 大小:2.59 MB
- 文档页数:10
ArticlePreparation and characterizationof PVAc-MMT-DOABHui-wang Cui1and Guan-ben Du2AbstractPolyvinyl acetate(PVAc)is considered to be a type of environmental friendly adhesive,and montmorillonite(MMT)is a cheap and accessible natural nanomineral.MMT was first organically activated by dioctadecyl dimethyl ammonium bromide(DOAB).The intercalated nanocomposite of MMT-DOAB was added during the synthesis of PVAc in conven-tional laboratory conditions.The PVAc-MMT-DOAB was mainly studied by X-ray diffraction,Fourier transform infra-red spectroscopy,transmission electron microscopy,static tension,and the rheology was also investigated by the power-law function equation and the Cross–Williamson model viscous equation.The exfoliated nanocomposite of PVAc-MMT-DOAB could be obtained.Linear macromolecular chains of PVAc were formed in the layers of MMT-DOAB.MMT-DOAB was exfoliated into nanoparticles of layers or sheets,randomly dispersed in the matrix of PVAc. The particle diameter of MMT-DOAB ranged from25to75nm,they randomly dispersed with PVAc particles.In addi-tion,the smaller MMT-DOAB particles were adsorbed around the bigger PVAc particles;they formed the‘strawberry’structure.PVAc and PVAc-MMT-DOAB were pseudo-plastic non-Newtonian fluids and they all possessed the normal stress effect(or Weissenberg effect),that was the pole-climbing phenomenon.The reasonable addition of MMT-DOAB in polymerization was found to be not more than2.0wt.%of VAc.KeywordsPVAc-MMT-DOAB,chemical structure,dispersion,particles,rheology,static tensionIntroductionPolyvinyl acetate(PVAc)is generally synthesized by the monomer of vinyl acetate(VAc)in the mixture of polyvi-nyl alcohol(PVA)as protective colloid,non-ion emulsifier, initiator and water.PVAc has many characteristics;it is non-poisonous,non-harmful,easily produced,low in price, convenient in application,economizing resources,etc.For this reason it is widely applied in the bonding of many por-ous materials,for example,wood processing,furniture packaging,building decoration,texture bonding,and print bonding.It is considered to be a type of environmental friendly adhesive.Montmorillonite(MMT)is a natural nanomineral.Its crystal structure is a2:1type layered silicate formed by a layer of aluminum(or magnesium)octahedral inserted in the middle of two layers of silicon oxygen tetrahedron. The structural units are joined by the strength among the molecules between layers,so it is very loose.Water or other organic molecules can enter into the layers which can lead to expansion through absorbing water,high dispersion and adsorption,and can also cause it to easily make mud, be activated,organized and modified.MMT has a large number of raw material sources,it is cheap and accessible.Its discovery has been recognized as an historical milestone in the development of nanomater-ials.Now,MMT has been applied in many polymers,such as polyacrylate ester,1,2poly(methyl methacrylate),3,4 polyurethane,5,6epoxy,7,8polyethylene,9,10and polypropy-lene,11,12etc.Ding et al.13–16also reported the application in PVAc,but they mainly focused on the preparation of PVAc-MMT initiated by g-ray radiation intercalation 1College of Wood Science and Technology,Nanjing Forestry University, Nanjing,Jiangsu;College of Wood Science and Technology,Southwest Forestry University,Kunming Yunnan;and Key State Laboratory of New Display and System Applications and Sino-Swedish Microsystem Integration Technology Center,College of Automation and Mechanical Engineering,Shanghai University,Shanghai,China2College of Wood Science and Technology,Nanjing Forestry University, Nanjing,Jiangsu,and College of Wood Science and Technology,South-west Forestry University,Kunming,Yunnan,ChinaCorresponding Author:Hui-wang Cui,College of Wood Science and Technology,Nanjing For-estry University,Nanjing210037,Jiangsu,ChinaEmail:cuihuiwang@High Performance Polymers23(1)40–48ªThe Author(s)2011Reprints and permission:/journalsPermissions.navDOI:10.1177/0954008310384288polymerization and the co-blending of PVAc-MMT with high density polyethylene.In the present study,MMT was organically activated by dioctadecyl dimethyl ammonium bromide(DOAB)according to Cui and Du,17the interca-lated nanocomposite of MMT-DOAB was obtained.Under conventional conditions in the laboratory,with no ultraso-nic dispersion and no radiation,PVAc-MMT-DOAB was prepared by VAc and MMT-DOAB.The influence of the variable addition of MMT-DOAB on the properties of PVAc-MMT-DOAB was investigated mainly by X-ray dif-fraction(XRD),Fourier transform infrared spectroscopy (FTIR),transmission electron microscopy(TEM)and static tension.Its rheology was also investigated by the power-law function equation and the Cross–Williamson model viscous equation.ExperimentSamplesSamples0g(0.25,0.50,0.75,1.00,1.25,1.50,1.75,2.00, 2.25,2.50g)of MMT-DOAB(The additions were0,0.5, 1.0,1.5,2.0,2.5,3.0,3.5,4.0,4.5,and5.0wt.%of VAc.) was immersed into25.00g of VAc for24h.It was then mixed with70.00g of10%PVA solution,0.50g of alkyl-phenol polyoxyethylene(10)ether,3.75g of10%ammo-nium persulfate solution,6.25g of sodium lauryl sulfate and250g of water while stirring vigorously for8h.When the mixture became a homogeneous emulsion,the tempera-ture rose to70 C.While stirring vigorously,3.75g of10% ammonium persulfate solution and25.00g of VAc were gradually added into the homogeneous emulsion in6h for polymerization.Subsequently,the temperature rose to 85–90 C,the emulsion further polymerized for0.5–1h. After polymerization,the temperature dropped to below 50 C,4.00g of ethanol,3.00g of water,0.30g of sodium benzoate,0.18g of sodium bicarbonate,and6.00g of di-n-butyl phthalate were added into the emulsion. Finally,PVAc and PVAc-MMT-DOAB were obtained. PVAc was the PVAc-MMT-DOAB whose MMT-DOAB addition was0wt.%of VAc.Apparent viscosityThe samples were tested by NDJ-1rotary viscometer,the shear rate(g)was0.63,1.26,3.14,6.28sÀ1,respectively. The apparent viscosity(Z,mPa s)under different shear rates could be obtained.Solid contentThe solid content(O,%)was calculated byO¼m1Àm2m1Â100%where m1(g)is the original weight of samples,and m2(g)isthe weight of samples dried for1h at105 C.X-ray diffractionThe samples were tested by DX-2000of XRD underCu K a of radiating,40kV tube voltage,30mA tubecurrent,scanning from0.5to15 at rate of0.02 sÀ1,andl¼1.54184A˚of wavelength.The large value of d(001)forMMT is calculated by Bragg law of l¼2d sin y,where l isthe wavelength representing the intensity of X-ray,dis the distance between layers of MMT,and y is the dif-fraction angle.Fourier transform infrared spectroscopyThe samples mixed with the kalium bromatum powderwere pressed into plates,and then tested by the NICOLET380FTIR spectroscope.Transmission electro microscopySamples were observed by JEM-3100F TEM,theamplification was20000times.DispersionThree to five drops of PVAc or PVAc-MMT-DOAB wereadded to20mL of water in a glass dish(diameter90mm).When they became homogeneous,the dispersion could beobserved with water as reference.Static tensionPVAc and PVAc-MMT-DOAB were made into films of50mmÂ10mmÂ0.5mm.After drying to constantweight at room temperature,they were tested by SANSCMT5000computer-controlled electronic universal test-ing machine under a tension rate of10mm minÀ1at a testtemperature of25 C.The test should be finished in10min.The test pattern is shown in Figure1.Storage timeThe glue was stored away from light at room temperatureuntil it appeared as a gel and/or delamination.The cyclewas the storage time(S,days).Results and discussionChemical structureIn the study,many different amounts of MMT-DOAB wereadded in VAc for polymerization,and different samples ofPVAc-MMT-DOAB were obtained.However,for the char-acterization of chemical structure,only some samples wereselected.Those selected were MMT,PVAc,MMT-DOABCui and Du41and PVAc-MMT-DOAB (MMT-DOAB addition was 2.0wt.%).As shown in Figure 2,the diffraction peaks representing d (001)of layers for MMT and MMT-DOAB appeared in XRD patterns,their 2y values were 7.00and 2.22 ,their d (001)were 1.263and 3.980nm,respectively.17However,there was no diffraction peak from 1to 12 of 2y for PVAc-MMT-DOAB.This phenomenon showed that the linear macromolecular chains of PVAc were formed in the layers of MMT-DOAB.The DOAB was a kind of long alkyl chain quaternary ammonium salt,its cations arranged with the paraffin-type molecular structure in the layers of MMT,so it was greatly exfoliated into layers or sheets of nanoparticles,randomly dispersed in the matrix of PVAc as shown in Figure 3.The exfoliated nanocomposites of PVAc-MMT-DOAB could be obtained.In addition,PVAc and PVAc-MMT-DOAB were also tested by FTIR.The results are shown in Figure 4.From the figure,there was no chemical bond between MMT-DOAB and PVAc,but there was physical effect.The absorption bands of PVAc-MMT-DOAB were stacked by that of MMT-DOAB and PVAc.No new absorption bands formed,nor existing absorption bands disappeared.They also showed that MMT-DOAB was greatly exfoliated into sheets or layers of nanoparticles,randomly dispersed in the matrix of PVAc.The results coincided with XRD results.The absorption bands of PVAc-MMT-DOAB are shown as follows:the wide absorption peaks of symmetrical stretching vibration and asymmetrical stretching vibration of –OH near 3400cm –1for liquid water,the dual absorp-tion peaks of symmetrical and asymmetrical stretching vibration of –CH 2near 2920–2840cm À1,the absorption peaks of stretching vibration of Si–H near 2360–2100cm À1,the absorption peaks of double bonds stretching vibration of C–O near 1730cm À1,the weak absorption peaks ofdouble bonds stretching vibration of –C–C–and the absorption peaks of deformation vibration of benzene ske-leton near 1680–1620cm À1,the absorption peaks of sym-metrical and asymmetrical deformation vibration of –C–CH 3and symmetrical deformation vibration of –CH 2–near 1450–1370cm À1,the absorption peaks of symmetrical stretching vibration and asymmetrical stretching vibration of two to three –C–O–C–representing ester bands in 1300–1010cm À1,the absorption peaks of asymmetrical stretching vibration of Si–O–Si near 1010cm À1,the absorption peaks of stretching vibration of Al–O–H near 920cm À1,the absorption peaks of stretching vibration of Fe–O–H near 890cm À1,the absorption peaks of stretching vibration of Mg–O–H near 790cm À1,the absorption peaks of out-of-plane bending vibration of ¼C–H in olefins and C–H in aromatics,the weak absorption peaks of rocking vibration of ortho-disubstituted in benzene ring and –(CH 2)n (n !4)near 750cm À1.Dispersion and particlesFor the reasons mentioned above,the selected samples were PVAc and PVAc-MMT-DOAB (MMT-DOAB addi-tion was 2.0wt.%)for the characterization of dispersion and particles.Visually,PVAc and PVAc-MMT-DOAB were the same.They were viscous,milk-white,homoge-neous and fine emulsions and they had no coarse particles,no foreign bodies and no delamination.However,when some were dropped in water,their dispersion was a little different to that shown in Figure 5.The figure shows some coarse particles in the dispersion of PVAc referred to water,but not PVAc-MMT-DOAB.The dispersion of PVAc-MMT-DOAB was much better.The PVAc and PVAc-MMT-DOAB were further observed by TEM to investigate their particles.The results are shown in Figure 6.From the TEM comparison of PVAc and PVAc-MMT-DOAB,the differences were clearly apparent.The larger particles were PVAc,their diameter was from 250to 500nm.The smaller particles were MMT-DOAB,their diameter was from 25to 75nm.TEM also showed that MMT-DOAB particles randomly dis-persed with PVAc particles,this phenomenon coincided with the results of XRD and FTIR.In addition,a ‘straw-berry’structure was also found in the dispersion.This structure was only mentioned by Ray and Bousmina.18As shown in Figure 6,the smaller MMT-DOAB particles were adsorbed around the bigger PVAc particles.They formed the ‘Strawberry’structure.RheologyThe apparent viscosities under different shear rate tested by NDJ-1rotary viscometer are shown in Table 1.The table shows how Z increased with the increase of the addition of MMT-DOAB in the polymerization of PVAc,toaFigure 1.Diagram of static tension.42High Performance Polymers 23(1)maximum at the addition of 2.0wt.%.In the range of addition from 2.5to 5.0wt.%,Z displayed little change,indicating that the excess MMT-DOAB addition more than 2.0wt.%of VAc would only very weakly affect the apparent viscosity.Therefore,the reasonable addition of MMT-DOAB in polymerization was not more than 2.0wt.%of VAc.They also indicated that MMT-DOAB could improve the apparent viscosity of PVAc.Moreover,the table also shows that Z decreased with the increase of shear rate.This phenomenon indicated that both PVAc and PVAc-MMT-DOAB were pseudo-plastic non-Newtonian fluids.As already known,a pseudo-plastic fluid is one of the most common non-Newtonian fluids.Rubber,most polymers and their plastic melt and concentrated solution are all pseudo-plastic fluids.Their characteristic is that the apparent viscosity decreases with the increase of shear rate.The orientation of the slender molecular chains of polymer in the flow direction as shown in Figure 7causes the decrease of viscosity,so it is often called shear thinning fluid.The rheology of pseudo-plastic non-Newtonian fluid is always described by the power-law function equationt ¼€Ig i where t is the shear stress,€I(Pa s)is the fluid consistency,g (s À1)is the shear rate,i is the flow index,also called the non-Newtonian index.The bigger that €Iis,the more viscous is the fluid.Index i is used to judge the difference between fluid andNewtonian fluid.If i is further away from 1,the non-Newtonian behavior is more obvious.For the Newtonianfluid i ¼1,then €Iis equivalent to Newtonian viscosity (m );for the pseudo-plastic fluid,i <1.Compare the power-law function equation with the Newtonian fluid flow equation,t ¼mgCombine them into the equation:t ¼€I g i À1ÀÁgandmake:Figure 2.XRDpatterns.Figure 3.Exfoliation.Cui and Du 43Figure4.FTIRspectra.(a)(b)(c)Figure5.Dispersion.(a)water:(b)PVAc;(c)PVAc-MMT-DOAB.Figure6.TEM images(a)PVAc;(b)PVAc-MMT-DOAB.44High Performance Polymers23(1)Z¼€I g iÀ1The power-law function equation can be written as:t¼Zgwhere Z is the apparent viscosity of non-Newtonian fluid, namely the tested viscosity(Pa s or mPa s).For Newtonian fluid and pseudo-plastic fluid,the relation among their zero shear viscosity(Z0),Z,and limit viscosity(Z1)under lower g is Z0>Z>Z1,and Z1¼0.According to the Cross–Williamson model viscous equationZ¼Z0 1þBgj jZ0is as followsZ0¼Z1þBgj j1Àiwhere B(s)is the characteristic time of materials.The polymer has a critical molecular weight(M c),when the weight average molecular weight(M w)<M c,Z0is pro-portional to M w;when M w>M c,Z0has the3.4exponential relationship with the increase of M w.They illustrate that a large number of entanglement zones are formed among the polymer chains.The substantial increase in viscosity is due to the contribution of the number of entangled points in entanglement zones and the maximum molecular weight. That is related to M w.Their relationship can be expressed as follows:Z0¼K1M wðM w<M cÞZ0¼K2M3:4wðM w>M cÞwhere K1and K2are the empirical constants,K1is about 1–1.6,and K2is about2.5–5.0.For the linear and narrow width molecular weight polymer,the relation between M w and number average molecular weight(M n)is M w%M n when M w<M c;the relation is M w/M n<2when M w>M c.From the above calculations,the rheological results of PVAc-MMT-DOAB are shown in Table 2.From the table,i was always the same regardless of the addition of MMT-DOAB.It was0.93and less than1,so PVAc and PVAc-MMT-DOAB were pseudo-plastic non-Newtonian fluids.€I,B,Z0,M w,and M n increased with the increase of the addition of MMT-DOAB in the polymerizationTable1.Apparent viscosities.Z(mPa s)MMT-DOAB/VAc(wt.%)0(PVAc)0.5 1.0 1.5 2.0 2.5 3.0 3.5 4.0 4.5 5.0g(sÀ1)0.6315151921232221202121201.2614141820222120191920203.1413131719222120191919196.281313161820191817181817(a)(b)Figure7.Rate distribution of extensional flow and shear flow:(a)extensional flow;(b)shear flow.Long arrows indicate flowdirection.Table2.Rheological results.ItemsMMT-DOAB/VAc(wt.%)0(PVAc)0.5 1.0 1.5 2.0 2.5 3.0 3.5 4.0 4.5 5.0i0.930.930.930.930.930.930.930.930.930.930.93€I(mPa s)1414182023222120202020B(s) 4.6Â1012 2.5Â1017 1.3Â10187.3Â1018 3.7Â1019 5.8Â10199.5Â1019 1.7Â1020 1.4Â1020 1.1Â1020 1.7Â1020 Z0(mPa s) 1.2Â102 2.5Â102 3.6Â102 4.5Â102 5.5Â102 5.5Â102 5.4Â102 5.3Â102 5.4Â102 5.4Â102 5.4Â102 Z1(mPa s)00000000000M w(kg molÀ1) 1.0Â102 2.0Â102 2.9Â102 3.7Â102 4.5Â102 4.5Â102 4.4Â102 4.3Â102 4.4Â102 4.4Â102 4.4Â102 M n(kg molÀ1) 1.0Â102 2.0Â102 2.9Â102 3.7Â102 4.5Â102 4.5Â102 4.4Â102 4.3Â102 4.4Â102 4.4Â102 4.4Â102 Cui and Du45of PVAc.All were at a maximum at the addition of2.0wt.%except B .Their maximum were 23mPa s (€I),5.5Â102mPa s (Z 0),4.5Â102kg mol À1(M w ),and 4.5Â102kg mol À1(M n ),respectively.In the range of additions from 2.5to 5.0wt.%,there was little change.The trend was similar to that of the apparent viscosity.Parameter B is a characteristic constant of materials,it is always expressed by time,usually measured in seconds.The value of B for PVAc was the minimum,it was 4.6Â1012s.The value of B for PVAc-MMT-DOAB was much bigger than that of PVAc,it was always varying,sometimes it was big whereas at other times it was small.As previously set,Z 1was always 0mPa s whether for PVAc or PVAc-MMT-DOAB.This indicated that an excess MMT-DOAB addition of more than 2.0wt.%of VAc would have little influence on the rheology of PVAc-MMT-DOAB.Therefore,a reasonable addition of MMT-DOAB in polymerization was not more than 2.0wt.%of VAc.This coincided with the results obtained above.In other words,MMT-DOAB could improve the rheology of PVAc.In addition,as with other polymers,both PVAc and PVAc-MMT-DOAB also possessed the normal stress effect,which was the pole-climbing phenomenon.It is also called the Weissenberg effect as shown in Figure 8.When non-Newtonian fluid is in shear flow,the cut incline flow units possess the elastic restoring force,so the package-axis pole-climbing phenomenon appears.The fluid climbs higher up the column as the rotary rate increases.This is closely related with the shear rate distri-bution when the fluid flows as shown in Figure 7.From Table 3,it can be seen that the solid content of PVAc-MMT-DOAB was also maximum at the addition of 2.0wt.%,when it was 15.47%.There was also little change in the range of the addition from 2.5to 5.0wt.%.The storage time of PVAc and PVAc-MMT-DOAB was good,all at more than 180days.This showed their storage stability was very great.Static tensionIn the static tension test,the results obtained were only the maximum break force of PVAc and PVAc-MMT-DOAB films.Many other static tension data could be calculated from the maximum break force through equations.The static tension strength (or static tension stress)rep-resented by s (MPa ¼N mm À2)is calculated bys ¼F =Swhere F (N)is the maximum break force,and S (mm 2)is the cross-sectional area of the samples.The break elongation represented by e t (%)and the break strain represented by e (mm mm À1)are calculated byE t ¼l Àl 0ðÞ=l 0Â100%E ¼l Àl 0ðÞ=l 0where l 0(mm)is the original length of samples,and l (mm)is the break length of samples.The elastic modulus is represented by E 0(MPa).It is cal-culated by Hooke’s law from the initial linear part of the s Àe curve as shown in Figure 9.E 0¼s =Ewhere s is the stress (N mm À2),and e is the strain (mm mm À1).When material is under tension or compression,it experiences not only the vertical deformation along longi-tudinal direction,but also simultaneously the horizontal deformation as it is reduced or increased along a transverse direction.In the elastic deformation range,the horizontal strain (e y )is proportional to the vertical strain (e x ),the ratio is known as Poisson’s ratio (n )of material.It is generally calculated by the following equation:n ¼E y E x where e x ¼e ,e y ¼(b Àb 0)/b 0,where b 0is the original width (mm)of samples,and b is the break width (mm)of samples.The results of static tension calculated with the above equations are shown in Table 4.s of PVAc-MMT-DOAB was 5.21–6.14MPa,which is 2.52–2.97times that of PVAc’s 2.07MPa.Its e was 2.12–2.35mm mm À1,which is 1.10–1.22times that of PVAc’s 1.92mm mm À1.There-fore,E 0of PVAc-MMT-DOAB was still higher,it was 2.46–2.73MPa,which is 2.27–2.53times that of PVAc’s 1.08MPa.The e t of PVAc-MMT-DOAB was 212–235%,which is 1.10–1.22times that of PVAc’s 192%.Their e x were different as well as e ,their e y was almost the same,one was 0.30mm mm À1,and the other was 0.20mm mm À1,so their n must be greatly different.The value of n of PVAc-MMT-DOAB was 0.09,and that of PVAc was 0.16.All indicated that the static tension properties ofPVAc-(a)(b)Figure 8.Changes of the fluid liquid in cups when rotating:(a)Newtonian fluid;(b)melt and concentrated solution of polymer.46High Performance Polymers 23(1)MMT-DOAB were much better than that of PVAc.This is because:(1)MMT-DOAB was greatly exfoliated into nanoparticles of layers or sheets,randomly dispersed in the matrix of PVAc,(2)the smaller MMT-DOAB particles were adsorbed around the bigger PVAc particles to form the‘strawberry’structure,and(3)MMT possessed small size effect as a natural nanomineral.In a word,the static tension properties of PVAc were greatly improved because of the addition of MMT-DOAB in polymerization.In addition,the static tension properties of PVAc-MMT-DOAB were best when the addition of MMT-DOAB increased to2.0wt.%.As shown in Table4,in the range of2.5–5.0wt.%of the addition of MMT-DOAB,s,e,e x,e t,and E0showed little change,whereas e y was0.20mm mmÀ1and n was0.08or0.09all the time.There-fore,the reasonable addition of MMT-DOAB in polymer-ization could be concluded from the above results to be not more than2.0wt.%of VAc.ConclusionsIn the synthesis,MMT-DOAB was added and polymerized with VAc.From the analysis of XRD,FTIR,TEM,static tension,and the rheology investigated by the power-law function equation and the Cross–Williamson model viscous equation,the following conclusions were obtained. The exfoliated nanocomposite of PVAc-MMT-DOAB was obtained.The linear macromolecular chains of PVAc were formed in the layers of MMT-DOAB.There was no chemical bond between MMT-DOAB and PVAc,but there was a physical effect.MMT-DOAB was exfoliated into nanoparticles of layers or sheets,randomly dispersed in the matrix of PVAc.The dispersion of PVAc-MMT-DOAB was better than that of PVAc.The particle diameter of PVAc was from 250to500nm whereas the MMT-DOAB particle dia-meter was from25to75nm.The MMT-DOAB parti-cles randomly dispersed with PVAc particles.InTable3.Solid content and storage time.ItemsMMT-STAB/VAc(wt.%)0(PVAc)0.5 1.0 1.5 2.0 2.5 3.0 3.5 4.0 4.5 5.0O(%)13.3514.0115.0215.0715.4715.3315.2315.2115.1115.0915.03 S(days)!180!180!180!180!180!180!180!180!180!180!180 Table4.Static tension.MMT-DOAB/VAc(wt.%)PVAc-MMT-DOABs(MPa)e(e x)(mm mmÀ1)e y(mm mmÀ1)e t(%)E0(MPa)n0(PVAc) 2.07 1.920.30192 1.080.16 0.5 5.21 2.120.20212 2.460.090.5 5.81 2.130.20213 2.730.091.0 5.972.210.20221 2.700.091.5 6.032.310.20231 2.610.092.0 6.14 2.350.20235 2.610.092.5 6.14 2.350.20235 2.610.093.0 6.14 2.350.20235 2.610.093.5 6.12 2.350.20235 2.600.094.0 6.12 2.340.20234 2.620.094.5 6.13 2.350.20235 2.610.095.06.14 2.350.20235 2.610.09 Note:Each data in Table4was averaged from20sets ofresults.Figure9.Typical s–e curves.Cui and Du47addition,the smaller MMT-DOAB particles were adsorbed around the bigger PVAc particles to form the ‘strawberry’structure.MMT-DOAB could improve the rheology of PVAc.The PVAc and PVAc-MMT-DOAB were pseudo-plastic non-Newtonian fluids,their i was0.93.Z,€I,B, Z0,M w,M n,and O increased with the increase of the addition of MMT-DOAB in the polymerization.All were at a maximum at the addition of2.0wt.%exceptB.The value of Z1was0mPa s all the time whether forPVAc or PVAc-MMT-DOAB.Their storage stability was very great.Both PVAc and PVAc-MMT-DOAB possessed the normal stress effect(or Weissenberg effect)in the pole-climbing phenomenon.The static tension properties of PVAc-MMT-DOAB were much better than that of PVAc.Its E0was2.27–2.53times that of PVAc,its e t was1.10–1.22times that of PVAc, and its n was0.09,whereas the n value for PVAc was0.16.The appropriate addition of MMT-DOAB in poly-merization was not more than2.0wt.%of VAc.AcknowledgementsThe authors are grateful for the financial support of the Program for New Century Excellent Talents in University of the Ministry of Education of China(NCET-06-0825).References1.Ray S,Bhowmick AE.Synthesis characterization and proper-ties of montmorillonite clay-polyaerylate hybrid material and its effect on the properties of engagechy hybrid composite.Rubber Chem Tech2001;74:835–845.2.Ye L-X,Zhong A-Y,Chen D-B,Yang F,An B.Preparationand rheologic behavior of MMT laminating adhesive.Chem Res Applic2004;16:219–221.3.Essawy H,Badran A,Youssef A,Abd El-Hakim A E.Synth-esis of poly(methyl methacrylate)/montmorillonite nanocom-posites via in situ intercalative suspension and emulsion polymerization.Polym Bull2004;53:9–17.4.Tanog˘lu M,Ergu¨n Y.Porous nanocomposites preparedfrom layered clay and PMMA[poly(methyl methacrylate)].Compos Part A2007;38:318–322.5.Deng X-H,Liu F,Luo Y-F,Chen Y,Jia D.Preparation,structure and properties of comb-branched waterborne poly-urethane/OMMT nanocomposites.Prog Organ Coat2007;60:11–16.6.Esposito Corcione C,Prinari P,Cannoletta D,Mensitieri G,Maffezzoli A.Synthesis and characterization of clay-nanocomposite solvent-based polyurethane adhesives.Int J Adhes Adhes2008;28:91–100.7.Kommann X,Lindberg H,Berglund LA.Synthesis of epoxy-clay nanocomposites:influence of the nature of the clay on structure.Polymers2001;42:1303–1310.8.Cui J-W,Yu L-X,Zhang C-L,Mi X-Y,Fu T-Z,Na H.Studieson epoxy resin/montmorillonite nanocomposites cured with 4,40-diamino diphenyl ether diphenyl ketone.Chem J Chinese U2007;28:592–595.9.Zhao H-C,Yang F,Zhang X.-Q,et al.Preparation and char-acterization of polyethylene/montmorillonite nanocompo-sites via in situ polymerization.Polym Mater Sci Eng2004;20:63–65,69.10.Zhao C,Qin H,Gong F,Feng M,Zhang S,Yang M.Mechanical,thermal and flammability properties of poly-ethylene/clay nanocomposites.Polym Degrad Stabil2005;87:183–189.11.Qin H,Zhang S,Zhao C,Hu G,Yang M.Flame retardantmechanism of polymer/clay nanocomposites based on poly-propylene.Polymers2005;46:8386–8395.12.Chen K,Yang RC,Cheng SW.Research on tribologicalbehavior of OMMT/polypropylene composites.Tribology 2006;26:561–565.13.Ding Y-S,Zhang Z-C,Liu Y-J,Shi T-J.Preparation and char-acterization of PVAc/montmorillonite nanocomposites initi-ated by radiation polymerization.Acta Polym Sin2002;18: 504–508.14.Ding Y-S,Zhang Z-C.Study on the blend of HDPE andPVAc-montmorillonite nanocoposite prepared via-ray irra-diation.J Radiat Res Radiat Process2004;22:193–196. 15.Ding Y-S,Zhang Z-C.Studies on the blend composed ofHDPE,PA6and PVAc-montmorillonite nanocomposite pre-pared via g-ray irradiation.Chem J Chinese U2004;25: 1351–1354.16.Ding Y-S,Zhang Z-C.Effects of MMT nanoparticles on thecrystallinity of HDPE in PVAc-MMT/PA-6/HDPE blends.Polym Mater Sci Eng2005;21:256–259.17.Cui H-W,Du G-B.Influences of long alkane chain quatern-ary ammonium salts on the structure of layers in OMMT.Non-Metallic Mines2009;32:17–20,24.18.Ray SS,Bousmina M.Biodegradable polymers and theirlayered silicate nanocomposites:In greenng the21st century materials world.Prog Mater Sci2005;50:962–1079.48High Performance Polymers23(1)。
Progress in Polymer Science 36 (2011) 191–217Contents lists available at ScienceDirectProgress in PolymerSciencej o u r n a l h o m e p a g e :w w w.e l s e v i e r.c o m /l o c a t e /p p o l y s ciChemical reactions of polymer crosslinking and post-crosslinking at room and medium temperatureGuillaume Tillet ∗,Bernard Boutevin,Bruno Ameduri ∗Ingénierie &Architectures Macromoléculaires,Institut Charles Gerhardt,UMR 5253,ENSCM 34296Montpellier Cedex,Francea r t i c l e i n f o Article history:Received 1February 2010Received in revised form 29July 2010Accepted 19August 2010Available online 21 September 2010Keywords:CrosslinkingPost-crosslinking PolymerFunctional groupsa b s t r a c tThis review focuses on various strategies that enable the crosslinking and post-crosslinking of polymers,excluding crosslinking obtained by radiation (e.g.,X-ray,UV,etc.)and that at high temperature.The review is divided into two main parts:systems enabling crosslinking at room temperature and those for which crosslinking occurs at intermediate temperatures (<150◦C).In the first part,various key functional groups can be used,such as (i)carboxylic acid involving reactions with compounds that bear carbodiimide or aziridine functions;(ii)acetoacetyl groups (with isocyanate,activated alkenes,aldehyde,amine functions);(iii)reactions involving activated amines with carbonyl functions (aldehydes,ketones,etc.);(iv)species bearing acetals as pH-sensitive crosslinking agents since they are stable in basic medium but they can self react under acidic conditions;(v)acrylamide functions which are able to self-crosslink;(vi)crosslinking agents able to react with water (such as species that bear a poly(alkoxy)silane for sol–gel process)and derivatives containing isocyanate functions and (vii)systems that require oxygen,for example polymers bear-ing double bonds,boranes for generating hydroperoxides and acetylenic functions which undergo acetylenic coupling.The second series of systems,used at higher temperatures (yet below 150◦C)involving the following key functions:(i)carboxylic acid that react with oxazoline,or epoxide function where specific catalysts are necessary;(ii)alcohols react-ing with protected urethanes,azlactones and methylol amide (for coating applications);(iii)azetidines (obtained from a cyclic amine onto an activated double bond)which self-crosslink;(iv)reversible Diels–Alder reaction (such as furane/bismaleimide reaction),and (v)Huisgen reactions between azido and triple bond.Various examples are presented,along with a discussion of their properties and applica-tions.© 2010 Elsevier Ltd. All rights reserved.Contents 1.Introduction (192)2.Crosslinking and post-crosslinking.................................................................................................1932.1.Crosslinking at room temperature..........................................................................................1932.1.1.Carboxylic acid ....................................................................................................193∗Corresponding authors at:Ecole Nationale Supérieure de Chimie de Montpellier,Ingénierie &Architectures Macromoléculaires,8Rue de l’Ecole Normale,34296Montpellier Cedex 5,France.E-mail addresses:guillaume.tillet@enscm.fr (G.Tillet),bruno.ameduri@enscm.fr (B.Ameduri).0079-6700/$–see front matter © 2010 Elsevier Ltd. All rights reserved.doi:10.1016/j.progpolymsci.2010.08.003192G.Tillet et al./Progress in Polymer Science36 (2011) 191–2172.1.2.Aceto acetyl function[24–31] (194)2.1.3.Amines[32–40] (196)2.1.4.Acetal function[41–45] (198)2.1.5.Acrylamide derivative[46–50] (199)2.1.6.Other crosslinking moieties (199)2.1.7.Conclusion (205)2.2.Crosslinking at intermediate temperatures (205)2.2.1.Carboxylic acid function (206)2.2.2.Alcohol function[138–139] (207)2.2.3.Azetidine functions[166–169] (210)2.2.4.Diels–Alder reactions[170–176] (210)2.2.5.1,3-Dipolar cycloaddition and“click chemistry”reaction[177–187] (213)2.2.6.Conclusion (213)3.Conclusion (213)References (213)1.IntroductionImprovement of the thermal,mechanical,physico-chemical properties of polymers is a crucial challenge in both synthesis(by the insertion of a key function)and the quest for new search applications.Hence,researchers are in a scientific,economical and environmental context in which both modification and improvement of known polymers are preferred rather than the synthesis of poly-mers from new monomers.The properties of a polymeric material depend on its chemical nature,but,for a given polymer type,they also depend on their molecular weight and the functions borne by the polymer chain.In addition to the overall properties,the mechanical properties which are regarded as the most important features of a material are of particular interest.In this context,polymeric mate-rials can be conveniently divided into two main categories, dependent on their molecular weight:-Those with a molecular weight higher than about 105g mol−1;this value is not a strict limit since it depends on materials and on the intermolecular interactions which occur in these materials;-Those which have low molecular weights,lower than 104g mol−1,often in the range of2–3.103g mol−1.According to the category,it is may be essential to carry out either crosslinking or post-crosslinking.Indeed,poly-mer materials in the lower molecular-weight range often require a crosslinking step to obtain satisfactory mechani-cal properties.It is useful to recall the definitions and differences between crosslinking and post-crosslinking,the main dif-ference arising from the way the material is processed. To obtain afinal material in one step,either a very high molecular-weight material or a directly crosslinkable oligomer has to be used to fulfill the targeted prop-erties.The preparation of an easily processed material requires the synthesis of an easily stored material possess-ing intermediate properties.If the desired performance is not reached,a further step to a post-crosslinking may be required,even though that thefirst step may have yielded a pre-crosslinked material.These statements concern all materials but they can be especially relevant for coatings since they must be deposited while they have no(or at most a few)crosslinks,to be crosslinked after they have been applied.Since thefields of applications are various and numer-ous,crosslinking or post-crosslinking reactions have been intensively studied for a long time,and continue to this date.Studies to tune polymerization and crosslinking have as objectives methods to control when and at which rate both these steps take place,and how they can occur either separately or simultaneously.Different types of crosslinkings are possible:(i)covalent crosslinking(which is regarded as the moststable),(ii)ionic bonds,and(iii)physical crosslinking(via Van der Waals,hydrogen bonds or other interactions).One of the most important parameters is,of course, the functionality of the reagents(oligomers and diluents) since crosslinked polymers are usually produced when this functionality is higher than two(even slightly so).Reactive groups are often introduced into the polymeric chains in the case of post-crosslinking.The reactivity and reaction rate of these groups can be controlled by different means: (i)temperature,(ii)radiation,(iii)external reactants(such as moisture,O2,H2O,etc.), (iv)processing.The objective of this review is to provide basic informa-tion to understand the phenomena of crosslinking,without claiming to be exhaustive in that very widefield.The focus is on some basic chemical reactions involving sim-ple reactants,such as water or oxygen,but also some more complex reactants bearing key or specific functions.Vari-ous crosslinking and post-crosslinking processes have been excluded,such as those involving radiation,e.g.,ultravio-let beams,which are commonly used to harden coatings (paints,varnishes,etc.),or␥-rays,electron beams,ozone, X-rays,etc.;many reviews have already been published on these methods[1–4].G.Tillet et al./Progress in Polymer Science36 (2011) 191–217193NomenclatureAAEM acetoacetoxyethyl methacrylateAA acrylic acidATRP atom transfer radical polymerizationBH blocking agentCHA N-cyclohexylazetidineDBN1,5-diazabicyclo(4.3.0)non-5-eneDBU1,8-diazabicyclo(5.4.0)undec-7-eneEPA Environmental Protection AgencyGMA glycidyl methacrylateHEA2-hydroxyethyl acrylateHighlink®AG acrylamidoglycolic acid monohydrate Highlink®DMH N-(2,2 -hydroxy-1-dimethoxyethyl)acrylamideHMM hexamethylol melamineHPBd hydrogenated polybutadieneIBMA isobutoxymethylacrylamideIPDI isophorone diisocyanateMAA methacrylic acidMAAMA N-(2,2-dimethoxyethyl)methacrylamideMAGME N-(methoxy methyl acetate)acrylamideMMA methyl methacrylateNMA N-methylolacrylamidePAEK polyaryletherketonePCL polycaprolactonePDMS polydimethyl siloxanePEO polyethylene oxidePEs polyesterPFCB perfluorocyclobutanePHEMA polyhydroxyethyl methacrylatePMDETA pentamethyldiethylene triaminePMMA polymethyl methacrylatePMVE perfluoromethyl vinyletherPS polystyrenePTFE polytetrafluoroethylenePTMO polytetramethylene oxidePVAc polyvinyl acetateR F perfluoroalkylREACH registration,evaluation,authorisation andrestriction of chemicalsTEOS tetraethoxysilaneTGIC triglycidyl isocyanurateTMEDA tetramethylethylenediamineTMG tetramethylguanidineTMI®m-isopropenyl-␣,␣-dimethylbenzylisocyanateVDF vinylidenefluoride2.Crosslinking and post-crosslinkingFor simplicity,the discussion of crosslinking and post-crosslinking reactions in the following is categorized by types of chemical functions,and discussed successively in two cases,according to the temperature range of the dif-ferent reactions:(i)room temperature,(ii)intermediate temperature below150◦C.2.1.Crosslinking at room temperatureCrosslinking reactions at room temperature are inter-esting for various reasons,such as network development in a heating-sensitive system or to gain energy savings. Several of these are discussed in the following.2.1.1.Carboxylic acidTwo main intermediates are considered as crosslinking agents in this type:carbodiimides(the most common used) and aziridines.2.1.1.1.Carbodiimides[5–18].The use of carbodiimide as a crosslinker agent has been known since the late1960’s[5], though deeper investigations started in1980’s[6,7].The general reaction involves the condensation of a carbodi-imide reactant with a carboxylic acid,leading to an acetyl urea,as shown in Fig.1.Such a condensation does not require any catalyst and this represents an advantage.However,in the presence of moisture,this reaction also competes with the classic reac-tivity of carbodiimides,which are able to trap water and consequently generate anhydride acid and urea,as shown in Fig.1.Nevertheless,by adapting appropriate catalysis and reaction conditions,the reaction is directed towards the synthesis of N-acyl urea.In this way,Taylor and Basset [8]have shown that the N-acyl urea/anhydride acid ratio increased on increasing the solvent polarity,the temper-ature,or even pouring a base into the reaction mixture. Moreover,their studies also reported that above150◦C,N-acyl urea structure is not stable and this limits their uses to crosslinkers efficient at the lower temperature correspond-ing to most coatings.According to Campbell and Smeltz’s investigation[9], carbodiimides can be prepared from isocyanates in the presence of a catalyst such as phospholene oxide at 140–150◦C(Fig.2).Other methods have also been described and are reported in the literature[5,10].Studies on crosslinking have reported[11]that multi-functional carbodiimides are good crosslinking agents at low temperature in thefield of emulsions.Hence,emul-sion mixtures containing acrylic acid and multifunctional carbodiimides lead to paintfilms endowed with excellent properties(tensile properties and solvent resistance).Sev-eral patents[12–14]claim that carbodiimide agents can also be utilized in the fabrication offilms.This crosslinking method is also interesting because it can be used for in vivo conditions.Indeed,collagen matrices have been crosslinked to prevent their rapid degradation and to improve their mechanical properties.Several publi-cations[15–18]describe the crosslinking of collagen by the reaction of a carbodiimide with carboxyl groups of aspartic and glutamic acid residues of the matrix.2.1.1.2.Aziridines[19–23].Thefirst paper that reports aziridine as crosslinking agent was published in the early 1970’s[19].Roesler and Danielmeier[20]published a review on the reaction of aziridine with carboxylic acids,194G.Tillet et al./Progress in Polymer Science36 (2011) 191–217Fig.1.Formation of acetyl urea compounds by condensation of a carbodiimide with a carboxylic acid and the side reaction in presence ofwater.Fig.2.Synthesis of a carbodiimide from isocyanate.which spontaneously lead to an amino ester at room tem-perature,as shown in Fig.3.Polyaziridines used as crosslinkers can be obtained by the Michael reaction (Fig.4),such as the addition of amine onto activated unsaturated groups (e.g.,acrylics)[21].Fig.5shows a triaziridine that is soluble in several polar solvents including water,as described by Pollano and Resins [21].This triazine has been used to improve the mechanical properties (lower elongation,higher strength-ening)and the chemical resistance of various coatings,including wood varnishes [20]for interior applications.Fig.6illustrates the crosslinking of carboxylic acid ter-minated polymer with a triaziridine compounds,reported by Liu et al.[22].This reaction does not require any catalyst,and is car-ried out at room temperature,but its reaction rate is slower than that of the reaction involving carbodiimides.However,the reaction rate may be increased by the use of Cr(III)car-boxylate as a catalyst [23].Indeed,while it took one day in the absence of any catalyst,the reaction rate was reduced to 1min in presence of catalyst.Two drawbacks were observed:-As for their homologue carbodiimides,their poor water stability led to inactive amino alcohol.Nevertheless,thisFig.5.Structure of trimethylolpropane tris(2-methyl-1-aziridine propi-onate).limitation can be overcome by adding the polyaziridine crosslinker prior to the processing of the oligomer.-Aziridine compounds are irritant,toxic and mutagen.2.1.2.Aceto acetyl function [24–31]The aceto acetyl function (Fig.7)is a relatively new function,offering interesting potential for wide chem-ical activity.This reactivity is partly due to keto-enol tautomerism (75%ketone/25%enol)presented in Fig.7.Indeed,the insertion of the aceto acetyl functionality in a polymer reduces both the viscosity and the glass transition temperature [24].The other part of the reactivity,show in Fig.8,arises from the metal chelation (with copper,silver,nickel,etc.)by bisketones [25,26].This reaction is quite interesting since it is able to enhance adhesion to metal.Aceto acetyl derivatives can react with various groups,such (i)as isocyanates,(ii)activated alkenes,(iii)aldehydes,and (iv)amines,listed in the following:(i)IsocyanatesThe active methylene group of acetoacetyl function can react with an isocyanate at room temperature like in the reaction of isocyanates with hydroxyls,as shown in Fig.9.Del Rector et al.[24]have noted that this reac-tion occurred but with a lower reaction rate than that involving alcohols.In this case,a lower reaction rateisFig.3.Reaction between an aziridine and a carboxylic acid leading to an aminoester.Fig.4.Synthesis of polyaziridine by “Michael addition”between an amine and an acrylic alkene.G.Tillet et al./Progress in Polymer Science 36 (2011) 191–217195Fig.6.Crosslinking example of a polymer bearing carboxylic acid functions with atriaziridine.Fig.7.Keto–enol tautomerism:chemical equilibrium between keto and enolforms.Fig.8.Chelating of bisketone by copper acetate.a benefit since it allows better control of the crosslink-ing,and also favors convenient conditions to process the final product.(ii)Activated alkenes (“Michael addition”)A reaction between the methylene group and an electron deficient alkene can occur under strong basic conditions.This reaction,reported by Clemens and Del Rector [27],is described in Fig.10.These authors used strong bases (p K a >12),such as 1,8-diazabicyclo(5.4.0)undec-7-ene (DBU),1,5-diazabicyclo(4.3.0)non-5-ene (DBN)and tetramethyl-guanidine (TMG),listed in Table 1.Indeed,the p K aofFig.9.Reaction between an isocyanate and an aceto acetyl compounds.196G.Tillet et al./Progress in Polymer Science36 (2011) 191–217Fig.10.“Michael addition”between an aceto acetyl compounds and an activatedalkene.Fig.11.Formation of a linkage between two acetylacetonate groups by reaction with formaldehyde.Table 1Various bases involved in the reaction between acetoacetyl derivatives and acrylates (according to Clemens and Del rector [27]).StructureAcronymp K aNHC NN CH 3CH 3H 3C CH 3TMG13.6NN DBN 12.7NN DBU 12.5such an acetylacetonate derivative linked to the acidic protons of methylene between both ketone functions is estimated to 12which explains the need to use such strong bases.(iii)Aldehydes and more especially formaldehyde.Similarly,acetyl acetonate has also been used effi-ciently with formaldehyde to lead to a short link between two aceto acetyl groups,as shown in Fig.11:(iv)AminesBy contrast,Fig.12illustrates the reaction of amines with the hydroxyl group of the aceto acetyl enolic form.In this way,Mori et al.[28]synthesized “honeymoon-type”adhesives for wood products by crosslinking of acetoacetylated poly(vinyl alcohol)with diamines (these are adhesives consisting of two components,opposite com-ponents being applied to opposite adherends,the two brought together to form a joint).They propose the mech-anism in Fig.13for this crosslinking.Other reactions may occur when acetyl acetonates are involved (in particular for reactions using melamines),butthese reactions do not occur at room temperature,and in this case various examples are reported in Section 2.2.It may be noted that the acetoacetoxyethyl methacrylate (AAEM)monomer,the structure of which is given in Fig.14,has been marketed and is used in many fields,such as with acrylic latexes.The aceto acetamide function may also be used [29,30]because it should be less sensitive to hydrolysis which is an important feature as well during the polymerization reaction as for its storage [31].2.1.3.Amines [32–40]As amines exhibit high nucleophily,several reactions may occur at room temperature.In addition to the acetyl acetonates reported in Fig.15,aldehydes and ketones [32]are also featured reactants,and imine groups are also pro-duced in this way.This reaction is acido-catalyzed,and it has been found that five days are required to reach satisfactory properties of polyurethanes bearing two carbonyl groups.Among amines,some hydrazine derivatives are able to react with ketones,as shown in Fig.16.The introduction of ketone groups in the resin has been achieved thanks to the use of the N-(1,1-dimethyl-3-oxobutyl)acrylamide as shown in Fig.17.This reaction,discovered 40years ago,has mainly been used in the field of crosslinking chemistry by Mestach and co-workers [33,34]in waterborne acrylic dispersions appli-cations.The second reaction involves amines reacting with epoxides.Several reactions have been published on this is well-known reaction [35–37].Fig.18illustrates the crosslinking between an amine terminated polysiloxane and polysiloxane bearing an epoxide.The epoxy/amine system has been developed for latex by Geurts [38].In that case,the materials are separated into two different phases,called “the two in one system”.The main difficulty consists in incorporating aminegroups inFig.12.Reactions between enolic form of aceto acetyl with an amine.G.Tillet et al./Progress in Polymer Science 36 (2011) 191–217197Fig.13.Crosslinking of poly(vinyl alcohol)bearing aceto acetylated groups with a diamine.acrylic latexes.It is easy to insert epoxide groups thanks to the glycidyl methacrylate monomer (GMA).However,the use of GMA for latex synthesis raises a limitation (espe-cially for pre-crosslinking)due to the instability of that monomer in aqueous medium.Therefore,O’Brien et al.[39]used the episulfide,equivalent of an epoxide,synthesized as shown in Fig.19.The episulfide is more stable towards water,hence limiting pre-crosslinking.The crosslinking of episulfides in the presence of piper-azine is slower than that occurring in the presence of the oxygen containing derivative,and the best conditions of crosslinking are for 30min at 65◦C.However,storage sta-bility is not much improved.This amine has been used for the hardening of both episulfide and epoxide because it is water soluble,and thus it can migrate into the particles.Geurts [38]has reported an extensive and remark-able investigation of the synthesis of methacrylateaminoFig.15.Preparation of imines by reaction between an amine and a car-boxylic group.monomers.The same group also prepared the correspond-ing salts of this amine.The best results were obtained when n =5;for lower n a chemical rearrangement occurs (leading to amine),while for higher n,the monomer exhibits so high surfactant properties to enable suitable processing.This system led to interesting results but Geurts noted the presence of an unavoidable Michael reaction in the course of latex synthesis that contains this amine,as shown in Fig.20.Fig.14.Acetoacetoxyethyl methacrylate (AAEM)monomer bearing acetylacetonate group.198G.Tillet et al./Progress in Polymer Science36 (2011) 191–217Fig.16.Reaction of a hydrazine derivative with a polymer bearing ketones groups.The preceding reports the use of primary amines,but extensive researches also deal with the efficiency of ter-tiary amines and their reactivity with epoxides.Van de Ven et al.[40]have compared the reactivity of model epoxide molecules in the presence of water,tertiary amine,acid and alcohol,noting that,at room temperature,both the quater-nization reaction and the direct polymerization of epoxide mainly occurred,in contrast to the acid/epoxide reaction, which requiresheat.Fig.17.Structure of N-(1,1-dimethyl-3-oxobutyl)acrylamide.2.1.4.Acetal function[41–45]The acetal function represents the protected form of an aldehyde group and this protects the aldehyde function from amines.However,for lower pH values,the aldehyde is regenerated and the reaction with amine can lead to the corresponding imines.In this case,the driving force is the pH variation.Fig.21displays both reactions.Pichot’s group[41]was one of thefirst team that used this concept involving monomers with acetal groups to trap amino-acid,and this strategy was applied in thefield of Life Science.Another French team[42]used this concept in the field of acrylic coatings.Further progress was developed by Charleux’s group[42]and also claimed in a patent deposited by Elf Atochem[43].The development of latex for paints,able to undergo further reaction at room temperature during thefilm form-ing step,but remaining chemically stable during the latex synthesis and its storage,is obviously very delicate.That balance requires the use of protected chemical groups in the latex,which are deprotected during thefilm forming, and hence become reactive.Such a concept also occurs for acetal functions which are stable and inert in basic media[44].However these functions undergo hydrolysis in acid medium to lead to self-reactive aldehyde functions at room temperature.Fig.22displays this concept from N-(2,2-dimethoxyethyl)methacrylamide(MAAMA). Fig.18.Reaction between an epoxy and an amine often used to crosslink epoxyresins.Fig.19.Synthesis of thiirane from anepoxy.Fig.20.“Michael reaction”between an amine and a methacrylate amino monomer.G.Tillet et al./Progress in Polymer Science 36 (2011) 191–217199Fig.21.Protection reaction of an aldehyde by alcohol,reaction between an aldehyde and anamine.Fig.22.Structure of N-(2,2-dimethoxyethyl)methacrylamide (MAAMA).Such a reaction is possible,and studies with model com-pounds have shown that the dimerization of the amido group with aldehyde leads to the cyclic structure shown in Fig.23.This explains the crosslinking obtained thanks to this kind of latex,but this latter must be prepared under basic medium and it has to be acidified during the film forming to carry out the hydrolysis of acetal into aldehyde.In fact,the acetal function is interesting because it acts as a pH-responsive crosslinking agent as Li et al.[45]have shown.2.1.5.Acrylamide derivative [46–50]Acrylamide and aldehyde derivatives have been well-known for decades because they are able to self-crosslink at high temperatures.The chemical reaction arises from the self-condensation of the alcohol function [46]on the acrylamide monomer,as found in urea/formaldehyde or melamine/formaldehyde resins.Likewise,monomers bearing these groups have been synthesized for incorpo-ration in latexes,such as N-methylolacrylamide (NMA),isobutoxymethylacrylamide (IBMA),acrylamidoglycolic acid monohydrate (Highlink ®AG)or N-(2,2 -hydroxy-1-dimethoxyethyl)acrylamide (Highlink ®DMH),illustrated in Fig.24.In addition to the above monomers,many others are commercially available or synthesized.The use of a catalyst enables one to decrease the self-reaction temperature to room temperature,but post-curing is often necessary.These catalysts are either AlCl 3or strong organic acids such as paratoluene sulfonic acid or orthophosphonic acid [47].However,several side reactions are also involved,leading to the formation of formalde-hyde by-products,as shown in Fig.25,which is undesirable because of itstoxicity.Fig.23.Cyclic structure after the dimerization of an amido group with an aldehyde.Monomers such as N-(methoxy methyl acetate)acrylamide (MAGME)have been copolymerized with monomers containing hydroxyl groups,such as 2-hydroxyethyl acrylate (HEA),to obtain self-crosslinkable latexes [48].Indeed,Fig.26shows the presence of three potential crosslinking sites borne by the monomer,includ-ing NH,CH and OMe.Such a chemistry is promising and undergoes a fast development [49,50].2.1.6.Other crosslinking moietiesThis section describes a peculiar process that allows a post-crosslinking process at room temperature.However,it requires the participation of a chemical agent (and from neither thermal nor photochemical effects).Typically,the use of oxygen and water are reported below.2.1.6.1.Water [51–100].2.1.6.1.1.Sol–gel reactions.The chemical reactions of the sol–gel process were reported almost four decades ago [51],but this technique has gained increasing interest.The sol–gel process makes it possible to produce at low tem-perature networks with high purity and high homogeneity.Although many studies have been carried out on sol–gel processes involving organic compounds,a few investiga-tions involve polymers to lead to hybrid materials for which organic and inorganic phases coexist.Furthermore,some multicomponent systems which cannot be made by con-ventional methods due to crystallization can be produced in a sol–gel process [52].Although shrinkage and fracture during the curing process limit the widespread applica-tions of these techniques,much success has been achieved in producing monolithic solids by controlling the diffu-sion rate of volatile components in the system [53].Two methods exist to obtain organic/inorganic materials.The first method is based on a mixture of a metal alkoxide [such as Si(OR)4,Ti(OR)4,Zr(OR)4,Al(OR)3]and a polymer.For example,Blanchard et al.[54]reported an extensive study on the hydrolysis and condensation reaction of dif-ferent metal alkoxides M(OR)n (where M represents Si,Ti,Zr atoms,etc.and OR is an alkoxy group).Then,the metal alkoxide undergoes a hydrolysis reaction followed by a polycondensation to form a three-dimensional network containing the polymer.The hydrolysis and polycondensa-tion reactions are described in Fig.27.The resulting materials,initially called “ceramers”by Wilkes et al.[55],should reflect some of the proper-ties of the sol–gel glass and the incorporated polymeric reactant.However,the completion of the hydrolysis reac-tion depends upon the amounts of water and acid added to the system.Because of the nature of that process,。

CHINESE COMMUNITY DOCTORS 近年来,接受口腔修复治疗的患者人数增多,选用合适材料实施口腔修复具有必要性。
二氧化锆全瓷冠修复治疗方法是口腔修复治疗患者常用的修复方式之一,在口腔修复治疗中被推广使用。
本文针对2018年3月-2020年4月在本院接受口腔修复治疗的76例患者实施详细评估,探究二氧化锆全瓷冠修复治疗方法开展在口腔修复治疗中的价值。
资料与方法选取2018年3月-2020年4月接受口腔修复治疗的患者76例,随机分为两组,各38例。
参照组患者男20例,女18例,共38颗患牙,其中,前磨牙17颗,磨牙12颗,前牙9颗;年龄24~45岁,平均年龄(34.66±3.15)岁。
试验组患者男21例,女17例,共38颗患牙,其中,前磨牙16颗,磨牙14颗,前牙8颗;年龄23~46岁,平均年龄(34.57±3.36)岁。
两组一般资料比较,差异无统计学意义(P >0.05),具有可比性。
方法:①参照组采取镍铬合金全瓷冠修复治疗:实行牙体制备操作,予以取模且对比颜色,制作镍铬合金全瓷冠,让患者试戴7d 镍铬合金全瓷冠,合适则予以黏贴牢固。
②试验组采取二氧化锆全瓷冠修复治疗:参考患者实际牙齿状况将内冠制作,予以取模并对比颜色,对二氧化锆全瓷冠实施加工操作,采取计算机实行模型设定,采取铣床制作及打磨二氧化锆全瓷冠,适宜打磨牙体组织,让患者试戴7d 二氧化锆全瓷冠,合适则予以黏贴牢固。
观察指标:比较两组患者口腔修复效果及牙龈颜色异常率。
疗效判定标准:①优:牙髓活力并无异常,修复体与牙体间颜色及光泽情况等均正常,修复体形状较为完整,对美观度无明显干扰;②良:牙髓活力并无异常,修复体与牙体间颜色及光泽情况等缺乏一致性,修复体形状相对完整,面部轮廓欠缺;③差:和以上对应描述内容并不相符合[1]。
优良率=(优+良)/总例数×100%。
统计学处理:数据应用SPSS 23.0软件处理;计数资料以[n (%)]表示,采用χ2检验;计量资料以(x ±s )表示,采用t 检验;P <0.05为差异有统计学意义。

第45卷第6期2022年11月河北农业大学学报JOURNAL OF HEBEI AGRICULTURAL UNIVERSITY Vol.45 No.6Nov. 2022文章编号:1000-1573(2022)06-0115-07DOI :10.13320/ki.jauh.2022.0102收稿日期:2021-04-12基金项目: 国家重点研发计划项目(2018YFD0700600).第一作者:于 博(1994—),男,河北承德人,硕士研究生,从事农业机器人设计及运动控制研究.E-mail:*****************通信作者: 李 娜(1981—),女,河北保定人,副教授,从事多体系统动力学与农业机器人设计及运动控制研究.E-mail:****************本刊网址:苗木嫁接并联破砧装置设计与运动控制研究于 博,李 娜,刘 磊,高松岩(河北农业大学 机电工程学院,河北 保定 071001)摘要:本文针对果树苗木田间机械化嫁接中工作空间受限、需多轨迹变换且切削力大等问题,设计1种苗木嫁接并联破砧装置。
首先,结合改进型“劈接法”破砧作业所需自由度,基于螺旋理论建立破砧装置基础运动螺旋系,并推导约束螺旋系,从而确定装置的基本构型。
采用振动式锯切机作为切刀实现振动减阻。
其次,基于矢量法建立运动学逆解方程,结合破砧农艺过程进行运动轨迹规划,并利用ADAMS 虚拟样机仿真验证装置运动学逆解的正确性。
最后,对不同生长情况的苗木进行样机试验,其中苗木高度不同时破砧成功率为96%,直径不同时破砧成功率为94%,生长方向不同时破砧成功率为92%,经计算样机平均破砧成功率为94%。
试验表明该装置可完成受限空间内多轨迹破砧作业,可为田间机械化嫁接装置的研发提供参考。
关 键 词:苗木嫁接;破砧装置;并联机构;运动控制中图分类号:S 223.1 开放科学(资源服务)标识码(OSID):文献标志码:ADesign and motion control research on parallel rootstock cutting devicefor seedlings graftingYU Bo, LI Na, LIU Lei, GAO Songyan(College of Mechanical and Electrical Engineering, Hebei Agricultural University, Baoding 071001, China)Abstract: This paper presents a parallel rootstock cutting device for the mechanized grafting of fruit tree seedlings in the field, which has the issues of limited working space, multi-track transformation and large cutting force. Firstly, combined with the freedom required by rootstock cutting operation of the improved “split grafting method”, the basic motion screw system of rootstock cutting device was established based on the screw theory, and the constraint screw system was deduced to determine the basic configuration of the device. Vibration sawing machine was used as cutting tool to reduce cutting force. Secondly, the inverse kinematics equation is established based on the vector method. Combined with the rootstock cutting agronomic process, the motion trajectory planning was carried out, and the correctness of the inverse kinematics solution of the device was verified by ADAMS virtual prototype. Finally, the prototype experiment was carried out on the seedlings with different growth conditions, among which the success rate of root stockcutting is 96% at different height, 94% at different diameter, 92% at different growth direction, and the average success rate of rootstock cutting is 94%.The experimental results showed that the device can complete multi-track rootstockcutting operation in limited space, which provides a reference for the research and development of mechanized grafting device in the field.Keywords :grafting of seedlings ;rootstock cutting device ;parallel mechanism ;motion control116第45卷河北农业大学学报嫁接是苗木育苗中的重要环节。

总结突起的英⽂词语及句⼦总结突起的英⽂词语及句⼦ apophysis prominence prominency promontory protuberance salience tuber 参考例句: A rounded hump or protuberance. 圆形的隆起或突起A spur of rock stuck out from the mountain. ⼭背上突起⼀个⽯脊。
In rare cases, mild nuclear pleomorphism, prominent nucleoli and mitotic figures may be seen. 少数病⼈可见多形性胞核、突起的核仁和有丝分裂像。
Infected mandibular, parotid and anterior cervical nodes usually cause subcutaneous induration and surface bulging 感染的'下颌,⽿下和颈前淋巴结,通常引起⽪下硬结和表⾯突起。
One of the protruding marks used in certain methods of writing and printing for the sightless. (盲⼈⽤以点字的)点突起的标记之⼀,⽤于某些为盲⼈设计的书写和印刷⽅法中The portion of the funiculus that is united to the ovule wall,commonly visible as a line or ridge on the seed coat. 脊,种脊植物珠柄与胚珠壁连接的部分,通常表现为果实外壳上的⼀道条纹或突起A war breaks out 战端突起A barrel swells in the middle. 桶腹突起的地⽅。
A small tooth or toothlike projection. ⼩⽛齿或齿状突起Pseudopods (false feet) are temporary projections of eukaryotic cells. 假⾜是真核细胞的暂时突起。
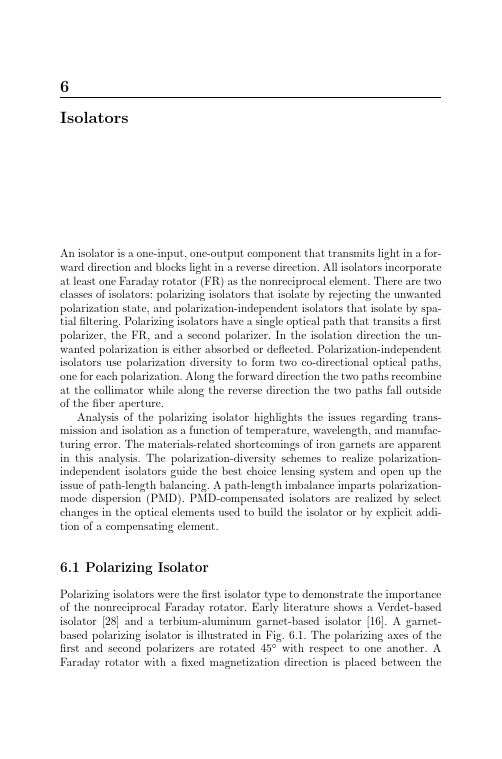
RSC 103Clinical Science and Practice of Musculoskeletal Physiotherapy IPractical and Tutorial materials on Lower LimbEdited bySharon MH TSANGMMani Th, MSc(HC), BSc(PT)Department of Rehabilitation Sciences The Hong Kong Polytechnic University 2010 versionP OLYTECHNIC UNIVERSITY T HE H ONG K ONG(adopted from Magee Chapter 1, Table 1-1, pp. 2)Yellow Flag. Findings in patient history that indicate a more extensive examination may be required(adopted from Magee, Chapter 1, Table 1-2, pp.3)Systematic Musculoskeletal Examination GuidelinesBox A.1. Information generated from the initial history (adopted from Kisner & Colby 2007, page886)Box A.3. Systematic Musculoskeletal Examination (adopted from Kisner & Colby 2007, page 887)Practical and Tutorial materials on Hip regionPHYSICAL (OBJECTIVE) EXAMINATION OF THE HIP OBSERVATIONWatch patient as enters the room to see if limping or in any obvious pain. Patient must then undress sufficiently to expose leg, hips/pelvis.StandingObserve anterior, posterior and lateral aspects.▪Overall posture in standing (lordosis, trunk flexed, etc.)▪pelvic symmetry, pelvic tilting, level of P.S.I.S. and A.S.I.S.▪any fixed deformity, e.g. typical O.A. deformity - F/Add/ER▪buttock (gluteal) wasting, quads wastingGait assessmentWatch from in front and side. Need to determine:(1) if there is any abnormality in gait? Trendelenberg’s sign?(2) what causes the abnormal gait pattern, i.e. habit? weakness? stiffness? pain? Activity:Supine / Prone lyingWhat will you be looking for?FUNCTIONAL ACTIVITIESIf gait is normal and symptom free, look for abnormalities using functional tests (if appropriate):e.g. walking backwards, sideways, squatting etc.Activity: Can you think of any other functional activities related to the hip?ACTIVE MOVEMENTSFE (in prone)AbdAddIR ) in 900 F andER ) EActivity: What are you looking for in these active movements?What’s considered to be positive / comparable?If the patient is irritable, in what manner would you carry out yourexamination?PASSIVE MOVEMENTS(1) Physiological- same movements as active, plus- F/Add test (if all tests negative so far) (refer Maitland pg. 221-223)Activity: What information are you seeking for in passive movements?What does it mean if active ROM = passive ROM? If passive ROM > activeROM?(2) Accessory↑↓↔ (caud.)ISOMETRIC MUSCLE TESTS- same movements as activeActivity: What is the aim of this series of tests?What is considered to be positive /comparable?MUSCLE LENGTH TESTS▪Thomas' test▪Hamstring length▪Rectus femoris lengthActivity: What is the purpose of this test?Are there any other muscles that can be tested around the hip? How? PALPATIONTemperatureSwelling, WastingSensationPalpate greater trochanter, gluteal muscle bulk, ischial tuberosityADJACENT JOINTS – CLEARING TESTS (if applicable)Lumbar spineKneeActivity: Under what situation do we need to examine adjacent joints?If the clearing test is positive, what will you do?HIGHLIGHT MAIN FINDINGS WITH ASTERISKS*Acitvity: What is the use of having asterisks?Example of Physical Examination RecordingTHERAPEUTIC INTERVENTION FOR THE HIPInpatient rehabilitationAfter THR (inpatient), identify the possible problems that the patient can have and possible physiotherapy plan and interventionExercises to prevent complications, maintain joint mobility and muscle strength▪Chest - bilateral basal expansion, cough effort (discuss)▪Exercises - ankles and toes, static quads, static gluteals, mobilisation exercises for the good leg▪Inner range quadriceps over pillow/ rolled up towel (understanding of quadriceps lag)▪gentle active assisted knee and hip flexion (no more than 60o, depending on the surgeon), hip abduction, bridging exercise (active hip extension)▪Adduction to neutral, rotation to neutral.▪sitting in bed but hip flexion no more than 60oEquipment: re-education board, quadriceps drum, rolled up towel, sling suspension etc.Transfer, bed mobility and ambulation1. Selection of and measurement of walking aid (revisit if necessary)2. Transfer and bed mobilityGetting upGet up off the bed from the affected sideShift body to side of bedLower the affected leg down the side of the bedLift the body up with the arms pushing from behindControl the amount of hip flexion - keep as straight as possibleGetting back to bedConsider getting in opposite side of bed i.e. affected leg closest to bedor with good leg closest to bed, arms behind the body, lean body backwards, lift affected leg up (either with the good leg or with the therapists help)Weight bear as tolerated (depending on the medical team decision)3. Gait re-educationUse of crutches or walking aid in different type of walking (TTD, NWB, FWB)↑ and ↓ stairs4. Home exercise program on discharge▪Possibility of exercises that can be performed at home, progression▪Patient advice- do not cross legs while sitting- do not lean forward when sitting- do not sit on low chairs- careful with picking up objects from floor- careful with putting on shoes and socks- lie on unaffected side unless there is a pillow between legs- do not allow too much rotationEquipment: theraband, theratube, rolled up towels5. ADL adaptationclinical improvement: decrease in pain, full ROM etc. vs. patient’s function6. Follow-up appointment in outpatient department post THR – change of walking aids,change of weight bearing status, other physiotherapy modalitiesOutpatient rehabilitationFor hip dysfunction – pain, stiffness, decreased ROM and decrease in muscle strengthPain Relief1. Manual therapyphysiological vs. accessory passive movementsgrades of movementPractice manual techniques how these techniques can used as treatment.2. AmbulationSelection of suitable ambulatory aid to relieve stress and pain.▪proper walking aid prescription▪teach proper use of walking aidEquipment: walking sticks, frame etc.3. Electrophysical agentsTo be discussed in the next courseDecrease stiffness and maintainence of ROM1. Active exercisesMaintainence of ROM in gravity free position to prevent further stress acting onto the joint surface.Equipment: re-education board, hydrotherapy2. Manual therapyMobilisation techniques:▪Passive accessory movements corresponding to the direction of physiologic movements▪Passive physiological movements▪discussion of different grades of movement3. Stretching (active or passive)Of any tissue with tightness as found in the assessment!Remember the capsular pattern (F/Add/ER)Maintainence (or progression) of muscle strength▪with or without equipment▪isometric exercise in pain-free position▪progress to isotonic exercise if tolerated▪progression – gravity assisted to against gravity, without to with resistance, repetitions etc.Equipment: theraband, theratube, rolled up towels for quadricepsHip case study 1Fracture neck of femurCase adopted from Atkinson K, Coutts F, Hassenkamp A-M (1999). Physiotherapy in Orthopaedics: A Problem-Solving Approach. 1st ed., Edinburgh: Churchill Livingstone, pp. 103.Mrs. Wang, fractured neck of femur (#NOF)Present complaint Mrs. Wang, a 77-year-old lady, was admitted to hospital via casualty, after a fall at home, 2 days ago. She was discovered by her neighbour,lying on the floor, quite cold and unable to getup or walk.Casualty reportLeft leg, externally rotated and shortened; on X-ray (L) subcapital #NOF. Early signs of hypothermia and dehydration. Initial medical care Skin traction with 3 kg weight. For internal fixation with dynamic hip screw tomorrow,continue traction until then. Full teamassessment and treatment as required.Q: Mrs. Wang is going to surgery tomorrow,what assessment would be relevant at this stage and what would be the physiotherapy treatment objective at this time?(adopted from )(adopted from ) (adopted from )Kisner C, Colby LA (2007). Therapeutic Exercise: Foundations and Techniques. 5thed . Philadelphia: FA Davis Co., pp.667.Therapeutic Exercises for addressing the problems presented1. You visited Mrs. Wang day 1 after the surgery, what would you assess in yoursubjective and objective examination?2. What are the potential complications associated witha. subcapital #NOF?b. surgery?3. What can you do to prevent these potential complications?4. Mrs. Wang is allowed to get up day 3 after surgery. What precautions need tobe taken when a patient with a fracture gets up to either sit or stand for thefirst time?5. What would be your treatment plan at this stage (day 3 after surgery)?6. What would be the criteria for discharge for Mrs. Wang from (a) the medical,and (b) the physiotherapy point of view?7. Six weeks after the fracture, Mrs. Wang returned to outpatient department forphysiotherapy treatment. What would be the treatment objectives now?Hip case study 2Total hip replacementMrs. Zhang, a 69 year old lady had a cemented THR posterolateral approach yesterday. Her doctor has referred her to you for mobilization and exercises. She is told by the doctor not to bend her hip more than 900. This is the first time you met Mrs. ZhangProblem Solving Exercise1. What information would you need to find out from Mrs. Zhang’s medical andnursing records before planning your management?2. When can we start active post-operative physiotherapy treatment?3. What do you expect to find on examination?4. Based on the surgical intervention (read information below), how does it affectpost-operative physiotherapy management? What are your treatment aims? 5. Describe actions that Mrs. Zhang should avoid when she gets out of bed.Anatomy of the hip(adopted from Keith L. Moore. Essential Clinical Anatomy. Baltimore ; London :William & Wilkins, 1995. P. 240)Posterolateral approach (operation approach)▪Most frequently used approach▪The joint is accessed with incision split in line with the gluteus maximus. The capsule is incised posteriorly and the short external rotator tendons are transected near their insertion. This approach preserves the integrity of the gluteus medius and vastuslateralis muscles.▪The primary disadvantage of this approach is that it is associated with the highest incidence of postoperative joint instability and resulting subluxation or dislocation of the hip.▪To reduce the risk of postoperative dislocation, repair of the posterior capsule is advocated to provide maximal soft tissue constraint to the posterior aspect of thecapsule.Kisner C, Colby LA (2007). Therapeutic Exercise: Foundations and Techniques. 5th ed. Philadelphia: FA Davis Co., pp.654.More to learnPosterolateral approach∙The incision is begun 4 to 5inches superior and medial tothe top of the greatertrochanter∙The fascia lata is split in linewith the skin incision, and thegluteus maximus is splitproximally∙The short external rotators areexposed by blunt dissection.The sciatic nerve liessuperficial to the externalrotators.∙The short external rotators aredivided.∙Retraction now exposes the hipjoint capsule.Maxey L, Magnusson J (2001). Rehabilitation for the Postsurgical Orthopedic Patient - Procedures and Guidelines, Mosby Co., pp.174-175Components of total hip arthroplasty(adopted from )Preoperative X-ray of a 44-year-old male with degenerative osteoarthritis Postoperative A/P X-ray ofthe same patient with THRPostoperative lateral X-rayof the same patient withTHR(adopted from The Asian Hip System. Biomet Inc.)Philadelphia: FA Davis Co., pp.653.Philadelphia: FA Davis Co., pp.656.Philadelphia: FA Davis Co., pp. 656-7.Philadelphia: FA Davis Co., pp.659.Practical and Tutorial materials on Knee regionPHYSICAL EXAMINATION OF THE KNEEOBSERVATIONPatient standing and suitably undressedStanding (anterior, lateral and posterior)▪level of pelvis and knee creases▪equal WB▪deformity e.g. genu valgum/varum, held in F, flatfeet etc.▪muscle wasting (quads, hams, calf)▪hyperextension▪Position of the patella (face ahead? Tilt outward/inward? Rotated in/out?)Gait assessment▪looking from the front and the side- ?knee held in F- hyperextension- good weight transference- ?equal size steps, ?normal push off etc.FUNCTIONAL ACTIVITIESApart from gait assessment, functional tests can be performed geared to the individual patient. For example,▪walking forward, backward, on heels, on toes (if appropriate)▪squat on toes, feet flat, bounce, running (if appropriate)Note:▪Approximately 1170 F is needed for squatting to tie a shoelace or pull on a sock▪Approximately 900 F is required for sitting in a chair▪Climbing stairs – approximately 800 FSupineFeel for:▪temperature, swelling▪Effusion tests1. Patella tap test2. Fluctuation test▪scars, bruising etc.Watch for any:▪Quadriceps wasting (measure girth)▪knee deformityACTIVE MOVEMENTS1. Tibiofemoral joint - F- E (quads lag, if any)2. Patellofemoral joint –Clarke’s signPASSIVE MOVEMENTS1. Physiological▪same movements as active – F, E2. AccessoryTibiofemoral jointE/Abd, E/AddPatellofemoral joint↔ (cephalic, caudal)lateral, medialor other combinations (if appropriate)+/- compression (note: not suitable for irritable conditions)LIGAMENT STRESS TESTS1. MCL – Valgus stress test, performed with knee in 200F2. LCL – Varus stress test, performed with knee in 200F3. ACL – Anterior drawer test, performed with knee in 900F4. ACL – Lachman test, more accurate for ACL damage. Tested with knee in about 200 F5. PCL – Posterior drawer test, performed with knee in 900FMENISCUS TESTS1. McMurray's test2. Apley's test▪Distraction▪CompressionISOMETRIC MUSCLE TESTSFE (inner range, thru range)MUSCLE LENGTH TESTSHamstringsQuadricepsPALPATIONKnee flexion in 900 F, palpate relevant structures -▪Joint lines and level▪Tibial and femoral condyles▪Ligaments – collaterals▪Tibial tubercle▪Quadriceps insertion, ligamentum patellae▪Head of fibula▪Medial and lateral hamstringsADJACENT JOINTS (if applicable)HipSuperior tibio-fibular jointAnkleLumbar spineHIGHLIGHT MAIN FINDINGS WITH ASTERISKS *Reference:Magee DJ. Orthopaedic physical assessment. 5th ed. Philadelphia: W.B. Saunders, 2008. Chapter 1 –∙pp. 2 (Table 1-1 Red Flag, Table 1-2 Yellow Flag),∙pp.29 (Table 1-14 Differential diagnosis of muscle strains, tendon injury, and ligament sprains)∙pp. 55 (observation & palpation)∙pp.56 (swelling)∙pp.69 (Example of assessment form)Chapter 12 –∙pp.759 onwards ”testing of ligaments”– read one plane instability tests,∙pp.790 onwards – special tests for meniscus,∙pp.795 onwards – tests for swelling,∙pp.798 – tests for patellofemoral dysfunctionTHERAPEUTIC INTERVENTION FOR THE KNEEManual therapyA.Manual therapy techniquesUse of manual therapy in soft tissue injuries and the treatment principles associated with the tissue healing time framePhysiological techniques:1. Tibiofemoral flexion2. Tibiofemoral extension3. Ext/Abd, Ext/AddAccessory techniques:4. Tibiofemoral rotation (IR, ER)5. Patellar mobilisations* In what position?* How to select the grade?* How many repetitions?B. Deep friction massage▪Small accurately localised, penetrating movements performed in transverse or circular direction▪Performed by thumb or finger tips▪There should be no movement between the therapist’s fingers and patient’s skin to avoid blister formationEffects:1. Mechanical – softening of chronic adhesions or scar tissue2. Physiological – hyperaemia, histamine type reactionUses:1. Loosen scar tissue from adhering to surrounding structures2. Loosen adhesions and aid in absorption of local effusions in lesions of muscle, tendonor ligament3. Indirect pain reliefTherapeutic exerciseA. Active mobilisation1. Active assisted exerciseImprovement of joint mobility in non weight bearing position which could be controlled by patient (as guided by pain)Equipment : Reciprocal pulley (plus other free active exercises)2. Stretching▪Contract-relax▪Self stretchingB. Strengthening exerciseOpen kinetic chain exercises1. Quad setsCould be done in different positions, e.g. supine, sitting or long sitting with the knee extended, and perform isometric quadriceps contraction.2. SLRCombines dynamic hip flexion and static knee extension, could be performed at different angle of hip flexion. (The most significant resistance to the quadriceps is during the first few degrees of SLR.)3. Short-arc terminal extension (with or without resistance)4. Co-contraction - use verbal cues, can be performed at any range.Closed kinetic chain exercises1. Terminal knee extension▪Mini squat in standing▪Perform terminal knee extension against theraband in standing position2. Standing wall slide3. Forward, backward, lateral steps-up and steps-downEquipment : theraband, weights, quadriceps board*Maintenance of cardiovascular training throughout the rehabilitationC. Functional training▪Sports specificity, skill acquistion▪Proprioception, co-ordination (introduced and to be reinforced in ankle series)▪Movement/skills required in soccer game▪Hopping, shuttle run, cutting run etc.Demonstration▪Use of CPM▪Reciprocal Pulley▪Knee bracesDiscussion▪Treatment principles in line with the tissue healing time frame▪Acute sprains and partial tears of the knee can be treated conservatively with rest, joint protection, manual therapy and exercise.▪After acute stage of healing exercise should be geared toward regaining normal and painfree ROM and strength of the muscle for support and stabilization of the joint during ADL.For ACL injuries (see tutorial notes);∙Avoid activities that increase anterior translation of the tibia over the femur as it will further stretch the ACL∙Avoid open kinetic chain (OKC) terminal knee extension exercise (from 600 to 00) with resistance applied to distal leg∙Avoid closed kinetic chain (CKC) squatting between 600 to 900 especially during the initial stage where the muscles are still weakKnee case study 1MCL injuryCase adopted from Atkinson K, Coutts F, Hassenkamp A-M (1999). Physiotherapy in Orthopaedics: A Problem-Solving Approach. 1st ed., Edinburgh: Churchill Livingstone, pp. 121.David Chan is a 21year-old man and a keen hobby footballer. Yesterday, while playing football he was tackled and fell. Although he immediately felt pain, he was able to play on, but his pain got much worse once he stopped playing. He now complains of a sharp pain on the medial aspect of the knee which increases on extension.Therapeutic Exercises addressing problems presented1. What would you assess today?2. What symptoms do you expect to find on examination?3. Describe the characteristics and clinical signs at this stage of his injury.4. What would be your treatment aims?__________________________________________________________________ _________Objective Examination Findings for David Chan (after 4/52 treatment) Observation: mild effusion around patella extending over the medial aspect of the knee joint, mild muscle wasting in medial aspect of thigh.Active ROM: * (L) Knee F 1200“tight sensation” P1 (2/10)* (L) Knee E -50 P1 (2/10)Muscle tests: *(L) Quads 4/5 (50 extensor lag)(L) Hamstrings 5/5Palpation: Moderate tenderness in medial joint line. Slight tenderness over the medial border of patella.Problem Solving Exercise1. What do the objective findings mean to you?2. What are the patient’s problems (i.e. physical diagnosis?)3. What are the possible structures involved in pathology?4. Relating to the stages of soft tissue healing, what are your aims of treatment?5. Are there any precautions or contraindications you have to take note in planningyour treatment program?adopted from Moore KL (1995). Essential Clinical Anatomy. Baltimore; London: William & Wilkins. pp. 270.Philadelphia: FA Davis Co., pp. 724.Knee case study 2ACL reconstructionCase modified from Kisner C, Colby LA (2002). Therapeutic Exercise: Foundations and Techniques. 5th ed. Philadelphia: FA Davis Co., pp.558.Thomas Li, a 17 year old rugby player had a soccer injury 4 weeks ago. He was in a game of rugby when he twisted to challenge a player, he felt a pop in his knee. He felt immediate pain and swelling after the injury and could not fully weight bear. Since injury, he visited an orthopaedic surgeon and revealed that he had torn his anterior cruciate ligament. He has his operation 4 weeks ago and now he is to begin his rehabilitation. He can start full weight bearing on his leg. He describes stiffness and pain when attempting to flex his knee. Observation reveals significant atrophy in the thigh and leg. There is minimal swelling. His active knee flexion range is limited to 400 and extension is – 100.Passive movements of the tibiofemoral joint and patellofemoral joint were stiff in all directions. He demonstrated the ability to do some quadriceps and hamstrings exercises but strength could not be tested. Thomas wanted to return back to his rugby.Problem Solving Exercise1. List his impairments and functional limitations, and state appropriate goals.2. Develop an exercise program to meet his goals. How will you begin theexercises; how will you progress each exercise and the program?3. What manual techniques would you use for this patient?Anatomy of ACLadopted from Moore KL (1995). Essential Clinical Anatomy. Baltimore ; London : William & Wilkins, pp. 270.adopted from Patient Information. The Gore-tex Anterior Cruciate Ligament Prosthesis. W.L Gore & Associates, Inc. 1987ACL reconstruction surgery explained adopted from ∙ACL surgery begins with anarthroscopic examination ofthe inside of the knee∙After the surgeon inspectsthe knee for damage to thecartilage or the menisci, theremnants of the torn ACLare removed with a high-speed shaver. The surfaceof the intercondylar notchwhere the ACL normallyattaches to the femur isthen prepared with a high-speed burr so that theproper location for thetunnel∙Tunnels are then drilledthrough the bone in thefemur and the tibia so thatthe graft can be placed inthe center of the knee in thesame position as theoriginal ACL. A separateincision that is about 2 to 3inches long also has to bemade in order to harvestthe graft from either thepatellar tendon or thehamstring tendons.passed through thetunnels, it is thentensioned and fixed inplace. Once the grafthas been fixed inplace and anyadditional damagehas been addressed,the incisions areclosed and a steriledressing is used tocover the knee. Thisdressing will usuallystay on for severaldays while the woundbegins to heal.(to be continued in next page)(Kisner & Colby 2007. Pp. 729)Advantages & Disadvantages/ complications of the Bone-Patellar-Tendon-Bone AutograftAdvantages & Disadvantages/ complications of the Semitendinosus-Gracilis AutograftKisner C, Colby LA (2007). Therapeutic Exercise: Foundations and Techniques. 5th ed.Philadelphia: FA Davis Co., pp..727-730.Practical and Tutorial materials on Ankle RegionPHYSICAL EXAMINATION OF THE ANKLEObservationWatch patient as enters roomIn standing (shoes off)-weight bearing pattern-foot arches - ? pes planus, ? pes cavus-deformities-muscle wasting (calf)-knee - ? valgus / varus-lower limb alignmentGait-patient walks towards and away from therapist-note any deformities, ask patient to correct and see the effect on pain -if minimal signs, then:-walk backwards, +/- on heels, on toes, inversion, eversion-squat (spontaneous, then heels flat)-run, hop, jump as indicated- Shoe wear - ? abnormal wear patternIn standing - calf strengthIn supineFeel for temperature, swelling, sweatingWatch for as scar, wound, bruisingActive movementsDorsiflexionPlantarflexionInversionEversionCombined physiological movementsPassive movements1. Physiological-same movement as active2. AccessoryTalocrural joint, subtalar jointTalar Rock (pp.817)↓↑→ (med)← (lat)ForefootHorizontal F, ESpecial tests1. Ligament stress tests (Magee 2008, pp. 888-891)- Anterior drawer test (anterior talofibular ligament)- Talar tilt (calcaneofibular ligament)2. Integrity of Achilles tendon (Magee 2008, pp. 894)- Thompson’s testIsometric muscle testsPFDFInvEvPalpationAnkle – anterior joint lineLateral ligament - anterior talofibular lig., calcaneofibular lig. (posterior talofibular lig.) Medial ligamentTendo-achillesPeroneal tendonsAdjacent joints (if applicable)Superior and inferior tibiofibular jointmid tarsal joints/toesknee/hiplumbar spineHIGHLIGHT MAIN FINDINGS WITH ASTERISKS*THERAPEUTIC INTERVENTION FOR THE ANKLE Mobilisation exercises▪Active exercises for improving physiological ROM▪Passive mobilization techniques for inferior tibiofibular, talocrural and subtalar joints Strengthening exercises▪Tibialis anterior, tibialis posterior and peronei using theraband, weights in NWB position▪body weight as resistance to train specific group of muscles▪intrinsic muscles of foot - picking marble, curling towelsProprioception and coordination training▪wobble board▪bouncerStretching exercises to gastro-soleus complex▪manual stretching▪self stretching - forward lounge, note holding time and number of repetitions▪incline board▪steps – concentrate on gastro-soleus then stretch with heel gradually going downEquipmentIncline board, small steps, theraband, marbles, towels, wobble board, bouncerAnkle case study Clinical Reasoning (Clinical Decision making process) Sprained AnkleCase adopted from Atkinson K, Coutts F, Hassenkamp A-M (1999). Physiotherapy in Orthopaedics: A Problem-Solving Approach. 1st ed., Edinburgh: Churchill Livingstone, pp. 124.Gemma is a 35-year-old woman who tripped on the pavement on her way to work resulting in a severe inversion sprain of her ankle. Her pain was so severe that an ambulance was called and she was seen in the accident and emergency (A & E) department. A stress X-ray (plantar flexion and inversion) demonstrated that although no fractures had been sustained, a partial ligamentous rupture had occurred. This might have resulted in some instability. She came straight to physiotherapy after A & E.Problem Solving Exercise1. What questions would you ask in order to understand further the mechanismof the injury?Speed, shoe, how she landed onto the ground, was the foot trapped, hard or soft surface, other injury?2. What O/E tests would you perform? How would you approach Gemma’streatment?O/E tests: acuteobservation-swelling, redness, bruising, scar/wound, posture e.g. walking, weight bearing, deformity,measure swelling (girth measurement)feel, palpation-temperature, swelling, tenderness areas, bony area (medial & lateral malleoli, joint line of talocrural joint, inferior tibio-fibular jointmove-AROM (inversion, PF, DF, Eversion), accessory movement at inferior tibio-fibular joint (AP/PA)MMT- DF,PF,Inv,EveSpecial tests: ligamentous test- calcaneo-fibular ligament (talar tilt test), anterior drawer test (anterior talo-fibular ligament) +ve comparable pain, with laxity, Treatment:Acute sprain management:PRICE approach (aims to reduce/ control inflammation and to protect the injured ligament, to prevent complications e.g. complete tear of the ligament, post injury stiffness,How to protect the injured ligament??? Rest, prevent excessive inversion, taping, bracing, NWB walking with elbow crutches,3. What is the rationale for the PRICE regime? How long would you adviceGemma to persist with this approach?Ice therapy: 15-20 minutes Ice pack (5 times per day/ every hour), cryocuff (compression with ice water pack),。
Adv Polym SciDOI:10.1007/12_2010_99#Springer-Verlag Berlin Heidelberg2010Surface Modification of Fillers and Curatives by Plasma Polymerization for Enhanced Performance of Single Rubbers andDissimilar Rubber/Rubber BlendsJ.W.M.Noordermeer,R.N.Datta,W.K.Dierkes,R.Guo,T.Mathew,A.G.Talma,M.Tiwari,and W.van OoijAbstract Plasma polymerization is a technique for modifying the surface charac-teristics offillers and curatives for rubber from essentially polar to nonpolar. Acetylene,thiophene,and pyrrole are employed to modify silica and carbon black reinforcingfillers.Silica is easy to modify because its surface contains siloxane and silanol species.On carbon black,only a limited amount of plasma deposition takes place,due to its nonreactive nature.Oxidized gas blacks,with larger oxygen functionality,and particularly carbon black left over from fullerene production,show substantial plasma deposition.Also,carbon/silica dual-phase fillers react well because the silica content is reactive.Elemental sulfur,the well-known vulcanization agent for rubbers,can also be modified reasonably well.Coated materials are evaluated in S-SBR and in50:50blends of S-SBR and EPDM rubbers.In blends,the partitioning offillers and curatives over the phases depends on differences in surface polarity.In S-SBR,polythiophene-modified silica has a strong positive effect on the mechanical properties because of a synergistic reaction of the sulfur-moieties in the polythiophene coating with the sulfur cure system.In S-SBR/EPDM blends,a coating of polyacetylene is most effective because of the chemical similarity of polyacetylene with EPDM.The effect ofJ.W.M.Noordermeer(*),R.N.Datta,W.K.Dierkes,R.Guo,T.Mathew,A.G.Talma,and M.TiwariUniversity of Twente,Faculty of Engineering Technology,Department of Elastomer Technology and Engineering(ETE),7500AE Enschede,The Netherlandse-mail:j.w.m.noordermeer@utwente.nlW.van OoijDepartment of Chemical and Materials Engineering,University of Cincinnati,Cincinnati,OH 45221-0012,USAJ.W.M.Noordermeer et al. polyacetylene coating on fullerene soot in pure S-SBR is practically negligible,but in a S-SBR/EPDM blend,largely improved mechanical properties are obtained (like with silica).Polyacetylene-modified sulfur is evaluated as a curative in a50:50blend of S-SBR/EPDM.In pure S-SBR,the mechanical properties decrease with the polyacetylene coating due to a reduced release rate of the sulfur out of its shell. The cure and mechanical properties of the S-SBR/EPDM blend are nearly doubled because of improved compatibility.The results demonstrate the versatility of plasma polymerization of various monomers onto rubberfillers and vulcanization ingredients.The largest effects are seen in blends of different rubbers with unequal polarities.Substantial improve-ments in mechanical properties are seen in comparison with the use of unmodified fillers and curatives.Keywords BlendsÁPlasma polymerizationÁReinforcingfillersÁRubberÁSurface polarityÁVulcanizationContents1Introduction2Plasma Polymerization2.1Hot and Cold Plasma2.2Mechanism of Plasma Polymerization2.3Operational Parameters2.4Plasma Generation2.5Surface Modification of Powder Substrates by Plasma2.6Plasma Modification of Fillers for Rubber Applications3Plasma Polymerization onto Silica and Carbon BlackFillers,and onto Sulfur Vulcanization Agent3.1Plasma Reactors3.2Materials3.3Process Conditions for Plasma Deposition3.4Characterization Techniques for Plasma-Modified Fillers and Sulfur3.5Characterization of Plasma-Coated Powders4Polyacetylene-,Thiophene-and Pyrrole-Coated Silica in Rubber4.1Silica in Pure S-SBR4.2Silica in a S-SBR/EPDM Blend5Polyacetylene-Coated Carbon Black in Rubber5.1Carbon Black in Pure S-SBR5.2Carbon Black in a SBR/EPDM Blend6Polyacetylene-Coated Sulfur in Rubber6.1Sulfur in Pure S-SBR6.2Sulfur in a S-SBR/EPDM Blend7ConclusionsReferencesSurface Modification of Fillers and Curatives by Plasma Polymerization1IntroductionRubber is not a simple material as commonly assumed,but a complicated composite that contains mainly incompatible components.These components(polymers, reinforcing and nonreinforcingfillers,and curing agents)are incompatible due to polarity differences.Furthermore,polymers as such are commonly immiscible in other polymers because they often differ in the degree of carbon–carbon unsa-turation and in the heteroatoms contained in the polymer chains and,consequently, possess different polarities.The thermodynamic criterion for miscibility is a nega-tive Gibbs free energy of mixing[1].The Gibbs free energy of mixing is given by the following equation:D G m¼D H mÀT D S m:(1)In this equation,D H m is the change in enthalpy of mixing,and D S m the change in entropy of mixing.T is the absolute temperature.The change in enthalpy during mixing is the result of the interaction energy between the different components, and is for different polymers mostly positive.This interaction energy arises from hydrogen bonds,dipole interactions,van der Waals interactions,acid–base inter-actions,and Coulombic interactions.The change in entropy is usually very small due to constraints of the segmental mobility of the polymer chains,and is too small to compensate for the positive enthalpy of mixing.Consequently,immiscibility is more likely for polymer mixtures than miscibility.Additionally for rubber compounds,the differences in polarity and unsaturation of the various polymers cause different affinities forfillers and curing additives.In blends of different rubber polymers,the reinforcingfiller carbon black for instance locates itself preferentially in the phase with the higher unsaturation and/or polarity, leaving the lower unsaturation or nonpolar phase unreinforced.The affinity for carbon black decreases in the following order of polymers[2]:BR>SBR>CR>NBR>NR>EPDM>IIR;where BR¼polybutadiene rubber,SBR¼styrene-butadiene copolymer rub-ber,CR¼polychloroprene rubber,NBR¼acrylonitrile-butadiene copolymer rubber,NR¼natural rubber(cis-polyisoprene),EPDM¼ethylene-propylene-diene copolymer rubber,and IIR¼isobutene-isoprene copolymer rubber(butyl rubber).The consequence is an inhomogeneous distribution of additives in the individual polymer phases and thermodynamic nonequilibrium after mixing.The latter effect may cause demixing and reagglomeration of additives.A well-known example in this regard is theflocculation or reagglomeration of silica in S-SBR compounds[3].In dissimilar rubber/rubber blends,vulcanization ingredients also preferentially end up in only one of the phases,resulting in overcuring of this phase and under-curing of the other one.An example of this effect is the solubility of“insoluble sulfur,”which is much lower for NBR than for SBR and EPDM.J.W.M.Noordermeer et al.There are several practical ways to potentially overcome the incompatibility of the main compounding ingredients:1.Modification of the polymers in order to better match their polarity with theother compound components2.Surface modification of thefillers and curing agents in order to increase theirwettability and interaction with the polymers3.Adjustment of the mixing process,e.g.,Y-mixing[4]In the following section,a new technique of surface modification offillers and curing agents will be discussed:plasma polymerization.This technique allows for surface coating of powders,whereby the chemical structure of the coating is determined by the monomer used for the process.The morphology of the substrate is preserved,which is an important precondition forfiller treatment.The polarity of the functional groups can be chosen tofit the matrix of the polymer wherein it will be applied.2Plasma Polymerization2.1Hot and Cold PlasmaPlasma polymerization is a technique for modifying the surfaces of various sub-strates.It is a thin-film-forming process,whereby thesefilms deposit directly on the surfaces of the substrates.In this process,the growth of low molecular weight monomers into high molecular weight polymer networks occurs with the aid of plasma energy,which involves activated electrons,ions,and radicals.A plasma is a mixture of electrons,negatively and positively charged species,neutral atoms,and molecules.It is considered as being a state of materials,which are more highly activated than in the solid,liquid,or gas phases.Sir William Crooks suggested the concept of the“fourth state of matter”(1879)for electrically discharged matter,and Irving Langmuir[5]first used the term“plasma”to denote the state of gasses in discharge tubes.The plasma state can be created by a variety of means.In general,when a molecule is subjected to a severe condition,such as intense heat,ionization of the molecule takes place.At temperatures higher than10,000K,all molecules and atoms tend to become ionized.The sun and other stars of the universe have temperatures ranging from5,000to70,000K or more,so they consist entirely of plasma.In a laboratory environment,plasma is generated by combustion,flames,electric discharge,controlled nuclear reactions,shocks etc.Because a plasma loses energy to its environment mainly by radiation and conduction to walls,the energy must be supplied as fast as it is lost in order to maintain the plasma state.Of the various means of maintaining the plasma state continuously for a relatively long period ofSurface Modification of Fillers and Curatives by Plasma Polymerizationtime,the most obvious and most common method is the use of an electrical discharge.For this reason,most experimental work,particularly in the study of plasma polymerization,is carried out using some kind of electrical discharge. Among the many types of electrical discharges,glow discharge is by far the most frequently used in plasma polymerization.Plasma states can be divided into two main categories:hot plasmas(near-equilibrium plasmas)and cold plasmas(nonequilibrium plasmas).Hot plasmas are characterized by very high temperatures of electrons and heavy particles,both charged and neutral and which are close to their maximal degrees of ionization. Cold plasmas are composed of low temperature particles(charged and neutral molecular and atomic species)and relatively high temperature electrons and they are associated with low degrees of ionization.Hot plasmas include electrical arcs, plasma jets of rocket engines,thermonuclear reaction generated plasmas,etc. Cold plasmas include low-pressure direct current(DC)and radio frequency(RF) discharges,and discharges fromfluorescent(neon)light tubes.Corona discharges are also considered to be cold plasmas.Hot plasmas have an extremely high energy content,which induces fragmenta-tion of all organic molecules to atomic levels and,as a consequence,these plasmas can only be used for generating extremely high caloric energy or to modify thermally stable inorganic materials.Hot plasma applications for processing mate-rials have been created with the use of plasma arc heaters,and three distinct application areas have emerged:synthesis,melting,and deposition.The progress in thermal plasma processing has been limited,however,by an unsatisfactory understanding of the extremely complex reaction kinetics,transport properties, heat transfer,and particle dynamics during gas–solid and gas–gas interactions.As a result,thermal plasma processing has only progressed beyond laboratory and pilot scale stages in a few cases.Low pressure nonequilibrium discharges,cold plasmas,are initiated and sus-tained by DC,RF,or microwave(MW)power transferred to a low pressure gas environment,with or without an additional magneticfield.Ultimately,all these discharges are initiated and sustained through electron collision processes under action of specific electric or electromagneticfields.Accelerated electrons induce ionization,excitation,and molecular fragmentation processes leading to a complex mixture of active species.The work described in this manuscript was carried out using a cold plasma process.The glow discharge is formed by exposing a gaseous monomer at low pressure (<10Torr)to an electricfield.Energy is transferred by the electricfield to release electrons,which collide with molecules,electrodes,and other surfaces.Inelastic electron collisions with molecules generate more electrons,as well as ions,free radicals,and excited molecules.Although the degree of ionization is low,the amount of charged particles plays an important role in the deposition rate and in determining the chemical structure of the plasmafilm generated.All fragments are very reactive towards surfaces exposed to the plasma and mutually with other fragments.The average electron energy in a low pressure discharge is in the range of2–5eV[6].The electron energy distribution in a low pressure dischargeJ.W.M.Noordermeer et al. follows a Maxwellian–Druyvesteyn distribution.There is a high-energy tail,which means that there are some high-energy electrons(8–14eV),but of lower concen-tration,which have a significant impact on the overall reaction rates in the plasma.At low pressures,the electron temperature is much higher than the temperature of the gas.The temperature of an electron with energy of2eV will be23,200K. Even though the individual electrons are very hot,the system or gas remains at ambient temperature.Because of the very low density and very low heat capacity of the electrons,the amount of heat transferred to the gas and to the walls of the container is very small.Thus the term“cold plasma”derives its meaning from the small amount of heat transferred to the gas or solids in contact with it.2.2Mechanism of Plasma PolymerizationChemical reactions that occur under plasma conditions are generally very complex [7]and consequently are nonspecific in nature.Such reactions are of merit when special excited states of molecules are required as intermediate states and cannot be achieved,or can only be achieved with great difficulty,by conventional chemical reactions.Thus,plasma polymerization should be recognized as a special means of preparing unique polymers that cannot be made by other methods.The capability of plasma polymerization to form ultrathinfilms with minimumflaws is unique.Plasma polymers are deposited on surfaces in contact with a glow discharge of organic or organometallic monomers,in the form of a thinfilm and/or as a powder. Suchfilmsfind applications as surface modifiers and in applications where the bulk properties of extremely thinfilms are desirable.The following are some important characteristics of plasma polymerfilms:1.They can be easily formed with thickness of50nm–1m m2.Suchfilms are often highly coherent and adherent to a variety of substrates,including conventional polymers,glass,and metal surfaces3.Thefilms are commonly pinhole-free and highly crosslinked4.Multilayerfilms orfilms with grading of chemical or physical characteristics areeasily produced by this processFor most practical coating processes,the monomerflows into a plasma reactor with a continuous glow discharge,and is wholly or partially consumed in the conversion to plasma polymer.In such a setup,gaseous by-products and uncon-verted monomer are continuously pumped out of the reactor.In a plasma polymerization process,the growth of low molecular weight monomer species to a high molecular weight plasma polymer network takes place.In a chemical sense,plasma polymerization is different from conventional polymerizations,such as radical or ionic.The term radical polymerization means that propagating reactions of monomers are initiated by radical species.Ionic polymerization means that chemical reactions are propagated by ionic species in the polymerization step.Plasma polymerization involves an energy source toinitiate the polymerization reactions.Polymers formed by plasma are entirely different from those formed by ionic or radical polymerizations.The monomers are transformed into a highly crosslinked three-dimensional network.A schematic representation of a plasma polymer is shown in Fig.1.On the basis of various investigations,scientists have proposed different mechanisms for the plasma polymerization process.An ionic mechanism was proposed by Williams and Hayes [9],Haller and White [10],Westwood [11],and Thompson and Mahayan [12],separately.A radical mechanism was proposed by several other investigators [6,13–17].The argument for a radical mechanism was based on the observations that (1)the magnitude of energy required to form radicals (3–4eV)is considerably less than that required to form ions (9–13eV);(2)the average electron energy in a low pressure discharge is typically 2–5eV;(3)the radical concentration in discharge (10À2–10À1of the neutral species)is much higher than the ion concentration (10À6–10À5of the neutral species);(4)there is no correlation between polymer deposition rate and the ionization potential of the used monomer;and (5)a considerable amount of radicals remain in the deposited polymer.Yasuda explained the plasma polymerization process by a new concept of atomic polymerization [18].In the plasma,monomer molecules gain high energy from electrons,ions,and radicals,and are fragmented into activated small frag-ments and in some cases into atoms.These activated fragments recombine,some-times accompanied by rearrangement,and the molecules grow to large molecular weight in the gas phase or at the substrate (Fig.2).The repetition of activation,fragmentation,and recombination leads to polymer formation.This concept is essentially different from the mechanism of conventional polymerization,whereby monomers are linked together through chemical reactions without alteration of the chemical structure of the monomer or,in some cases,with only small alterations by loss of small fragments from two monomers.Therefore,the chemical structure of the formed polymer chains can be predicted from the chemical structure of the monomer.However,the chemical structure of the plasma polymer can never be predicted from the structure of the monomer used,because fragmentationandFig.1Schematic representation of a plasma polymer [8]Surface Modification of Fillers and Curatives by Plasma Polymerizationrearrangement of the monomers occur in the plasma.The concept of atomic polymerization is well accepted among various investigators,and it allows the interpretation of features of the plasma polymerization process and of the chemical and physical properties of the formed polymers.Because both fragmentation and recombination occur in a plasma,starting molecules for plasma polymerization are not restricted to unsaturated compounds,and saturated compounds can also be transformed into polymers.The rate constant of the process will be slightly higher for unsaturated compounds.The propagation reaction in plasma polymerization is not a chain reaction through double bonds,but a stepwise reaction of recombination of biradicals that are formed from fragmenta-tion of the starting compounds by the plasma (Fig.2).How the starting molecules are fragmented into activated small fragments depends on the energy level of the plasma and the nature of the monomer mole-cules.This is a reason why plasma polymers possess different chemical composi-tion when the plasma polymerization is operated at different conditions,such as different monomer flow rate,RF power,and pressure of the reaction chamber,even if the same starting materials are used for the plasma polymerization.The fragmentation of starting molecules in a plasma is represented by two types of reactions:the elimination of hydrogen atoms and C–C bond scission.Hydrogen elimination is considered to contribute greatly to the polymer-forming process in plasma polymerization.Actually,the gas phase of a closed system after plasma polymerization of hydrocarbons (converted to polymers at yields of 85–90%)is mainly composed of hydrogen,and the amount of hydrogen eliminated by plasma (hydrogen yield per monomer molecule)in the gas phase increases by increasing the number of hydrogen atoms in a hydrocarbon molecule [19].Therefore,it seems probable that hydrogen atoms are eliminated from monomer molecules by plasma to result in the formation of monoradicals and biradicals and,then,the addition of the radicals to a monomer and the recombination between two radicals proceed to make large molecules with or without a radical.Figure 3shows an essential polymer-forming process in plasma polymerization,which was proposed by Yasuda [20].The stepwise reaction may be predominant in the polymer-forming process.Chain reactions of the radicals M i *and *M k *,via double bonds and triple bonds to form polymers,will occur infrequently because of a lower ceiling temper-ature (T ceiling ).The Gibbs free energy (D G )of polymerization by chain reactions is:A-B-C-D-E-FStarting molecule Plasma [ A-B-C-D-E-F]*Activation by plasma FragmentationA* *E-F *D**C* A-B* *F *E* *B* *C-D*Fragments in plasma state RearrangementA-D-B-E-D-F-E-C-B Plasma polymerFig.2Schematic representation of plasma polymerizationJ.W.M.Noordermeer et al.D G ¼D H ÀT D S :(2)As the reaction temperature is raised,the magnitude of –T D S increases.When the reaction temperature is raised to T ceiling,where the magnitude of –T D S is equal to D H ,the Gibbs free energy is zero;therefore at T ceiling the reaction is at equili-brium between polymerization and depolymerization.This temperature is called the ceiling temperature of polymerization.Above T ceiling the polymerization never proceeds spontaneously.The ceiling temperature is a function of pressure,and most monomers at low pressure show lower ceiling temperatures than at 1atm.Then,the T ceiling is too low to expect appreciable polymer formation by the chain reactions.Also,because of the very small number of molecules available in a vacuum,the relatively slow process of step growth polymerization fails to explain the rather rapid formation of polymers that is found in plasma polymerization.Thus,the most acceptable mechanism for plasma polymerization taking place in a vacuum,is the one given by Yasuda.2.3Operational ParametersThe fragmentation process depends on how much electrical energy (RF power)is supplied to maintain the plasma,how much monomer is introduced into the plasma,and where the monomer molecules interact with activated species of the plasma.Yasuda proposed a controlling parameter or W/FM value,where W,F,and M are RF power [J/s],the monomer flow rate [mol/s],and the molecular weight of the monomer [kg/mol],respectively [21].The W/FM parameter is an apparent input energy per unit of monomer molecules [J/kg];therefore,the magnitude of the W/FM parameter is considered to be proportional to the concentration of activated species in the plasma.The polymer formation rate (polymer deposition rate)increases by increasing the W/FM parameter in the operational condition,wherebyFig.3Overall plasmapolymerization mechanism Surface Modification of Fillers and Curatives by Plasma Polymerizationthe activated species have a far lower concentration than monomer molecules in the plasma;this is called the monomer-sufficient region.With a further increase in W/FM,the polymer formation rate levels off (the competition region).The polymer formation rate decreases with further increase of the W/FM parameter because of lack of monomer molecules (the monomer-deficient region).The domains of plasma polymerization are schematically illustrated in Fig.4.In the monomer-sufficient region,monomer molecules are subjected to less fragmentation during plasma-polymerization,and plasma polymers with little rearrangement and little loss of groups such as hydrogen,hydroxyl groups,and carbonyl groups are formed.In the monomer-deficient region,monomer molecules are subjected to heavy fragmentation,and plasma polymers with much rearrange-ment and a large loss of some groups are ually,plasma polymerization is operated in the monomer-sufficient region.The monomer flow rate is also a factor in controlling plasma polymerization.At a constant level of energy input,an increase of the monomer flow rate results in a decrease of the W/FM parameter and the domain of plasma polymerization may change from the monomer-deficient region to the monomer-sufficient region.The hydrodynamic factors that influence the plasma polymerization process pose a complicated problem and are of importance in the application of plasma for thin film coatings.When two reaction chambers with different shapes or sizes are used and when plasma polymerization of the same monomer is operated under the same operational conditions of RF power,monomer flow rate,pressure in the reaction chamber etc.,the two plasma polymers formed in the two reaction cham-bers are never identical because of the differences in the hydrodynamic factors.In this sense,plasma polymerization is a reactor-dependent process.Yasuda and Hirotsu [22]systematically investigated the effects of hydrodynamic factors on the plasma polymerization process.They studied the effect of the monomer flow pattern on the polymer deposition rate in a tubular reactor.The polymer deposition rate is a function of the location in the chamber.The distribution of the polymer deposition rate is mainly determined by the distance from the plasma zone and the W/FM ParameterP o l y m e r d e p o s i t i o n r a t eM o n o m e r s u f f i c i e n t r e g i o n C o m p e t i t i o n r e g i o nM o n o m e r d e f i c i e n t r e g i o n Fig.4Domains of polymerdeposition.W,F,and M areRF power,the monomer flowrate,and the molecular weightof the monomer,respectivelyJ.W.M.Noordermeer et al.direction of pumpingflow.The direction of monomerflow has less influence on the distribution of the polymer deposition rate.These results emphasize the importance of(1)the diffusion transport of the energy-carrying species(electrons,ions,radi-cals)of the plasma;(2)theflow of monomer and product gas,and of fragments generated by the plasma;and(3)the diffusion transport of polymer-forming species and radicals.A similar investigation of the hydrodynamic effect on the polymer deposition rate using a bell-jar type reactor was done by Kobayashi et al.[23].The experimen-tal data using two reactors with different shapes indicated that the polymer deposi-tion rate does not become uniform at any spot of the reactor,even if the patterns of the diffusion transport of the energy-carrying species of plasma,of theflow of monomer and product gas,and of the diffusion transport of the polymer-forming species are changed.This means that a certain degree of thickness variation always exists when a plasma polymer is deposited on a stationary substrate in a reactor.The thickness variation can be avoided by moving the substrate when plasma polymer is deposit in the reactor.Inagaki and Yasuda[24]designed a special reactor in which a moving substrate plate was positioned midway between two parallel electrodes and was repeatedly rotated at60rpm in and out of the plasma zone.The polymer deposition rate at any place on the moving substrate was very uniform.This aspect is applicable to tubular type reactors.2.4Plasma GenerationTo reach the plasma state of atoms and molecules,energy for the ionization must be absorbed by the atoms and molecules from an external energy source.Furthermore, the plasma state does not continue at atmospheric pressure,but at a low pressure of 1–10À2Torr.The essential items for plasma generation are(1)an energy source for the ionization;(2)a vacuum system for maintaining the plasma state;and(3)a reaction chamber.Generally,electrical energy is used as the energy source for the ionization of atoms and molecules because of the convenience of handling.Direct current(DC), commercial alternating current(AC)at a frequency of50or60Hz,and AC with a high frequency of more than60Hz,e.g.,10or20KHz(audio frequency), 13.56MHz(radio frequency),or2.45GHz(microwave frequency),are all appli-cable for energy supply.These electric powers are basically supplied to atoms and molecules in the reaction chamber from a pair of electrodes placed in the reaction chamber in a capacitive coupling manner with the electrical generator.An inductive coupling manner is also possible for electrical generators with a high frequency of more than1MHz.A vacuum system composed of a combination of a rotary pump and an oil diffusion pump is frequently used.Although use of a rotary pump alone can reach low pressures of1–10À2Torr,use of both rotary and oil diffusion pumps is desirable because less gas remains in the reaction chamber.。
Applied Catalysis B:Environmental 132–133 (2013) 433–444Contents lists available at SciVerse ScienceDirectApplied Catalysis B:Environmentalj o u r n a l h o m e p a g e :w w w.e l s e v i e r.c o m /l o c a t e /a p c a tbNi/Al–Mg–O solids modified with Co or Cu for the catalytic steam reforming of bio-oilJ.Remón,J.A.Medrano,F.Bimbela,L.García ∗,J.ArauzoThermochemical Processes Group (GPT),Aragon Institute for Engineering Research (I3A),Universidad de Zaragoza,Mariano Esquillor s/n,E-50018Zaragoza,Spaina r t i c l ei n f oArticle history:Received 1June 2012Received in revised form 26November 2012Accepted 13December 2012Available online 21 December 2012Keywords:Hydrogen Bio-oilSteam reforming Nickel Copper Cobalt Fixed bed Fluidized beda b s t r a c tAn environmentally friendly method of producing a hydrogen rich gas is the catalytic steam reforming of bio-oil.This requires the development of a catalyst appropriate for the process.In the present work,five different research catalysts have been prepared and tested.A Ni/AlMg catalyst was selected as a reference.Modifications to the catalyst were studied,incorporating Co or Cu by coprecipitation or by incipient wetness impregnation.The experiments took place at 650◦C and atmospheric pressure in a fixed bed and in a fluidized bed reactor,using an aqueous fraction (S/C =7.6mol H 2O/mol C)of pine sawdust bio-oil.A spatial time (W /m org )of 4g catalyst min/g organics and an u /u mf ratio of 10(in fluidized bed)were used.In both reactors,the coprecipitated NiCo/AlMg catalyst showed the best performance.Over a period of 2h,0.138g H 2/g organics and 80%carbon conversion to gas were obtained in the fixed bed reactor.The catalyst deactivation rate was higher when the steam reforming took place in the fixed bed reactor,although the initial H 2and CO 2yields were higher.In contrast,the stability of the catalysts was higher in the fluidized bed reactor.Elemental analysis,FESEM and TPO analyses of some of the catalysts revealed a relationship between their stability and the quantity and characteristics of the coke deposited on their surface.© 2012 Elsevier B.V. All rights reserved.1.IntroductionBiomass waste processing technologies are receiving increasing attention mainly because biomass is the only renewable source of carbon that can be converted into solid,liquid and gaseous products through different conversion processes [1].Furthermore,biomass processing meets the difficult challenge of producing energy,chem-icals and fuels through so-called ecologically friendly processes.A hydrogen rich gas can be produced by the catalytic steam reforming of the aqueous fraction of pyrolysis liquids.This was first proposed by the National Renewable Energy Laboratory (Colorado,USA)in 1994.The strategy implies the separation of the pyroly-sis liquid (bio-oil),which is first obtained after flash pyrolysis of biomass,in two phases by water addition.The non-soluble frac-tion,consisting of lignin-derived compounds,can be used for the production of high value added chemicals,whereas the aqueous phase [2]can be catalytically reformed to produce a gas with a high H 2content.Depending on the reaction conditions and the catalyst used,different chemicals could be produced from this H 2rich gas in a third generation bio-refinery [3].∗Corresponding author.Tel.:+34976762194.E-mail address:luciag@unizar.es (L.García).The catalyst plays an important role in the catalytic steam reforming of the aqueous fraction of bio-oil.Specifically,the cata-lyst must enhance the reaction rate of the reforming process,which includes both the reforming reaction and the subsequent water gas shift (WGS)reaction.In addition,it must have high deactivation resistance and sufficient strength if the process is to take place in a fluidized bed reactor [2,4].A good approach to this challenge is using Ni-based catalysts.Although cost-effective and having high activity and selectivity,these catalysts are susceptible to deacti-vation by carbon formation on their surface [5].There are two methods of improving their resistance to coke deactivation:the enhancement of water adsorption on the catalyst support in order to gasify the coke or its precursors by modifying the support,and the modification of the active metal surface via the presence of other metals [5,6].In previous works with coprecipitated Ni/Al catalysts,the Ni content was optimized (28%)for the steam reforming of model compounds (acetic acid,acetol and butanol)of bio-oil [7,8].In a fur-ther attempt to improve the catalyst,it was found that the catalyst with a relative Mg/Al molar ratio of 0.26showed the best perfor-mance in the steam reforming of acetic acid and acetol [9]as well as in the reforming of an aqueous fraction of bio-oil [2].The main goal of this work is to study the active phase modifi-cation of the Ni/AlMg catalyst (selected as the reference catalyst0926-3373/$–see front matter © 2012 Elsevier B.V. All rights reserved.434J.Remón et al./Applied Catalysis B:Environmental132–133 (2013) 433–444in the present work)with other metals in order to improve its behaviour as well as to reach a better understanding of the main factors affecting catalyst deactivation in this process.The modification of the nickel phases(but not the support)in order to minimize carbon formation can be performed with metals such as Co,Cu,Cr,Mo,W,Re,Sr and Sn[6].The major carbon-preventing effect of these promoters is to block the step sites on Ni particles,preventing the creation of nucleation sites responsible for graphite formation.The addition of tiny amounts of Co to the catalyst has been studied by different authors[5,6]who reported that Co formed alloys with Ni and possibly reduced the crystallite size.Hu et al.[10]worked with a non-supported Ni–Co catalyst with different Ni/Co ratios.They also reported that Co was more active than Ni in the water gas shift(WGS)reaction.Ramos et al.[11]investigated the steam reforming of acetol over a coprecipitated Ni–Co/Al cata-lyst.Bona et al.[12]studied the steam reforming of toluene using coprecipitated Ni/Al catalysts modified with cobalt,obtaining the best results when using a Co/Ni ratio of0.10.The literature concerning the use of Cu as a modifier in Ni/Al catalysts focuses on the thermal decomposition of methane for the production of H2and of both carbon nanofibers and nanotubes.In these works,the role of Cu was associated with the inhibition of the formation of encapsulating coke[13],graphite layers[14]and carbon gasification[15].A coprecipitated NiAlCu catalyst,prepared at constant pH,was tested in the steam reforming of model com-pounds of biomass pyrolysis liquids(acetic acid,acetol and butanol) by Bimbela et al.[16].The results showed that the performance of the catalyst was improved with the presence of Cu in the steam reforming of acetic acid.Taking these factors into account,Co and Cu were selected as modifiers of the coprecipitated Ni/AlMg reference catalyst in this work.The incorporation of the modifier was carried out using two different methods:coprecipitation and incipient wetness impreg-nation.The use of these tri-metallic catalysts for catalytic steam reform-ing or for any other application has not been reported in the literature.Therefore,this work represents a novel investigation in the search for an appropriate catalyst for the steam reforming of the aqueous fraction of bio-oil.Furthermore,the catalytic steam reforming experiments were carried out in afixed bed and in a fluidized bed reactor in order to study how the gas–solid contact influences the reforming process in general and the catalyst per-formance in particular.2.Experimental2.1.Experimental systemThefixed bed system,shown in Fig.1,was based on a micro-reactor test facility consisting of afixed bed of25mm in height placed inside a tubular quartz reactor of9mm inner diameter.N2 was used as a carrier gas to facilitate the feeding of the aqueous frac-tion,preventing its polymerization inside the feeding system which could plug the feed line.It was necessary to ensure that the aqueous fraction entered the reactor in liquid phase.The gaseous mixture emerging from the bed passed to a condensation system consisting of a steel vessel cooled by means of a Peltier thermoelectric cell. The non-condensable gases were analyzed online with an Agilent M3000micro gas chromatograph equipped with thermal conduc-tivity detectors.A more detailed description of the installation can be found in our previous communication[7].Thefluidized bed installation,shown in Fig.2,consisted of a bench-scale installation with a tubular2.54cm inner diameter Table1Characteristics of the pyrolysis liquid and its aqueous fraction.Pyrolysis liquid Aqueous fraction Elemental analysis(wt%)C36.077.35H8.4510.82N0.100.00O a55.3781.83Water content b(wt%)36.3084.23Water/carbon ratio(mol/mol)0.677.60Empirical formula for the organics CH1.47O0.48CH2.39O0.71a By difference.b Karl–Fischer analysis,using a high level water quantification apparatus. reactor by being sprayed through a quartz coaxial injection nozzle placed inside a cooling jacket,described elsewhere[2],to avoid the polymerization of non-volatile compounds in the injection system when introducing the feed.The gases emerging from the upper part of the reactor passed through a condensation ice trap.The non-condensable gases continued and passed through a cottonfilter. Finally,the gaseous mixture leaving thefilter passed to an Agilent P200Micro gas chromatograph equipped with thermal conductiv-ity detectors.N2was used as a carrier gas,as a standard gas as well as forfluidization purposes[4].The catalytic beds consisted of a mixture of catalyst and sand, both with a particle size of160–320m.A bed height of2.5mm and7cm(infixed bed conditions)was used in thefixed bed and fluidized bed reactors,respectively.In both installations,H2,CO, CO2,CH4,N2,C2H4,C2H6and C2H2were measured online during each experiment.All the catalytic reforming experiments were carried out at atmospheric pressure and at a temperature of650◦C for 2h,using a W/m org(mass of catalyst/organics massflow)of 4g catalyst min/g organics.This corresponds to a G C1HSV(volume of C1-equivalent species in the feed at standard temperature and pressure per unit volume of catalyst,including the void fraction per hour)of about13,000h−1[17].For this purpose,0.07g and0.5g of catalyst were placed in the catalytic bed and a liquidflow of 0.12mL/min and0.76mL/min was used in thefixed bed and in the fluidized bed reactor,respectively.Previous to the catalytic reaction,all the catalysts were in situ reduced using a mixture of H2and N2(1:10,v/v)at650◦C for1h.A u/u mf ratio of10,defined as the ratio between the superficial gas velocity and the velocity for minimumfluidization theoretically calculated[18],was used in thefluidized bed experiments.2.2.Aqueous fraction of pyrolysis liquidsThe pyrolysis liquid(bio-oil),obtained from pine sawdust and produced using a rotating cone reactor,was supplied by BTG.Its corresponding aqueous fraction was obtained by adding the pyrol-ysis liquid to water at a1:2weight ratio using a similar method to that described by Sipiläet al.[19].The characteristics of both the raw pyrolysis liquid as supplied and its corresponding aqueous fraction as prepared are listed in Table1.2.3.Catalyst preparation methodFive different research catalysts were prepared in the laboratory using both coprecipitation and impregnation methods.Ni,Al and Mg were present in all the catalysts,whereas Co or Cu was added to some of them as active phase modifiers.A similar method as that described by Al-Ubaid and Wolf[20]was used for preparing theJ.Remón et al./Applied Catalysis B:Environmental132–133 (2013) 433–444435Fig.1.Schematic of thefixed bed steam reforming experimental system.2.3.1.Coprecipitated catalystsNi/AlMg,NiCu/AlMg and NiCo/AlMg catalysts were prepared using the coprecipitation method.The coprecipitated Ni/AlMg catalyst having28%(relative atomic percentage)Ni expressed as Ni/(Ni+Al+Mg)and a Mg/Al atomic ratio of0.26was selected as the reference catalyst due to its good performance when reforming model compounds of pyrolysis liq-uids such as acetic acid and acetol,as well as the aqueous fraction of pyrolysis liquids[2,9].It was prepared by adding a solution of NH4OH to a solution containing Ni(NO3)2·6H2O,Al(NO3)3·9H2O and Mg(NO3)2·6H2O dissolved in milli-Q water until a pH of8.2 was reached.The precipitation medium was maintained at40◦C and moderately stirred.Both coprecipitated catalysts modified with Cu or Co (NiCu/AlMg and NiCo/AlMg)had the same nickel content as the reference catalyst,28at%,expressed as Ni/Ni+Al+Mg+Cu and Ni/Ni+Al+Mg+Co.Cu/Ni and Co/Ni atomic ratios of0.033and 0.10[12]were used when preparing the coprecipitated NiCu/AlMg and NiCo/AlMg catalysts,respectively.The preparation method of these two catalysts was similar to that already described for the reference catalyst,except for the presence of Cu(NO3)2·3H2O and Co(NO3)2·6H2O in the salt solution for the preparation of the NiCu/AlMg and NiCo/AlMg,respectively.Thefinal pH was7.9and 8.2,respectively.The hydrated precursors of the three coprecipitated catalysts werefiltered,washed at40◦C and dried overnight at105◦C.After-wards they were ground and sieved to a particle size ranging from 160to320m and calcined in an air atmosphere up to a tempera-ture of750◦C for3h.2.3.2.Impregnated catalystsTwo impregnated catalysts(Imprg.Cu and Imprg.Co)were prepared using the reference Ni/AlMg catalyst as support,incor-porating Cu or Co by incipient wetness impregnation.Solutionsof436J.Remón et al./Applied Catalysis B:Environmental132–133 (2013) 433–444Table2Comparison between theoretical and experimental(ICP-OES)Ni/Al,Mg/Al,Cu/Ni and Co/Ni ratios.Theoretical ratios(at.)Experimental ratios(at.)Ni/Al Mg/Al Cu/Ni or Co/Ni Ni/Al Mg/Al Cu/Ni or Co/NiNi/AlMg0.490.26–0.480.23–NiCu/AlMg0.490.260.0330.500.240.023NiCo/AlMg0.490.260.100.510.230.10Imprg.Cu0.490.260.0240.480.230.024Imprg.Co0.490.260.0400.440.240.041Cu(NO3)2·3H2O and Co(NO3)2·6H2O were respectively used for the preparation of the Imprg.Cu and Imprg.Co catalysts,with Cu/Ni and Co/Ni atomic ratios of0.024and0.04.These ratios were lower than the respective coprecipitated ratios in order to have comparable superficial quantities of Cu and Co between the coprecipitated and impregnated catalysts.After the impregnation,the hydrated cata-lyst precursors were subjected to the same drying and calcination treatments as the coprecipitated catalysts.2.4.Catalyst characterizationThe fresh calcined catalysts were characterized by differ-ent techniques.These included optical emission spectrometry by inductively coupled plasma(ICP-OES),X-ray diffraction(XRD), BET nitrogen adsorption and temperature-programmed reduction (TPR).The elemental analysis of the catalysts was carried out by ICP-OES using a Thermo Elemental IRIS INTREPID RADIAL system equipped with a Timberline IIS automatic apparatus.The samples werefirst dissolved(the hydrated precursors in the case of the coprecipitated catalysts and the calcined catalysts in the case of the impregnated ones)in aqua regia and diluted to a concentra-tion approximately between5and50ppm(detection range of the instrument).XRD patterns of the calcined catalysts were obtained with a D-Max Rigaku diffractometer equipped with a CuK␣1.2at a tube voltage of40kV and current of80mA.The measurements were carried out using continuous-scan mode with steps of0.03◦/s at Bragg’s angles(2Â)ranging from5◦to85◦.The phases present in the samples were defined by means of the JCPDS-International Centre for Diffraction Data2000database.The textural properties of the calcined catalysts such as BET surface area and the average pore size and volume(BJH method) were calculated from N2physisorption isotherms,using the BET volumetric method.The N2adsorption–desorption isotherms were obtained at77K and room temperature,respectively,over the whole range of relative pressures using a TRISTAR II300 V.608A analyser obtained from MICROMETRICS ASAP2020.The samples were previously degasified at200◦C during8h in N2flow.The reducibility of the catalysts was analyzed by TPR.The measurements were carried out with a10%H2/Ar gasflow of 50cm3(STP)/min from room temperature up to1000◦C at a rate of10◦C/min.The H2consumption was measured with a thermal conductivity detector.Carbon deposited on some of the catalysts was characterized byfield emission scanning electron microscopy(FESEM),elemen-tal and temperature programmed oxidation(TPO)analysis.FESEM images from some of the used samples were taken with a Carl Zeiss MERLIN TM microscope using an augmentation of10,000times. Before the analysis,the samples were covered with Pt.TPO analyses were carried out in a20%O2/He gasflow of100(STP)cm3/min from room temperature to900◦C at a rate of10◦C/min.CO2generation 3.Results and discussion3.1.Catalyst characterization resultsThe results obtained in the ICP-OES analyses are summarized in Table2,where the Ni/Al,Mg/Al,Cu/Ni and Co/Ni theoretical ratios are compared with their corresponding experimental ratios.A good concordance between theoretical and experimental val-ues was achieved,showing adequate preparation methodologies for the incorporation of all the elements present in the catalysts. As an exception,it can be pointed out that there is a slight dis-agreement between theoretical and experimental Cu/Ni ratios for the NiCu/AlMg catalyst.In this case the experimental Cu/Ni ratio is slightly lower than the theoretical one,which indicates that Cu was not completely incorporated in the catalyst.This could be a result of all the ammonia complexes that can be formed during its preparation competing with the precipitation reaction,dimin-ishing the amount of Cu precipitated.During the preparation of this catalyst,pH wasfixed at7.9.The experimental Cu content for this catalyst was0.75wt%,slightly lower than the theoretical value (1wt%).Fig.3shows the XRD patterns of thefive fresh calcined cata-lysts.All the samples analyzed have wide and asymmetric peaks, which indicates quite low crystallinity,except for the NiCo/AlMg catalyst whose crystallinity seems to be slightly higher than that of the other catalysts.In addition,a NiO phase is detected in all the catalysts since they all presented a peak at2Âangles of75◦and 79◦,which is consistent with the standard pattern for this crystal phase.A NiAl2O4phase might also be present in the catalysts,but due to the overlapping of NiAl2O4patterns with others,its presence cannot be confirmed by the results of this technique alone.In the reference catalyst(Ni/AlMg),Ni and Mg are present in the form of oxides(NiO,MgO)and their respective spinels(NiAl2O4and MgAl2O4).Nevertheless,the patterns of Ni and Mg oxides have very similar diffraction angles and intensities,which makes it difficult to confirm the presence of MgO phase in the catalyst.Patterns of Ni and Mg spinels also overlap.Analysing the other four catalyst patterns,no great differences are detected in terms of crystallinity and crystal phases,even though two different preparation methods(coprecipitation and impregnation)were used.The main difference between both Cu and Co coprecipitated and impregnated catalysts is found in the second highest intensity peak(2Â=42◦).This peak is slightly higher and narrower for the coprecipitated catalysts,which indicates higher crystallinity.This effect is less marked in the cobalt-modified catalysts where both peaks have similar thicknesses,although the intensity of the cobalt coprecipitated catalyst peak is slightly higher than that of the impregnated one.The peak at2Â=45◦is less intense for the coprecipitated catalysts than the impregnated ones.This could indicate a higher proportion of spinel phases and a lower proportion of oxide phases in the impregnated catalysts and vice versa in the coprecipitated ones.This is consistent with the fact that an increase in the calcination time enhances the formation ofJ.Remón et al./Applied Catalysis B:Environmental 132–133 (2013) 433–444437I n t e n s i t y (a .u .)I n t e n s i t y (a .u .)I n t e n s i t y (a .u .)I n t e n s i t y (a .u .)2I n t e n s i t y (a .u .)Fig.3.XRD patterns of fresh calcined Ni/AlMg,NiCu/AlMg,Imprg.Cu,NiCo/AlMg and Imprg.Co catalysts.twice [13,21].Finally,the presence of Cu and Co oxides and spinelphase cannot be detected by XRD analysis alone.The textural properties of the catalysts prepared are summa-rized in Table 3.All the catalysts have quite a high BET surface paring the coprecipitated with the impregnated catalysts,a slight decrease in the BET area can be seen accompanied by an increase in diameter when the modifier is incorporated into the catalysts by incipient wetness impregnation.This could be a conse-quence of the fact that in the impregnation preparation method,the Table 3Textural properties of the catalysts.S BET (m 2/g),V pore (cm 3/g)and D pore (nm).S BET (m 2/g)V pore (cm 3/g)D pore (nm)Ni/AlMg 1370.15 3.7NiCu/AlMg 1260.14 4.8NiCo/AlMg 1320.21 5.1Imprg.Cu 1170.34 6.6Imprg.Co1120.206.1while in the coprecipitation method all the metals are coprecipi-tated together,leading to the modifier being incorporated not onlyonto the surface but also into the catalyst bulk.From the TPR results shown in Fig.4,two peaks (321and 733◦C)can be appreciated in the reference (Ni/AlMg)catalyst.The first less intense peak is associated with the reduction of the NiO phase with a weak interaction with the support,which is easy to reduce.The second peak indicates the presence of the spinel (NiAl 2O 4)phase,harder to reduce due to its strong interaction with the support [2,9,22].Two peaks are also detected in the copper-modified coprecipi-tated catalyst (NiCu/AlMg).The first (321◦C)might correspond to both the reduction of the bulk CuO phase,whose reduction tem-perature is 360◦C [23],as well as the reduction of the NiO phase.From a quantitative calculation,it was found that this peak corre-sponds to the reduction of 100%of the Cu and around 6%of the Ni contents of the sample.This could indicate the presence of a Cu-rich phase.This phase was not detected for the catalyst containing 1%of Cu in the work of Bimbela et al.[16],possibly due to the different preparation method used in that work.The second peak indicates the presence of the nickel spinel (NiAl 2O 4).H 2consump-tion is lower when compared to the reference (Ni/AlMg)catalyst.This might indicate a lower proportion of spinel phases and conse-quently a higher amount of oxide phases,which is consistent with the XRD analysis as mentioned above.Two peaks are also observed in the modified copper-impregnated catalyst (Imprg.Cu).The first peak (208◦C)is very low and appears at lower temperatures than the first peak in the reference catalyst.This peak corresponds to the highly dispersed CuO contained in the catalyst [23].From a quan-titative calculation it was found that that this peak represents the reduction of 100%of the total amount of Cu present in the sample.The second peak (752◦C)appears at higher temperatures than the020 040 060 080 010001200140Ni/AlMgImprg. Cu NiCu/AlMg NiCo/AlMg Imprg .Co ---------------------------------------733ºC---------------------------321ºC----------------------------860ºC---------------------300ºC ------------------208ºC-----------------------------------752ºCTemp eratu re(ºC)H 2c o n s u p t i o n (a .u .)Fig.4.TPR profiles of the Ni/AlMg,NiCu/AlMg,Imprg.Cu,NiCo/AlMg and Imprg.Co438J.Remón et al./Applied Catalysis B:Environmental132–133 (2013) 433–444second peak of the reference catalyst.This could be indicative of a higher presence of spinel phases and consequently lower oxide phases in this impregnated catalyst in comparison with the refer-ence Ni/AlMg catalyst.This is a consequence of the fact that this catalyst has been calcined twice.An increment in the calcination time leads to a higher content of spinel as well as a lower content of oxide phases[13,21].In the cobalt-modified coprecipitated catalyst(NiCo/AlMg)two peaks are detected.Thefirst peak appears at a temperature of about300◦C and might correspond to the reduction of the NiO phase.The intensity of this peak is higher in the NiCo/AlMg cat-alyst than in the Ni/AlMg,which might indicate that this peak could be the result of both the reduction of the NiO phase as well as the reduction of the Co3O4phase,which has minimal interac-tion with the support[24–26].All these facts may suggest a high Ni–Co interaction[27].The second peak(732◦C),which has the highest intensity,corresponds to the reduction of the nickel spinel (NiAl2O4)phase.In addition,the H2consumption of this second peak is higher than that of the reference Ni/AlMg catalyst,which might indicate that this peak is also a result of the reduction of cobalt species strongly interacted with the support[24–26].In the cobalt-modified impregnated catalyst,only one peak is found in the TPR results.The lower temperature peak disappears.This dis-appearance might indicate that the nickel is present in the form of nickel spinel(NiAl2O4)and that the cobalt strongly interacts with the support[24–26].Finally,a shoulder is detected at higher temperatures(860◦C) for all the catalysts.This shoulder probably indicates the presence of magnesium phases[2],corresponding to NiAl2O4spinel units incorporated into the MgAl2O4spinel structure.The TPR results indicate that while the two catalysts prepared by impregnation could not have low temperature reducible species of Ni(T<400◦C),the catalysts prepared by coprecipitation could have.3.2.Experimental data processingThe performance of thefive prepared catalysts has been tested in the steam reforming of an aqueous fraction of biomass pyrolysis liquid in two different installations,afixed bed reactor facility and afluidized bed.The steam reforming reactions of any oxygenated organic compounds werefirst proposed by[17]and are shown as follows:1-Reforming reactions:Steam reforming of the oxygenated compoundsC n H m O k+(n−k)H2O⇔n CO+(n+m/2−k)H2(1)Water gas shift(WGS)reaction:CO+H2O⇔CO2+H2(2) 2-Other side reactions:Thermal decomposition:C n H m O k→C x H y O z+gas(H2,CO,CO2,CH4,...)+coke(3)Methane steam reforming:CH4+H2O⇔CO+3H2(4) Boudouard reaction:C+CO2⇔2CO(5) Carbon deposits gasification:C+H2O⇔H2+CO(6) The steam reforming results for all the catalysts tested are pre-values of the response variables studied(overall carbon conver-sion to gases,and overall H2,CO2,CO and CH4yields expressed as g of gas/g of organics fed).The evolution with time of these response variables is presented graphically.One-way analysis of variance(one-way ANOVA)was used to evaluate the influence of the catalyst on the catalytic steam reform-ing.Overall carbon conversion to gas and overall H2,CO2,CO and CH4yields were compared for each catalyst to evaluate the extent of the reforming and water gas shift reactions as well as to study the catalyst deactivation.If the p-value obtained is lower than the significance level used(˛=0.05),it can be concluded with95%con-fidence that at least one of the catalysts provides a value of the response variable different from the others.When the ANOVA analysis detected significant differences,the multiple range least significant difference(LSD)test with a signifi-cance level of0.05was employed to determine differences between pairs of catalysts.The results of this test are presented in the multi-ple range tables,where the catalysts are classified in homogeneous groups using as many letters as homogeneous groups obtained in the analysis.Catalysts sharing the same letter belong to the same homogenous group.The theoretical equilibrium values were calculated using Aspen-tech HYSYS3.2simulation software employing a Gibbs reactor module with the PRSV thermodynamic package.This Gibbs reactor utility provides the theoretical equilibrium composition minimiz-ing the Gibbs free energy of the system,which allows calculating the thermodynamic equilibrium without introducing the reaction stoichiometry.Acetic acid,acetol and butanol were input in the Gibbs module to model the composition of the aqueous fraction.3.3.Results in thefixed bed reactorCo and Cu were incorporated in the catalyst as modifiers of the active phase with the main purpose of decreasing the catalyst deactivation by coking.The overall2h results obtained in the steam reforming exper-iments infixed bed using the Ni/AlMg,NiCo/AlMg,NiCu/AlMg, Imprg.Co and Imprg.Cu catalysts as well as the corresponding ther-modynamic equilibrium values under the operating conditions are summarized in Table4.The statistical analysis of the results by means of an ANOVA analysis is presented in Table5,where the p-values and the LSD homogeneous groups of catalysts for each response variable are given.The overall carbon conversion to gases and the overall H2and CO2yields as well as their evolution over time give an idea of the performance of the different catalysts in terms of overall activ-ity,initial activity and deactivation with time(Fig.5).H2and CO2 are the principal products of the reforming reaction.The ANOVA analysis of the results,shown in Table5,shows that at least one of the tested catalysts provided different results in terms of different carbon conversion to gases and H2and CO2yields(p-values lower than the significance level˛=0.05).The multiple range LSD test shows the existence of three different homoge-neous groups.The best performance during the reforming of the aqueous fraction in terms of higher overall carbon conversion to gases(80.0±4.5%)and H2(0.138±0.006g H2/g organics)and CO2 (1.014±0.066g CO2/g organics)yields,which implies the highest catalyst stability,was achieved with the coprecipitated NiCo/AlMg catalyst.Analysing the multiple range LSD test results represented in Table5,it can be seen that both the catalyst preparation method (coprecipitation or impregnation)and the type of modifier(Co and Cu)might have a significant influence on the catalyst per-formance.All the coprecipitated catalysts provided statistically higher carbon conversion to gases and H2and CO2yields than the。
D o w n l o a d e d f r o m a s c e l i b r a r y .o r g b y N o r t h w e s t A &F U n i v e r s i t y o n 02/27/13. C o p y r i g h t A S CE .F o r p e r s o n a l u s e o n l y ; a l l r i g h t s r e s e r v e d .FIG. 1.Structure and Components of Experimental Setup for Evaluation of Water Distribution of Individual Spray SprinklersExperimental Setup for Individual Spray Sprinkler EvaluationAn experimental test stand to evaluate the water distribution of a single spray sprinkler was set up at the Agricultural Re-search Service of the Diputacio ´n General de Arago ´n in(Zaragoza).It consisted of a support structure and ˜Montanana a hydraulic system.The support structure was an inverted U-shape frame designed to support a spray sprinkler at different heights.The hydraulic installation supplied pressurized water to the spray sprinklers.Fig.1presents a diagram of the ex-perimental setup.The structure,built with three metal 50-mm-diameter cylin-drical bars,was 3.2m high and 4.0m wide.The frame corners were anchored to the soil with four steel wires.Two additional horizontal wires were installed within the frame to avoid spray sprinkler vibrations and to fix the spray sprinkler at a 1.0-or 2.5-m height above the soil surface.The water source was a reservoir with a capacity of 30m 3.A 1.94-kW electric cen-trifugal pump was connected to a 2.54-mm (1-in.)external-diameter polyethylene pipe supplying water to the spray sprin-kler.Sand and mesh filters were used to avoid nozzle clogging.Discharge was measured using a volumetric water meter with an accuracy of 1L.Evaluations were performed at a constant pressure of 140kPa,obtained with a pressure regulator in-stalled immediately upstream from the spray sprinkler.Ma-nometers and valves were installed as required to control water supply during the evaluations (Fig.1).Catch cans were used to collect the applied water.They were constructed in transparent plastic,with an inverted con-ical shape.The catch can opening was 80mm for the inside diameter and the can height was 200mm.The can capacity was 40L m Ϫ2,with 1L m Ϫ2divisions.The top part of the catch cans was placed at 200mm over the soil surface.The spray sprinkler and the catch cans were installed in a plot with bare soil.Evaluation of Spray SprinklersThirty-five evaluations were performed in the fall of 1998.In these evaluations,the water distribution resulting from ir-rigation with individual spray sprinklers was measured for dif-ferent combinations of the following factors:•Type of spray sprinkler:RSPS or FSPS•Height of the spray sprinkler above soil surface:1.0or 2.5m•Nozzle diameter:3.8,6.7,or 7.9mm•Range of wind speed:low (<2.5m s Ϫ1),medium (between 2.5and 5.0m s Ϫ1),or high (>5.0m s Ϫ1)The duration of each evaluation varied between 40and 120min,depending on the type of spray sprinkler and the nozzle diameter.Catch cans were measured immediately after the ir-rigation.The total measurement time did not exceed 15min.Wind speed and direction,air relative humidity,and air tem-perature were measured during the evaluations,using an au-tomatic weather station located at the same experimental farm.Design of Catch Can SetupIn preliminary tests it was observed that the water distri-bution patterns of RSPSs and FSPSs were completely differ-ent.The RSPSs presented a conical water distribution pattern very similar to the distribution pattern created by impact sprin-klers,with the maximum depth applied at the sprinkler loca-tion and decreasing linearly with distance to the water source.However,the FSPSs concentrated most of the applied water in a circular crown of about 1m in width.The distance from the water source to the crown depended on the experimental conditions.Water application within the crown was not uni-form;one could appreciate alternate radii with very different depths of water applied,corresponding to the grooves of the deflector plates.The volume of water applied outside the crown was negligible.According to the different patterns of water application characteristic of the two types of spray sprinklers,different methodologies were used in the setup of the catch can network and in the analysis of the experimental data.In both cases,catch can data are considered representative of a portion of the field.This hypothesis may lead to experimental errors,par-ticularly in the borders of the irrigated area and in the vicinity of abrupt changes in precipitation.RSPSsThe RSPS evaluation was based on a square network of 169catch cans at 2.0ϫ2.0m spacing,with the spray sprinkler located at the center [Fig.2(a)].The catch can lines were ori-ented in the N-S and E-W directions.It was found that the catch can located in the center of the net,just below the spray sprinkler,collected all the drops formed by the impact of the water jets with the three arms supporting the deflector plate.Therefore,this can reflected an unrealistically high water ap-plication.To avoid this problem,water application below the spray sprinkler was characterized by the average value of four catch cans located at 0.75m from the spray sprinkler in the NE,NW,SE,and SW directions.Additional experiments re-vealed that this average value was an adequate estimation of water application at the central 2.0ϫ2.0m tile of the catch can network.D o w n l o a d e d f r o m a s c e l i b r a r y .o r g b y N o r t h w e s t A &F U n i v e r s i t y o n 02/27/13. C o p y r i g h t A S CE .F o r p e r s o n a l u s e o n l y ; a l l r i g h t s r e s e r v e d .FIG. 2.Catch Can Network Used for Evaluation of:(a)RSPSs;(b)FSPSs [Catch Cans Are Denoted by Fine Dots and Spray Sprinkler Is Represented by Thick Dot;Gray Areas Represent Wetted Area;Darker Gray in (b)Represents Area of Intense Water Application]The observed wind drift and evaporation losses (OWDEL)were determined for each evaluation as the percentage of the discharged volume that was not collected in the catch can net-work,assigning an area of 4m 2to each catch can.The possible evaporation losses from the catch cans during the irrigation evaluation and data collection were not considered in this pro-cedure.The OWDEL was computed using the following equa-tions:Vd ϪVc OWDEL =100(1)ͩͪVdwhere Vd =volume of water discharged (m 3)as obtained from the water meter;and Vc =volume of water collected in the catch cans (m 3),determined fromi =1694Vc =D ϫ(2)i 1,000i =1where D i =water application at catch can i (L m Ϫ2).FSPSsThe location of the catch cans in the evaluation of the FSPS was adapted to the special characteristics of the water distri-bution pattern.The square network used for the RSPS proved very inadequate to characterize the water application pattern of the FSPS,because the crown width was smaller than the network spacing.A finer square network would require a very large number of catch cans,rendering the experiment unman-ageable.To overcome these problems,two lines of 41catch cans each,with a 0.5-m spacing were installed in the N-S and E-W directions,with the spray sprinkler located at the crossing of the two lines [Fig.2(b)].With this setup,an area of 20.0ϫ20.0m was monitored by the catch cans.The variation of water application along the radii was addressed by the 0.5-m catch can spacing.However,to address the variability between the radii,additional catch cans were required.Therefore,eight lines of 6–12catch cans were added at both sides of each catch can line at a distance of 0.3m,covering the crown area [Fig.2(b)].The number of extra catch cans and their locations depended on the nozzle diameter,wind speed,and spray sprinkler height.At each catch can line,where three catch cans were used to measure water application at the same radial distance (at the crown area),the average of these three values was used.Therefore,each ex-periment was characterized by 81catch can values.Interpolation was used to estimate water application in a square net of 41ϫ41points at 0.5ϫ0.5m distance,with the FSPS located at the center.The interpolation procedure used at each unknown network point followed four steps.First,the distance from the unknown point to the spray sprinklerwas computed.Second,the two field observations located in the axes of the quadrant of the unknown point,at a radius similar to the distance computed in the first step were identi-fied.These two catch can readings are the basis for the inter-polation.Third,the angles formed by the radius through the unknown point and the axes were computed.Fourth,an in-verse angle square interpolation was performed to estimate wa-ter application at the unknown point.The OWDEL in the FSPS was computed using (1).How-ever,relevant differences appear in the estimation of the vol-ume of water collected by the catch cans Vc .This volume was calculated by adding the volumes of water collected in all the 0.5-m-wide circular crowns in the area covered by the spray sprinkler.The following equation was used to calculate Vc :i =21D D ϩD ϩD ϩD 11Ni Si Ei Wi 2Vc =0.25ϩϫͫͩͪ1,00041,000i =222и((0.5i Ϫ0.25))Ϫ((0.5(i Ϫ1)Ϫ0.25))ͬ(3)where i =ordinal of catch cans from the spray sprinkler in the four directions;and D Ni ,D Si ,D Ei ,and D Wi =water application at the i th catch cans in the N,S,E,and W directions,respec-tively (L m Ϫ2).The experimental procedures could result in small errors in the determination of the water application during the evalua-tion and therefore in the determination of OWDELs.This is particularly important in the case of the FSPS because of the uneven water application resulting from individual spray sprin-klers.Drop Size DistributionThe drop size distributions resulting from the FSPSs and RSPSs were determined using the empirical model proposed by Li et al.(1994).This model calculates the percentage of drops smaller than a given diameter.The equation used for this purpose isn P =(1Ϫexp[Ϫ0,693(d /d )])100(4)v 50where P v =percentage of total discharge in drops <d ;d =drop diameter (mm);d 50=average drop diameter (mm);and n =empirical exponent.Additional equations are required to obtain d 50and n from empirical parametersd =a ϩb R (5)50d d n =a ϩb R(6)n n where a d ,b d ,a n ,and b n =empirical coefficients;and R =ratio of nozzle size to pressure head (mm kPa Ϫ1).Kincaid et al.(1996)presented an experimental study based on drop size measurement using a laser-optical method in which values for the empirical coefficients used in (5)and (6)are supplied for a number of spray sprinklers.The RSPS used in this work was characterized by Kincaid et al.(1996),whereas the FSPS used in this work was not.To characterize the FSPS drop distribution,the empirical coefficients derived for the similar Nelson Spray I (with 30grooves)were used.Fig.3presents the drop size distribution of the evaluated RSPS and FSPS.The x -axis represents the drop diameter,and the y -axis represents the corresponding P v .Drop size distri-butions are very different for the two types of spray sprinklers.Drops emitted by the FSPS are,on the average,smaller than those emitted by the RSPS.The steep slope of the drop dis-tribution curves of the FSPS indicate that the range of drop diameter variation is much smaller for FSPSs than for RSPSs.Drop distribution for the three nozzle diameters of the FSPSD o w n l o a d e d f r o m a s c e l i b r a r y .o r g b y N o r t h w e s t A &F U n i v e r s i t y o n 02/27/13. C o p y r i g h t A S CE .F o r p e r s o n a l u s e o n l y ; a l l r i g h t s r e s e r v e d .FIG. 3.Drop Size Distributions Resulting from 3.8,6.7,and 7.9-mm Nozzle Diameters of RSPSs and FSPSs;Distributions Were Computed Using Model by Li et al.(1994)and Empirical Parameters Obtained by Kincaid et al.(1996)is very similar to each other.However,the drop distributions obtained for the RSPS show a large variability between nozzle diameters.The P v corresponding to 1.5mm for the 7.9-mm-diameter nozzle is 72%for the FSPS and 46%for the RSPS,whereas for the nozzle diameter of 3.8mm,the P v correspond-ing to 1.5mm is 86%for the FSPS and 63%for the RSPS.The differences in drop size distribution among types of spray sprinklers are due to the characteristics of the drop for-mation process.In the FSPS the water jet hits a variable num-ber of grooved deflector plates.The stream reaching each groove remains approximately independent of the nozzle di-ameter.In the RSPS the water jet hits a deflector plate with six grooves.A larger nozzle diameter will result in higher flows in each groove,increasing drop diameter and therefore the wetted radius of the rotator nozzle.Estimation of Wind Drift and Evaporation Losses (EWDELs)Different empirical equations were used in this work for EWDEL (%)during the evaluations.These estimates were compared with the experimental OWDEL.The models used for comparison were Keller and Bliesner (1990),Trimmer (1987),and Montero et al.(1997).The first two approaches are based on the pioneer work by Frost and Schwalen (1955).Keller and Bliesner (1990)developed an equation in which the EWDEL is expressed as a function of potential evapotran-spiration and wind speed and an index of drop diameter.The following equations are used in this model:2EWDEL =[1Ϫ0.976Ϫ0.005PET ϩ0.00017PET Ϫ0.0012U ϩCI (0.00043PET ϩ0.00018U ϩ0.000016PET U )]100(7)where PET =potential evapotranspiration (mm day Ϫ1);U =wind velocity (km h Ϫ1);and CI =coarseness index,obtained from1.30.032p CI =(8)Dwhere p =nozzle working pressure (kPa);and D =nozzle diameter (mm).Eq.(8)is subjected to the following rules:if CI <7(big drops),CI is set to 7in (7);if CI >17(small drops),CI is set to 17.Trimmer (1987)developed an equation for EWDELs as a function of nozzle diameter,working pressure,wind speed,and vapor pressure deficit.The following equations are used in this model:Ϫ0.720.63Ϫ4 1.16EWDEL =[1.98D ϩ0.22(e Ϫe )ϩ3.610p s a 0.7 4.2ϩ0.4V ](9)where V =wind velocity (m s Ϫ1);and e s Ϫe a =water vapor pressure deficit (kPa)obtained fromRH e Ϫe =0.61exp[17.27T /(237.3ϩT )]1Ϫ(10)s a ͩͪ100where T =air temperature (ЊC);and RH =air relative humidity (%).Montero et al.(1997)developed an empirical equation from experimental data obtained under field conditions in solid set irrigation systems based only on climatic parameters.The fol-lowing equation is used in this model:EWDEL =1.059(e Ϫe )ϩ1.438V(11)s a Overlapping of Spray SprinklersThe individual water distributions obtained for the RSPS and FSPS evaluations were mathematically overlapped to sim-ulate the water application pattern produced by a section of a center-pivot or a linear-move sprinkler machine.At the end of the irrigation evaluation process,the individ-ual water distribution of each RSPS was represented by a square 21ϫ21matrix with observations spaced at 2ϫ2m.However,the individual water distribution of the FSPS was represented by a 41ϫ41matrix with a data spacing of 0.5ϫ0.5m.To have comparable data sets for both types of spray sprinklers,the RSPS 21ϫ21matrix of water distribution was converted to a 41ϫ41matrix using an interpolation process based on the inverse distance square.The last step in data processing was to standardize the wind direction.In each eval-uation,the resultant wind direction was determined and the data set was rotated to represent three wind directions:N,NE,and E.Unless otherwise stated,the wind data set will be used.The result of this interpolation process is a new 41ϫ41ma-trix with axes in the N-S and E-W directions.It was assumed that the irrigation lateral was oriented in the E-W direction.Therefore,the water application resulting from each individual spray sprinkler is represented by a row vector whose elements are computed as the sum of the elements of the water application matrix in the same column.The next step is to overlap the vectors resulting from neighboring spray sprinklers (Fig.4).The goal was to obtain a 20.5-m section of fully overlapped water application in the irrigation lateral.This section is characterized by a 41element vector whose elements (denoted z i )are calculated by addition of the water applied by each of the spray sprinklers.Four spray sprinkler spacings were considered:2.5,3.0,3.5,and 5.5m.A relevant limitation of the overlapping procedure is that the spacing must be a multiple of the data spacing in the water application matrix (0.5m).Fig.4presents the procedure used to overlap the water application between spray sprinklers.The required number of spray sprinklers varied with the spacing,ranging between 7(for a spacing of 5.5m)and 17(for a spacing of 2.5m).The coefficient of uniformity CU (%),developed by Chris-tiansen (1942)was calculated in the fully overlapped section of the lateral using the following equation:D o w n l o a d e d f r o m a s c e l i b r a r y .o r g b y N o r t h w e s t A &F U n i v e r s i t y o n 02/27/13. C o p y r i g h t A S CE .F o r p e r s o n a l u s e o n l y ; a l l r i g h t s r e s e r v e d .FIG. 4.Scheme of Mathematical Procedure Used for Simulation of Overlapping of Spray Sprinklers at Different Spacings41͉z Ϫm ͉i i =1CU =1Ϫ100(12)ͩͪ41mwhere m =average value of water application z i .This CU reproduces the uniformity of the irrigation lateral traveling over a parallel line of 41catch cans at a 0.5-m spacing (Fig.4).Note that this expression of the coefficient of uniformity is not adequate for the characterization of a complete pivot lateral (Keller and Bliesner 1990).Statistical SignificanceThe levels for statistical significance adopted in this work were:***for P <0.001;**for 0.001<P <0.01;*for 0.01<P <0.05;and not significant for 0.05<P .RESULTS AND DISCUSSIONWater Distribution Pattern of Individual spray sprinklersAs an illustrative example of the individual water distribu-tion pattern of the RSPS and FSPS,Fig.5presents the results of the evaluations for the 3.8-mm nozzle,at 1.0and 2.5m above the soil surface under low and medium wind velocity.This figure represents,in a grey color intensity scale,the water application (mm h Ϫ1)collected at each point of the soil surface during the evaluation of the spray sprinklers.The x -and y -axes represent the coordinates of the soil surface (m).The point with coordinates (0,0)corresponds to the nozzle loca-tion.In all figures,wind direction has been adjusted to rep-resent an N direction (from the positive extreme of the y -axis).It can be observed that the individual water distribution pat-terns of the RSPS and FSPS are very different.In the RSPSprecipitation is maximum at the center and decreases gradually as one moves away from the center.In the FSPS precipitation is maximum at a circular crown of variable width located around 6m from the spray sprinkler.This distance was quite invariable with respect to nozzle diameter.In the rest of the wetted area,precipitation is almost negligible.The different behavior of the RSPS and the FSPS can be explained by the different drop size distribution of both types of sprinklers (Fig.3).The ample grading in drop diameter characteristic of the RSPS results in drops landing at variable distances along each radius.However,most drops emitted by an FSPS have diam-eters ranging between 1and 2mm.These drops of uniform diameter land in a narrow range of distances along the radius,resulting in the experimentally observed circular crown of pre-cipitation.Influence of Sprinkler Height on Wetted Diameter of Individual SprinklersSprinkler height has a considerable effect on water distri-bution [Figs.5(a–d)].An increase in sprinkler height produces a smoothing and a spread of the water distribution.The wetted area of both sprinklers is larger for the 2.5-m height than for the 1.0-m height.Drops are emitted by both types of spray sprinklers at an angle close to the horizontal.Therefore,as the sprinkler height increases,drops travel a longer distance.At the same time,the opportune time for the wind to evaporate and drift the drops increases as the drop trajectory gets longer.Because the same amount of water is distributed in a small area when the sprinkler is located at a low height,the maxi-mum precipitation is higher at 1.0m than at 2.5m.This can result in runoff problems in soils with low infiltration rates.Fig.6presents the relationship between the wetted diame-ters of the RSPS and FSPS at 1.0-and 2.5-m height.For each nozzle,the wetted diameter is higher at 2.5-m height than at 1.0-m height.The wetted diameters of the 6.7and 7.9-mm-D o w n l o a d e d f r o m a s c e l i b r a r y .o r g b y N o r t h w e s t A &F U n i v e r s i t y o n 02/27/13. C o p y r i g h t A S CE .F o r p e r s o n a l u s e o n l y ; a l l r i g h t s r e s e r v e d .FIG. 5.Water Application (mm h Ϫ1)Resulting from Individual Spray Sprinklers under Varying Spray Sprinkler Heights and Wind Speeds [Nozzle Diameter is 3.8mm;Axes Coordinates Are in Meters;Coordinates of Spray Sprinklers Are (0,0)]diameter nozzles were considerably higher for the RSPS than for the FSPS at both 1.0-and 2.5-m height.However,the wetted diameters of the RSPS were slightly lower than the FSPS diameters for the 3.8-mm nozzle diameter at both heights.For large nozzle diameters,the relative advantage of the RSPS (large wetted diameter)is more relevant when the spray sprinkler height is low.Influence of Wind on Water Distribution of Individual SprinklersWind speed is one of the most important environmental fac-tors affecting the quality of sprinkler irrigation (Trimmer 1987;V ories et al.1987).The influence of wind speed is related to the type of spray sprinkler,nozzle diameter,working pressure,and nozzle height above the soil surface (Tarjuelo et al.1999).Wind produced a displacement of the water distribution ofthe RSPS [Figs.5(c and e)].This displacement was propor-tional to the wind speed and increased with nozzle height.However,the shape of the water distribution did not change drastically.In the FSPS,wind produced a displacement of the water distribution and a change in the shape of the crown was also apparent [Figs.5(d and f)].Under medium and high wind conditions,water application by the FSPS often resulted in smoothing by the random drift produced by wind blows.Un-der these conditions the irrigation uniformity could even be improved in the presence of wind.Overlapped Water Distribution of RSPS and FSPS The spacing of the spray sprinklers is a key decision in the design of center-pivot and linear-move sprinkler ually the desired precipitation rates along the lateral are ob-tained by choosing adequate nozzle diameters and spacings.D o w n l o a d e d f r o m a s c e l i b r a r y .o r g b y N o r t h w e s t A &F U n i v e r s i t y o n 02/27/13. C o p y r i g h t A S CE .F o r p e r s o n a l u s e o n l y ; a l l r i g h t s r e s e r v e d .FIG. parison of Wetted Diameters Obtained for RSPS and FSPS under Different Conditions of Nozzle Height and Nozzle Diameter (Each Dot Is Average of Experiments in Three Wind Conditions;Dot Size Is Proportional to NozzleDiameter)FIG.7.Two-Dimensional Representation of Water Distribution of Lat-eral with 7.9-mm-Diameter RSPSs (a and c)and FSPSs (b and d)Nozzles Installed at 1.0m (a and b)and 2.5m of Height (c and d)under Low Wind Speed (Overlapping Distance of Nozzles in All Cases Is 2.5m;Irrigation Lateral Is Denoted by Dotted Lines;Axes Coordinates Are inMeters)FIG.8.Simulated Cross-Sectional Water Distribution (mm h Ϫ1)of Ir-rigation Lateral with 3-m Spacing under Low Wind Speeds and Nozzle Height of 1.0m for RSPS and FSPS and for Three Nozzle DiametersFor the nozzle diameters considered in this study,the com-mercial spacings vary between 2.5and 5.5m.Fig.7presents the water distribution of a lateral equipped with an RSPS and FSPS with a 7.9-mm nozzle diameter and a spacing of 2.5m,under low wind conditions at 1.0-and 2.5-m height.The overlapped water distribution patterns of both types of spray sprinklers were very different.The maximum water application in the RSPS is obtained just below the irri-gation lateral.In the overlapped distribution resulting from the FSPS,two rows of maximum precipitation are formed in the outer parts of the wetted area.These two rows are formed by superposition of the circular crowns of maximum precipitation observed in individual FSPSs.For both types of spray sprin-klers,the wetted width of the lateral increases when the nozzleheight is increased from 1.0to 2.5m.Increasing the nozzle height also resulted in a smoothing of the water application.For both nozzle heights,the wetted width is larger in the RSPS than in the FSPS (about 3–4m in this particular case).Fig.8presents the simulated cross-sectional average water distribution of a lateral fitted with both types of spray sprin-klers,3-m spacing,three studied nozzle diameters,nozzle height of 1.0m,and low wind speed.The differences in the shape of the overlapped water distribution are evident.The RSPS is characterized by a bell shape,whereas the FSPS pre-sents two peaks of maximum water application,which are clearly visible for the 6.7-and 7.9-mm nozzle diameters.When a lateral fitted with FSPSs is in motion,the precipi-tation rate at a given point of the field suddenly increases at the beginning of the irrigation.After reaching a peak,the pre-cipitation rate decreases to form a plateau until a second pre-cipitation peak arrives just before the end of the irrigation.This profile of water application can produce runoff in soils with low infiltration rates,because the second peak of high precipitation occurs when the soil is already wet and the in-filtration rate is far from maximum.Considering all simulated spacings,the peak of maximum precipitation is higher in the FSPS than in the RSPS for the same nozzle diameter.There-fore,it can be presumed that,in soils with low infiltration rates,a sprinkler machine fitted with RSPSs would produce less runoff than if it was fitted with FSPSs.Effect of Wind Speed and Direction on Water Distribution of Overlapped Spray SprinklersFig.9illustrates the effect of wind speed on water distri-bution.In this particular case,the figure presents the simulated cross-sectional average water distribution of a lateral fitted with both types of spray sprinklers with 3.8-mm nozzle di-ameter and 2.5-m spacing,and under low,medium,and high wind speeds of N direction.When the wind direction is per-pendicular to the sprinkler lateral (N wind),wind produces a displacement of the water application in both types of sprin-klers that is proportional to its speed.In the RSPS,high wind resulted in a general displacement of around 9m.The dis-placement in FSPS was lower than in RSPS (about 3–4m).This trend was confirmed for the other two nozzle diameters.It can also be observed that wind speed decreases the peak of maximum precipitation and changes the water application pat-tern.In the RSPS,as wind speed increases,the slope of the upwind side of the water distribution pattern decreases.In the FSPS,high wind produces a decrease of the upwind precipi-tation peak.D o w n l o a d e d f r o m a s c e l i b r a r y .o r g b y N o r t h w e s t A &F U n i v e r s i t y o n 02/27/13. C o p y r i g h t A S CE .F o r p e r s o n a l u s e o n l y ; a l l r i g h t s r e s e r v e d .FIG.9.Simulated Cross-Sectional Water Distribution (mm h Ϫ1)of Ir-rigation Lateral with 2.5-m Spacing,Nozzle Diameter of 3.8mm,and Nozzle Height of 2.5m,for RSPS and FSPS,under Low,Medium,and High WindSpeedsFIG.10.Simulated Cross-Sectional Water Distribution (mm h Ϫ1)of Irrigation Lateral with 3.5-m Spacing,Nozzle Diameter of 6.7mm,Noz-zle Height of 1.0m,and High Wind Speed,for RSPS and FSPS and Wind Directions N,NE,and ETABLE 1.Average Coefficients of Uniformity (%)for FSPS and RSPS under Different Spacings,Nozzle Diameters,Spray Sprinkler Heights,and Wind Speed and DirectionParameterOVERLAPPING DISTANCE 3.0mRSPS FSPS 5.5mRSPS FSPS a Nozzle diameter (mm)3.898.696.895.190.56.799.194.698.087.87.999.294.698.283.2Spray sprinkler height (m)1.098.793.396.383.82.599.297.597.990.5Wind speed (m s Ϫ1)Low 98.993.297.387.0Medium 99.196.597.085.5High98.896.397.088.9Wind direction N 99.095.897.289.7NE 99.094.996.585.1E98.995.297.586.2a5.5-m spacing is not commercially used in FSPS.Fig.10presents the simulated cross-sectional average water distribution of a sprinkler lateral fitted with RSPSs and FSPSs,6.7-mm nozzle diameter,nozzle height of 1.0m,and 3.5-m spacing,and under a high wind speed of N,NE,and E direc-tions.The N wind direction (perpendicular to the irrigation lateral)results in a higher displacement of the water distribu-tion than in the other two cases.When the wind direction is from the E (parallel to the sprinkler lateral,blowing from the right side),the resulting simulated water distribution is almost symmetrical to the irrigation lateral.For the NE wind direc-tion,the displacement of the water distribution is intermediate.With the E wind direction,the water application pattern of the FSPS changes,showing the maximum application rate just be-low the lateral,in a pattern similar to the RSPS.In all cases the wetted width of the sprinkler lateral was not significantly affected by the wind direction.Uniformity of Overlapped Water DistributionThe uniformity of water application for a lateral with 3.0-and 5.5-m spacing was simulated for all the individual eval-uations.Winds from the N direction (perpendicular to the lat-eral),NE direction (at a 45Њangle in relation to the lateral),and E direction (parallel to the lateral)were also simulated in each case.Table 1presents the average values of CU for thedifferent studied management variables.At a spacing of 3.0m,the average values of CU for the different nozzle diameters,sprinkler height,wind speed,and direction are very large for the RSPS (>98.6%)and relatively large for the FSPS (>93.2%).The average CU at a spacing of 5.5m remains high in all cases with the RSPS (>95.1%)but decreases when the FSPS is used (values of CU between 83.2and 90.5%).The influence on CU of each management factor was stud-ied using multiple linear regression.Table 2presents the re-gression coefficients and the significance levels obtained for the two types of spray sprinklers.Nozzle diameter,nozzle height over the soil surface,and spacing significantly affected CU in both types of spray sprinklers.Increasing the nozzle diameter results in an increased CU with the RSPS.The con-trary trend was observed with the FSPS.Increasing the nozzle height increases CU in both types of spray sprinklers.This is due to the smoothing of the water distribution as the nozzle height increases.However,wind drift and evaporation losses can increase as nozzle height increases.Wind speed and di-rection did not significantly affect CU either for the RSPS or for the FSPS.Spacing significantly affected CU in both types of sprinklers.Increasing the spacing always resulted in a re-duced CU .A higher regression coefficient was found for the FSPS (Ϫ3.3%m Ϫ1)than for the RSPS (Ϫ0.8%m Ϫ1).Results indicate that FSPSs can be successfully used when the spacing is kept below a certain value.However,the spac-ing in RSPSs can be higher than in FSPSs without compro-mising CU .Frequently,commercial pivot designs with FSPSs maintain constant a spacing along the lateral of 2.7m,varying the nozzle diameter.The same pivot designed with RSPSs would use different nozzle diameters,but it would also include different spacings (2.7and 5.5m)(Valmont Industries 2000).Wind Drift and Evaporation LossesFig.11presents the relationship between wind speed and OWDELs for all the evaluations on RSPSs and FSPSs.A sim-ple linear regression showed a larger determination coefficient for RSPSs (R 2=0.83***)than for FSPSs (R 2=0.32*).The slope of both curves is positive,indicating an increase in the OWDEL as the wind speed increases.However,the slope of the RSPS curve (OWDEL =3.61V Ϫ0.86)is more than twice the slope of the FSPS curve (OWDEL =1.51V ϩ6.95).The low value of the coefficient of determination obtained for FSPS seems to be related to the experimental difficulties as-D o w n l o a d e d f r o m a s c e l i b r a r y .o r g b y N o r t h w e s t A &F U n i v e r s i t y o n 02/27/13. C o p y r i g h t A S CE .F o r p e r s o n a l u s e o n l y ; a l l r i g h t s r e s e r v e d .。