雅思写作1
- 格式:doc
- 大小:158.00 KB
- 文档页数:6

Sample Candidate Writing Scripts and Examiner CommentsBoth the Academic and General Training Writing Modules consist of two tasks, Task 1 and Task 2. Each task is assessed independently. The assessment of Task 2 carries more weightin marking than Task 1.Detailed performance descriptors have been developed which describe written performance at the 9 IELTS bands. These descriptors are confidential and apply to both the Academic and General Training Modules.Task 1 scripts are assessed on the following criteria:•Task Achievement•Coherence and Cohesion•Lexical Resource•Grammatical Range and AccuracyTask 2 scripts are assessed on the following criteria:•Task Response•Coherence and Cohesion•Lexical Resource•Grammatical Range and AccuracyCandidates should note that scripts will be penalised if they are a) under the minimum word length, b) partly or wholly plagiarised, c) not written as full, connected text (e.g. using bullet points in any part of the response, or note form, etc.).T ask 1Task AchievementThis criterion assesses how appropriately, accurately and relevantly the response fulfils the requirements set out in the task, using the minimum of 150 words.Academic Writing Task 1 is a writing task which has a defined input and a largely predictable output. It is basically an information-transfer task which relates narrowly to the factual content of an input diagram and not to speculated explanations that lie outside the given data.General Training Writing Task 1 is also a writing task with a largely predictable output in that each task sets out the context and purpose of the letter and the functions the candidate should cover in order to achieve this purpose.Coherence and CohesionThis criterion is concerned with the overall clarity and fluency of the message: how the response organises and links information, ideas and language. Coherence refers to the linking of ideas through logical sequencing. Cohesion refers to the varied and appropriate use of cohesive devices (for example, logical connectors, pronouns and conjunctions) to assist in making the conceptual and referential relationships between and within sentences clear. Lexical ResourceThis criterion refers to the range of vocabulary the candidate hasused and the accuracy and appropriacy of that use in terms ofthe specific task.Grammatical Range and AccuracyThis criterion refers to the range and accurate use of thecandidate’s grammatical resource as manifested in thecandidate’s writing at sentence level.T ask 2Task ResponseIn both Academic and General Training Modules Task 2 requiresthe candidates to formulate and develop a position in relation to a given prompt in the form of a question or statement. Ideasshould be supported by evidence, and examples may be drawnfrom the candidates’ own experience. Responses must be atleast 250 words in length.Writing scripts are marked by trained and certificated IELTS examiners. Scores are reported as whole bands only.On the next 12pages you will find candidates’ answers totwo sample Writing tests. There are two answer s for each Writing task. Each answer has been awarded a band score and is accompanied by an examiner comment on the candidate’s performance for thattask.The examiners’ guidelines for marking the Writing scripts arevery detailed.There are many different ways a candidate may achieve a particular band score.The candidates’ answers that follow should not be regarded as definitive examples of any particular band score.Sample Script AExaminer commentBand 5The length of the answer is just acceptable. There is a good attempt to describe the overall trends but the content would have been greatly improved if the candidate had included some reference to the figures given on the graph. Without these, the reader is lacking some important information. The answer is quite difficult to follow and there are some punctuation errors that cause confusion. The structures are fairly simple and efforts to produce more complex sentences are not successful.Sample Script BExaminer commentBand 6The candidate has made a good attempt to describe the graphs looking at global trends and more detailed figures. There is, however, some information missing and the information is inaccurate in minor areas. The answer flows quite smoothly although connectives are overused or inappropriate, and some of the points do not link up well. The grammatical accuracy is quite good and the language used to describe the trends is well-handled. However, there are problems with expression and the appropriate choice of words and whilst there is good structural control, the complexity and variation in the sentences are limited.Sample Script AExaminer commentBand 6The answer has a good introduction in which the candidate has attempted to incorporate his/her own words. There is good coverage of the data and a brief reference to contrasting trends. The answer can be followed although it is rather repetitive and cohesive devices are overused. In order to gain a higher mark for content, the candidate would be expected to select the salient features of the graph and comment primarily on these. Sentences are long but lack complexity. There are some errors in tense, verb form and spelling which interfere slightly with the flow of the answer.Sample Script BExaminer commentBand 7The answer deals well with both the individual media trends and the overall comparison of these trends. The opening could be more fully developed with the inclusion of information relating to the groups studied and the period of time during which the study took place. There is a good variety of cohesive devices and the message can be followed quite easily although the expression is sometimes a little clumsy. Structures are complex and vocabulary is varied but there are errors in word forms, tense and voice and occasionally the text becomes incoherent.Sample Script AExaminer commentBand 5The answer is short at just over 200 words and thus loses marks for content. There are some relevant arguments but these are not very well developed and become unclear in places. The organisation of the answer is evident through the use of fairly simple connectives but there are problems for the reader in that there are many missing words and word order is often incorrect. The structures are quite ambitious but often faulty and vocabulary is kept quite simple.Academic Writing Sample Task 2A Sample Script BExaminer commentBand 6There are quite a lot of ideas and while some of these are supported better than others, there is an overall coherence to the answer. The introduction is perhaps slightly long and more time could have been devoted to answering the question. The answer is fairly easy to follow and there is good punctuation. Organisational devices are evident although some areas of the answer become unclear and would benefit from more accurate use of connectives. There are some errors in the structures but there is also evidence of the production of complex sentence forms. Grammatical errors interfere slightly with comprehension.Academic Writing Sample Task 2B Sample Script AExaminer commentBand 5Although the script contains some good arguments, these are presented using poor structures and the answer is not very coherent. The candidate has a clear point of view but not all the supporting arguments are linked together well and sometimes ideas are left unfinished. There is quite a lot of relevant vocabulary but this is not used skilfully and sentences often have words missing or lapse into different styles. The answer is spoilt by grammatical errors and poor expression.Academic Writing Sample Task 2B Sample Script BExaminer commentBand 7The answer is well-written and contains some good arguments. It does tend to repeat these arguments but the writer’s point of view remains clear throughout. The message is easy to follow and ideas are arranged well with good use of cohesive devices. There are minor problems with coherence and at times the expression is clumsy and imprecise. There is a wide range of structures that are well handled with only small problems, mainly in the areas of spelling and word choice.44|IELTS Specimen MaterialsIELTS Specimen Materials|45Sample Candidate Writing Scripts and Examiner CommentsBoth the Academic and General Training Writing Modules consist of two tasks, Task 1 and Task 2. Each task is assessed independently. The assessment of Task 2 carries more weightin marking than Task 1.Detailed performance descriptors have been developed which describe written performance at the 9 IELTS bands. These descriptors are confidential and apply to both the Academic and General Training Modules.Task 1 scripts are assessed on the following criteria:•Task Achievement•Coherence and Cohesion•Lexical Resource•Grammatical Range and AccuracyTask 2 scripts are assessed on the following criteria:•Task Response•Coherence and Cohesion•Lexical Resource•Grammatical Range and AccuracyCandidates should note that scripts will be penalised if they are a) under the minimum word length, b) partly or wholly plagiarised, c) not written as full, connected text (e.g. using bullet points in any part of the response, or note form, etc.).T ask 1Task AchievementThis criterion assesses how appropriately, accurately and relevantly the response fulfils the requirements set out in the task, using the minimum of 150 words.Academic Writing Task 1 is a writing task which has a defined input and a largely predictable output. It is basically an information-transfer task which relates narrowly to the factual content of an input diagram and not to speculated explanations that lie outside the given data.General Training Writing Task 1 is also a writing task with a largely predictable output in that each task sets out the context and purpose of the letter and the functions the candidate should cover in order to achieve this purpose.Coherence and CohesionThis criterion is concerned with the overall clarity and fluency of the message: how the response organises and links information, ideas and language. Coherence refers to the linking of ideas through logical sequencing. Cohesion refers to the varied and appropriate use of cohesive devices (for example, logical connectors, pronouns and conjunctions) to assist in making the conceptual and referential relationships between and within sentences clear. Lexical ResourceThis criterion refers to the range of vocabulary the candidate has used and the accuracy and appropriacy of that use in terms ofthe specific task.Grammatical Range and AccuracyThis criterion refers to the range and accurate use of the candidate’s grammatical resource as manifested in thecandidate’s writing at sentence level.T ask 2Task ResponseIn both Academic and General Training Modules Task 2 requiresthe candidates to formulate and develop a position in relation to a given prompt in the form of a question or statement. Ideasshould be supported by evidence, and examples may be drawnfrom the candidates’ own experience. Responses must be atleast 250 words in length.Writing scripts are marked by trained and certificated IELTS examiners. Scores are reported as whole bands only.On the next 6pages you will find candidates’ answers to one sample Writing test. There are two answer s for this Writing task. Each answer has been awarded a band score and is accompanied by an examiner comment on the candidate’s performance for that task.The examiners’ guidelines for marking the Writing scripts are very detailed.There are many different ways a candidate may achieve a particular band score.The candidates’ answers that follow should not be regarded as definitive examples of any particular band score.General Training Writing Sample Task 1Sample Script AExaminer commentBand 5The answer is below the word limit and there is some repetition of the task rubric. (Length is a common problem in General Training scripts.) Answers that are short lose marks because of inadequate content and may also lose marks because there is insufficient material in the answer for the examiner to give credit for accuracy and coherence. Despite these problems, the introduction to the letter is appropriate and the purpose of the writer is clear. The points are not always linked together well and punctuation is sometimes faulty. The sentences are kept quite simple and mistakes occur as soon as more complex structures are attempted.Sample Script BExaminer commentBand 7This answer is also short. Although ideas are often provided in the task rubric, candidates are at liberty to include some of their own ideas in their answers. In this case, the candidate has attempted to incorporate some original material. The answer reads quite fluently, is well organised and there is good use of conjunctions to link points. There are some grammatical errors but these do not affect the reader greatly and there is evidence of some more complex sentence structures.Sample Script AExaminer commentBand 5There are quite a lot of relevant ideas in the answer but they are not always well supported and sometimes they are unclear. There are some areas in the answer where the organisation becomes weak and the reader finds the message difficult to follow. Nevertheless, the writer’s view is apparent and there is a logical flow to the points given. There are a lot of mistakes in the answer and some parts, such as the conclusion, are very hard to follow because of these errors. Although there is some appropriate vocabulary, sentence control is very weak. These problems are made worse by thepoor correcting which sometimes makes words unreadable.General Training Writing Sample Task 2 Sample Script BExaminer commentBand 8This is a very well-organised script which contains a lot of well-supported arguments and analyses the topic from different angles. The ideas follow each other well and there is a very honest conclusion. The answer is easy to read. There are some areas where the expression is clumsy but this makes little difference to the overall flow of the answer. There are minor errors in spelling and structure.。
雅思写作-地图第一段:改写题目主要句式:图表名称+动词+描述主题+时间图表名称:The diagram/map/picture动词:show/illustrate/give information about/indicate描述主题:1. The development/change of 某地方。
2. How +某个地方+changed/developed. 3. The development/the change that has taken place +某个地方。
举例子:1.The maps show the development of Stokeford village over an 80 years period from 1930 to 2010.2.The diagrams illustrate some changes to a small island which has been developed for tourism.3.The two pictures compare the layout of a school as it was in the year 2004 with a proposed/planned/projected/expected site design for the year 2024.4.The diagrams show West Park Secondary School at three different stages in its development: 1950, 1980 and 2010.第二段:总结主要特征。
一般来说选取一两个最重大的变化特征。
或者从全局来看,描述最显著的变化。
同时还可以从地图功能的变化阐述其主要变化,比如说可以容纳更多学生,转变成居民区了,或者是旅游/娱乐设施完善了。
主要句式:1. It is clear that +某地方+has changed considerably with the construction of some new facilities.It is clear that the island has changed considerably with the introduction of tourism.2.数量+new features can be seen in the second diagram.Six new features can be seen in the second diagram.3. The main developments are that + 句子(描述一个或两个重大变化)The main developments are that the island is accessible and visitors have somewhere to stay.4. It is clear that the main change for+ 时间It is clear that the main change for 2024 involves the addition of a new school building.It is apparent from the pictures that the village has become increasingly populated over this time frame第三,四段细节描述(动词enlarge, widen, divide, replace, move, convert, relocate, demolish, renovate, extend , develop, modify)主要句式(下列句式中A,B 为建筑物)1. 位于be located/situated/sitedChorleywood Park and Golf Course is now located next to this original village area.A 位于B (城镇)的东方/西方/南方/北方A is/ lies/ is located/ is sited to/in the east/west/south/north part of B方位的表达和介词的搭配A be built/located to the east/north/south/west(southeast, southwest, northeast, northwest) of BA be built/located in the west/north/south/west part of BA be built/located to the left/right (hand side) of BA be built/located beside/next to/adjacent to/behind/in front of/ in the front of/ opposite to B2. 被建造be constructed/builtA motorway was built to the east of the villageA second car park will be built on the site of the original sports field3. 被改建成be turned to/converted toA large area behind the school was turned into a playgroundThe farmland has been converted to residential building.类似句式:The area+ 方位描述+be +建筑物The area behind the houses was farmland.4. 被拆除be demolished / dismantled / removedThe house had been demolished in order to make way for(腾出空间,让路)a small car park and an additional school building,5. 连接connect/linkThere is also a short road linking the pier with the reception and restaurant.类似表达Footpaths connect the huts6. 被分离be separated/divided1.The two school buildings were separated by a path running from the main entrance to the sports field.2.The original playground was divided into two.7. 保持不变No changes be made=remain unchanged1.No changes will be made to the main entrance and original car park.2. The school building remained unchanged8. 被扩大be extended/enlarged=increase in size1.The primary school opposite(opposite 做介词而非动词)the post office has been extended to include two new buildings2.The school has increased in size9. 被缩小be reduced in size/shrink(shrank, shrunk)9. 分叉split off/branch off1.Two new roads split off from the main road2. A new road to the south-west of the school braches off from the main road and extends out to the river.10. 道路两边的建筑描述1. Both new roads are accompanied by a small number of new houses on either side.2. A number of new properties were attached to the road heading south.11.道路的描述A railway line was built crossing this area from west to east.12.表现有建筑和规划建筑的改变(Proposed, current, future, existing, planned, it is expected that, at present, it is anticipated that, prospective)1.The current entrance to the gallery is on the right hand side of the building and visitors pass through a large lobby before entering the gallery itself. One of the proposed changes is to allow entrance on to the main exhibition area, where an existing entrance will be widened.2.At present, the exhibition rooms are divided into three separate areas. According to the plans, the dividing walls will be removed and one large exhibition space will be created.3. In addition, the gallery will gain an education center. This area will replace the existing lobby, which will also be enlarged to create a more functional space with large table and seating.4. To replace the current straight staircase, a new set of winding stairs will be installed in the corner of the living room.5. By 2024, it is expected that there will be 1000 pupils, and a third building will have been constructed.12. with 的用法(适用于高分学员)1.Two footpaths split off from the main road, with the eastern-facing road replacing old farmland. (先描述一个变化,用with接名词+现在分词(主动)或过去分词(被动)描述这一变化的详细内容)2. The farmland was converted to residential purpose, with a number of new houses attached to the road heading south.上课案例讲述和练习OG test3 Task1第一段:改写题目第二段:总结学校扩大了,停车场被建造和扩大了。
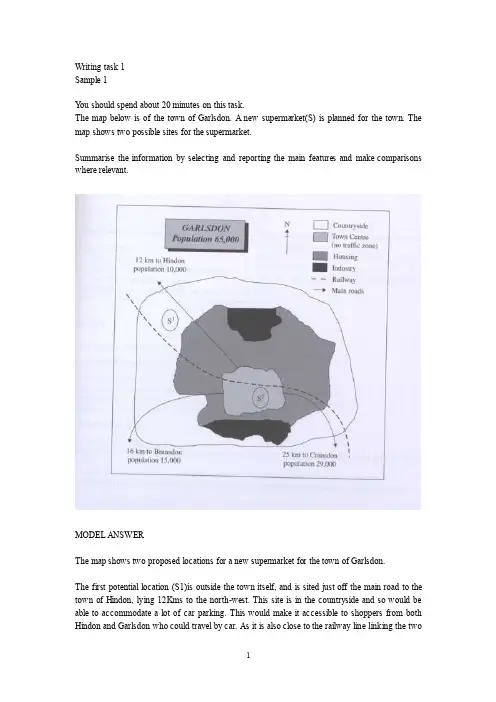
Writing task 1Sample 1Y ou should spend about 20 minutes on this task.The map below is of the town of Garlsdon. A new supermarket(S) is planned for the town. The map shows two possible sites for the supermarket.Summarise the information by selecting and reporting the main features and make comparisons where relevant.MODEL ANSWERThe map shows two proposed locations for a new supermarket for the town of Garlsdon.The first potential location (S1)is outside the town itself, and is sited just off the main road to the town of Hindon, lying 12Kms to the north-west. This site is in the countryside and so would be able to accommodate a lot of car parking. This would make it accessible to shoppers from both Hindon and Garlsdon who could travel by car. As it is also close to the railway line linking the twotowns to Cransdon(25km to the south-east), a potentially large number of shoppers would also be able to travel by train.In contrast, the suggested location, S2, is right in the town centre, which would be good of local residents. Theoretically the store could be accessed by road or rail from the surrounding towns, including Bransdon, but as the central area is a no-traffic zone, cars would be unable to park and access would be difficult.Overall, neither site is appropriate for all the towns, but for customers in Cransdon, Hindon and Garlsdon, the out-of-town site (S1) would probably offer more advantages.Sample 2The table below gives information about the underground railway systems in six cities.Summarise the information by selecting and reporting the main features, and make comparisons where relevant.Underground Railway SystemsMODEL ANSERThe table shows the details regarding the underground railway systems in six cities.London has the oldest underground railway systems among the six cities. It was opened in the year 1863, and it is already 140 years old. Paris is the second oldest, in which it was opened in the year 1900. This was then followed by the opening of the railway systems in Tokyo, Washington DC and Kyoto. Los Angeles has the newest underground railway system, and was only opened in the year 2001. In terms of the size of the railway systems, London, for certain, has the largest underground railway systems. It has 394 kilometers of route in total, which is nearly twice as large as the system in Paris. Kyoto, in contrast, has the smallest system. It only has 11 kilometers ofroute, which is more than 30 times less than that of London.Interestingly, Tokyo, which only has 155 kilometers of route, serves the greatest number of passengers per year, at 1927 millions passengers. The system in Paris has the second greatest number of passengers, at 1191 millions passengers per year. The smallest underground railway system, Kyoto, serves the smallest number of passengers per year as predicted.In conclusion, the underground railway systems in different cities vary a lot in the size of the system, the number of passengers served per year and in the age of the system.Sample 3The graph and table below give information about water use worldwide and water consumption in two different countries.Summarise the information by selecting and reporting the main features, and make comparisons where relevant.MODEL ANSWERThis model has been prepared by an examiner as an example of a very good answer. However, please note that this is just one example out of many possible approaches.The graph shows how the amount of water used worldwide changed between 1900 and 2000.Throughout the century, the largest quantity of water was used for agricultural purposes, and this increased dramatically from about 500 km3 to around 3,000 km3 in the year 2000. Water used in the industrial and domestic sectors also increased, but consumption was minimal until mid-century. From 1950 onwards, industrial uses grew steadily to just over 1,000 km3, while domestic use rose more slowly to only 300 km3oth far below the levels of consumption by agriculture.The table illustrates the differences in agricultural consumption in some areas of the world by contrasting the amount of irrigated land in Brazil (26,500 km3 ) with that in the D.R.C. (100 km3). This means that a huge amount of water is used in agriculture in Brazil, and this is reflected on the figures for water consumption per person: 359 m3 compared with only 8 m3 in the Congo. With a population of 176 million, the figures for Brazil indicate how high agricultural water consumption can be in some countries.Sample 4The table below gives information about changes in modes of travel in England between 1985 and 2000.Summarise the information by selecting and reporting the main features and make comparisons where relevant.A verage distance in miles traveled per person per year, by mode of travelSAMPLE ANSERThis is an answer written by a candidate who achieved a Band 6score. Here is the examiner’scomment:This answer does not introduce the information in the table, nor does it report it accurately. The figures are misinterpreted as representing the number of people rather than the average number of miles traveled per person per year. Consequently the information about the increase in total travel is simply not mentioned, so not all key information is covered. There is an attempt to summarise trends in the figures, but the reader cannot get a clear overall picture of the information because of the fundamental confusionNevertheless, the information is organized and the writing flows quite well because of good use of referencing and other connectors, but there are occasional errors in these and the links between ideas are slightly confusing at times.The strong feature in this answer is the range of vocabulary which is used with some flexibility and good control. A good range of structures is also used, but there are still some fairly basic mistakes, such as in the choice of tense, subject/verb agreement and inappropriate use of the passive.In 2000 the most preferred mode of travel is by car with 4,860 people. There’s a noticeable decrease in public transportation locally where it dropped from 429 people in 1985 to 274 people in 2000. However the long distance bus rides is much more preferred by people as its figures are more than doubled in the last 15 years. People who chose to walk or cycle are decreased slightly in 2000, which probable made people take the train more often. There is a significant increase in the numbers of people who traveled by train. It jumped from 289 in 1985 to 366 in 2000. This makes the train second popular mode of transportation. The biggest leap in the chart is the increase of taxi users who are tripled in 2000 with 42 people where it was only 13 in 1985.Apart from all this modes of travel, there are some more different types of travel as well of course. Number of people choosing different modes of travel is rapidly increased from 450 to 585 in 2000.Sample 5The diagrams below show the life cycle of the silkworm and the stages in the production of silk cloth.Summarise the information by selecting and reporting the main features, and make comparisons where relevant.MODEL ANSWERThis model has been prepared by an examiner as an example of a very good answer. However, please note that this is just one example out of many possible approaches.The first diagram shows that there are four main stages in the life of the silkworm. First of all, eggs are produced by the moth and it takes ten days for each egg to become a silkworm larva that feeds on mulberry leaves. This stage lasts for up to six weeks until the larva produces a cocoon of silk thread around itself. After a period of about three weeks, the adult moths eventually emerge from these cocoons and the life cycle begins again.The cocoons are the raw material used for the production of silk cloth. Once selected, they are boiled in water and the threads can be separated in the unwinding stage. Each thread is between 300 and 900 metres long, which means they can be twisted together, dyed and then used toproduce cloth in the weaving stage.Overall, the diagrams show that the cocoon stage of the silkworm can be used to produce silk cloth through a very simple process.Sample 6The charts below give information about USA marriage and divorce rates between 1970 and 2000, and the marital status of adult Americans in two of the years.Summarise the information by selecting and reporting the main features and make comparisons where relevant.SAMPLE ANSWERThis is an answer written by a candidate who achieved a Band 6.5 score. Here is the examiner’s comment:The task Achievement is the weak point in this answer. Some of the data is summarized but the points are not well-selected to convey the key trends shown in the charts. The main features of the first chart are not adequately presented and the overall conclusion does not summarise the main information. No figures are given to illustrate the points made.The information is well-organised, however, with clear paragraphing and well-signaled sections. The accurate use of a range of sequencers and other linkers makes it easy to follow the writing. There are examples of errors but they are not frequent and do not cause confusion.A range of vocabulary is used with flexibility, in spite of some inappropriate collocations and awkward phrasing. Structures are varied and generally accurate, while any mistakes do not make the message unclear.We are given two charts which show us a few sets of data about the marital status of the Americans between 1970 and 2000.The first chart compares the number of marriages and divorces in the United States of America between 1970 and 2000. We can see that data is given for each decade; the number of people who are getting married decreased slightly since 1980, as well as the divorces one. Nevertheless, divorces increased between 1970 and 1980.The second chart is more precise about the different marital status of the Americans between 1970 and 2000. The number of divorced people has risen more than the double during this two years, and the data for the never married people has also increased significantly. However, less and less people are married, as the first chart showed us; the widowed American number is also decreasing.As a conclusion, we can say that the marital status background of the Americans has maybe known the greatest change it had ever seen.Sample 7The graph below shows the demand for electricity in England during typical days in winter and summer. The pie chart shows how electricity is used in an average English home.Summarise the information by selecting and reporting the main features, and make comparisons where relevant.SAMPLE ANSWERThis is an answer written by a candidate who achieved a Band 6score. Here is the examiner’s comment:This answer focuses too closely on the details in the graph but fails to compare trends or general differences between figures of winter and summer. Some comparisons are made, but these are about details, and it is difficult to get a clear idea of the information from this description.Similarly, information in the pie chart is simply listed using the language from the chart and there is no attempt to relate this to information in the graph.The description is not well organized, although a range of linkers are used, and the use of paragraphs does not reflect the different sections of information covered.There is a suitable range of vocabulary for this task, although some words are misused and there are several spelling errors. The range and control of grammatical structures is the strong point ofthe main part of this response. There are examples of complex structures that are used with accuracy and some flexibility.The use of electricity in England is indispensed with demand for electricity in England during typical days in wither and summer is illustrated in the graph. The use of electricity in an average English home is shown in the pie chart. From the graph, it is generally obvious that the demand is in its maximum around 2100 in winter times, and in its minimum around 400, being almost constant between 1200 and 2100 in winter times. During summer times, on the other hand, the demand reaches its top point around 1300, and the bottom point around 900, being almost constant between 1550 and 2000.In wither times, the curve gradually increases to reach 40,000 units of electricity by 3 o’clock in the morning. This is followed by gradual decline to its lowest limit of 30,000 units at 9 o’clock. A gradual rise is obvious again to reach a stationary level between 3 o'clock and 9 o’clock of about 40,000 units again. Then, there is a sharp rise in the next hour to reach its maximum before collapsing again to a a lower level by the end of the day.In summer time, the curve gradually decrease to reach its lower limit around 9 o’clock of a bit more that 10,000 units. A gradual increase is noticed to reach its top of 20,000 after which a stationary phase is obvious between 3 o’clock and 10 o’clock at night of about 15,000 units.The pie chart, on the other hand, shows that 52.5% of the electricity is used for heating rooms and water. 17.5% is consumed for ovens, kettles and washing machines, 15% is used in lighting, TV and radio, and finally 15% is consumed in the sue of vacuum cleaners, food mixtures and electric tools.。
雅思13test1writing task 1范文摘要:1.概述图表内容2.分析图表特点和亮点3.对比各项数据变化4.总结图表传达的信息正文:相信很多准备雅思考试的同学都对写作任务1中的图表作文有一定了解。
今天我们就以雅思13test1的写作任务1范文为例,详细分析一下如何应对这类题目。
首先,我们来概述一下图表内容。
图表通常会展示一段时间内某一事物的变化趋势,例如本题中的图表描绘了某城市居民每天花费在户外活动、看电视和上网的时间。
通过对图表的观察,我们可以发现三个时间段(早上、中午、晚上)的数据变化。
其次,分析图表的特点和亮点。
本题的图表采用柱状图形式,清晰地展示了各个时间段内居民活动类型的变化。
从图表中我们可以直观地看到,户外活动在早上和中午时段逐渐增加,而看电视和上网的时间则在减少。
这种变化趋势有助于我们更好地理解居民生活习惯的转变。
接下来,我们对比各项数据变化。
从图表中可以看出,户外活动在早上6点到8点间增长了约15%,而在中午12点到14点间增长了约20%。
相比之下,看电视的时间在这两个时间段内分别减少了约10%和15%,上网时间则减少了约15%和20%。
这些数据变化反映出人们在一天中的生活习惯规律。
最后,总结图表传达的信息。
通过观察这幅图表,我们可以得出以下结论:随着时间推移,某城市居民越来越注重户外活动,而看电视和上网的时间则在逐渐减少。
这可能与人们越来越关注健康生活、减少室内娱乐活动的趋势有关。
当然,这种变化也可能受到其他因素的影响,如政策倡导、环境改善等。
总之,在应对雅思写作任务1的图表作文时,我们要注意观察图表内容、分析数据变化、提炼信息要点,并运用恰当的表达方式使文章更具可读性和实用性。
雅思写作第一部分满分攻略雅思写作第一部分满分攻略TASK 1写作三大步骤(1)审题:找出主要信息点,具体为两个任务:A: 辨别所要写图表的类型,是线状(line ),柱状(bar ),还是饼状(pie)等B: 找图表的主要内容,是人口变化,交通工具,受教育水平,或者是一项工艺的制作流程。
(2)构思:审题是对文章主要内容的一个大概认识,而构思就是对自己认识的进一步深化。
构思的主要任务为:分析图表的主要特征,弄清写作重点并选用适当的分析方法。
图表的主要特征是指其所描述现象或者问题的规律,并找出描述重点,不是图表上所出现的所有信息都要写出来,之后就是分析方法的选择,主要的分析方法有:数据分类,数据比较,平铺直叙法等,具体选哪种,需要根据图表的内容来确定。
(3)写作:写作是对前两个步骤的确认。
考生把自己的想法准确而详细的落实下来。
一般来说,这个部分的写作可以采用三或四段式:1)引言段(用简短的语言来描述图表的主要内容)。
一把来说,写作命题会给出的主要信息,如,The line chart below shows thegrowth of households with personal computers in the U.S.通过这句话,我们可以了解图表的主要信息,“美国每个家庭所拥有计算机量的增长变化。
”在这种情况下,考生可以重现组织一下这个具体,在中间加入一些具体的数字和变化年限等,使得阅卷老师一下就明白图表的主要内容。
引言段通用句式如下:This is a table / chart / (line线状 bar柱状pie饼状)graph whichdemonstrate / illustrate / reveal /depict/privide informationabout.............2)图表具体信息描述段:这个段落主要描写体现图表主要特征或总体变化规律的数据或信息,并用恰当的连接词语,如,on contrast , on theotherhand, however, like wise 等,把文章内容紧密的衔接起来。


雅思考试写作范文(推荐十四篇)5雅思考试写作范文(篇一)In recent years, there has been growing interest in therelationship between equality and personal people believe that individuals can achieve more inegalitarian societies. Others believe that high levels of personal achievement are possible only if individuals are free to succeed or fail according to their individual is your view of the relationship between equality and personal success?平等社会个人成就大;放任自由发展的社会个人成就大。
你认为呢?In my opinion, an egalitarian society is one in which everyone has the same rights and the same opportunities. I completely agree that people can achieve more in this kind of society.Education is an important factor with regard to personal success in life. I believe that all children should have access to free schooling, and higher education should be either free or affordable for all those who chose to pursue a university degree. In a society without free schooling or affordable higher education, only children and young adults from wealthier families would have access to the best learning opportunities, and they would therefore be better prepared for the job market. This kind of inequality would ensure the success of some but harm the prospects of others.I would argue that equal rights and opportunities are not in conflict with people's freedom to succeed or fail. In other words, equality does not mean that people lose their motivation to succeed, or that they are not allowed to fail. On the contrary, I believe that most people would feel more motivated to work hard and reach their potential if they thought that they lived in a fair society. Those who did not make the same effort would know that they had wastedtheir opportunity. Inequality, on the other hand, would be morelikely to demotivate people because they would know that the odds of success were stacked in favour of those from privileged backgrounds.In conclusion, it seems to me that there is a positive relationship between equality and personal success.【雅思考试满分作文范文【精选5篇】】雅思考试写作范文(篇二)对于第二段,将重点放在我自己的想法上,并用三点来进一步发展。

雅思小作文考官范文(精选6篇)(经典版)编制人:__________________审核人:__________________审批人:__________________编制单位:__________________编制时间:____年____月____日序言下载提示:该文档是本店铺精心编制而成的,希望大家下载后,能够帮助大家解决实际问题。
文档下载后可定制修改,请根据实际需要进行调整和使用,谢谢!并且,本店铺为大家提供各种类型的经典范文,如工作总结、工作计划、合同协议、条据文书、策划方案、句子大全、作文大全、诗词歌赋、教案资料、其他范文等等,想了解不同范文格式和写法,敬请关注!Download tips: This document is carefully compiled by this editor. I hope that after you download it, it can help you solve practical problems. The document can be customized and modified after downloading, please adjust and use it according to actual needs, thank you!Moreover, our store provides various types of classic sample essays for everyone, such as work summaries, work plans, contract agreements, doctrinal documents, planning plans, complete sentences, complete compositions, poems, songs, teaching materials, and other sample essays. If you want to learn about different sample formats and writing methods, please stay tuned!雅思小作文考官范文(精选6篇)雅思小作文考官范文第1篇第一段:复述文章主题+引出论点典型的大作文文章开篇,中规中矩,不失为实战中最好用也是最稳妥的写法。
雅思task1写作模板全文共四篇示例,供读者参考第一篇示例:雅思写作任务1是雅思考试中的第一部分,要求考生根据图表、图形或表格等形式的信息,对相关数据进行描述和比较。
这部分考试主要是考察考生的数据分析和描述能力。
为了帮助考生更好地应对雅思写作任务1,下面提供一份雅思task1写作模板供考生参考。
雅思task1写作模板第一段:引言在第一段,我们需要简要介绍图表的背景信息,如图表内容、数据来源、时间范围等。
同时简要概括图表呈现的数据趋势。
例如:This bar chart illustrates the amount of consumption of three different types of beverages in 2015 and 2020.以上就是一份简单的雅思task1写作模板,希望考生能够根据此模板进行练习和准备,提高自己的写作水平,取得理想的雅思考试成绩。
祝考生们考试顺利!第二篇示例:雅思考试是全球最著名的英语语言考试之一,被广泛认可和应用于全球范围内的教育和职业领域。
雅思写作任务1是两种写作任务之一,要求考生根据给定的图表、数据或图像来描述和解释相关信息。
为了帮助考生更好地应对雅思写作任务1,以下是一个常用的模板供考生参考:第三段:比较要点1. highlight any comparisons or contrasts shown in the graph/picture2. discuss similarities and differences between different categories or groups3. analyze the reasons behind the differences以上是一个典型的雅思写作任务1模板,考生可以根据具体情况在这个模板的基础上进行增减和调整。
在应对雅思写作任务1时,考生应该注意遵循规定的字数要求、清晰明了地描述数据和信息、合理分析数据并提出相关见解。
最新雅思Task1写作满分范文,今天小编就给大家带来了雅思Task1写作满分范文,希望能够帮助到大家,下面小编就和大家分享,来欣赏一下吧。
最新线图之座机与手机开支The line graph shows the average annual expenditures on cell phone and residential phone services between 2001 and 2010.该线图展示美国2001-2010年间年均花在手机和座机上的开支。
请作答。
雅思图表小作文线图9分范文:The line graph compares average yearly spending by Americans on mobile and landline phone services from 2001 to 2010.It is clear that spending on landline phones fell steadily over the 10-year period, while mobile phone expenditure rose quickly. The year 2006 marks the point at which expenditure on mobile services overtook that for residential phone services.In 2001, US consumers spent an average of nearly $700 on residential phone services, compared to only around $200 on cell phone services. Over the following five years, average yearly spending on landlines dropped by nearly $200. By contrast, expenditure on mobiles rose by approximately $300.In the year 2006, the average American paid out the same amount of money on both types of phone service, spending just over $500 on each. By 2010, expenditure on mobile phones had reached around $750, while the figure for spending on residential services had fallen to just over half this amount.(162 words, band 9)附雅思小作文考官范文基本套路段一:话题重述段二:概括话题数据的主要特征或规律段三:详述特征规律一段四:详述特征规律二注意:simon考官主张雅思小作文无须总结!大家可留心这一点。
雅思写作(综合)模拟试卷1(题后含答案及解析) 题型有: 2. WRITING TASK 2WRITING TASK 2You should spend about 40 minutes on this task.1.In some countries young people are encouraged to work or travel for a year between finishing high school and starting university studies. Discuss the advantages and disadvantages for young people who decide to do this.正确答案:It is quite common these days for young people in many countries to have a break from studying after graduating from high school. The trend is not restricted to rich students who have the money to travel, but is also evident among poorer students who choose to work and become economically independent for a period of time. The reasons for this trend may involve the recognition that a young adult who passes directly from school to university is rather restricted in terms of general knowledge and experience of the world. By contrast, those who have spent some time earning a living or travelling to other places, have a broader view of life and better personal resources to draw on. They tend to be more independent, which is a very important factor in academic study and research, as well as giving them an advantage in terms of coping with the challenges of student life. However, there are certainly dangers in taking time off at that important age. Young adults may end up never returning to their studies or finding it difficult to readapt to an academic environment. They may think that it is better to continue in a particular job, or to do something completely different from a university course. But overall, I think this is less likely today, when academic qualifications are essential for getting a reasonable career. My view is that young people should be encouraged to broaden their horizons. That is the best way for them to get a clear perspective of what they are hoping to do with their lives and why. Students with such a perspective are usually the most effective and motivated ones and taking a year off may be the best way to gain this. 涉及知识点:写作2.Some people argue that teaching children of different abilities together benefits all of them. Others believe that intelligent children should be taught separately and given special treatment. Discuss both views and give your own opinion.正确答案:Today, it is quite common for many schools to practice an “elite students”policy, where the intelligent students are selected and given special treatment. Personally, I think this practice generally has more benefits on several different levels. The most obvious advantage lies in the fact that it allows teachers to employ different pedagogic strategies suited to the particular group of pupils. For example, for the more intelligent students who are more likely to have a quicker mindand stronger thirst for knowledge, teachers or tutors can include something more difficult or complex in their syllabus, catering for the special needs. On the other hand, for some other students who are not that intelligent and may be slow at learning or acquiring new knowledge or skills, a correspondingly suitable teaching strategy then is highly desirable. In this case, the separate teaching scheme is generally good for both groups of students, since teachers can thereafter design different courses and teaching methods catering for their special needs. Of course, those who are in support of integration teaching may argue that separating one from another is a violation of individual rights and that everyone should be treated equally regardless of their intelligence. I think the notion of equality is not the issue. The less intelligent students can be allowed to choose some advanced courses originally designed for those fast learners, and vice versa. Overall, I think it is not bad to separate students and nurture them individually. The authorities should take into consideration their pupils’ own preference as to being in or out of one particular group so that the benefits of this system can be maximised. 涉及知识点:写作3.Since science and technology are becoming more and more important in modern society, schools should spend more time on teaching these subjects rather than on arts and humanities. To what extent do you agree or disagree?正确答案:Some people claim that scientific and technological subjects should receive more emphasis in schools, given the importance of these subjects in the modern world. However, others think that this is not a sufficient reason to neglect education in arts and humanities. Obviously, there is little doubt that science and technology have had a great influence on modern society. The commonly cited examples of the Internet boom and the need to keep pace with a fast-changing global economy show us the importance of familiarising the next generation with science and technology. But does it mean that arts and humanities should take up a smaller proportion of a students’curriculum? Arts and humanities, it is argued, help students to gain a better vision of the past and how the world has, and continues to change over time. In other words, arts and humanities help them to think; to understand the mistakes made in the past, but also to reflect upon the great things humanity has accomplished. However, with the never-ending demand for new technologies and inventions, society is starting to pay less attention to the importance of arts and humanities. Therefore some people are wondering whether subjects in arts and humanities should give way to courses focusing on science and technology. It is imaginable that if this really happened, the younger generations today would lack the skills of critical thinking, knowledge of how the world turns around us, and suffer in their ability to read, reason and communicate. At a time when so much is happening to change the way we work and live, the way we relate to one another and the way we relate to the rest of the world, we actually need more knowledge and a better understanding of our shared history, philosophy and literature so that the lessons of the past are not lost. Therefore, I believe arts and humanities should not be given less attention in schools today, and the planning of a reasonable curriculumshould consider the overall benefits to the students. 涉及知识点:写作4.In many countries schools have severe problems with student behavior. What do you think are the causes of this? What solutions can you suggest?正确答案:Poor student behavior seems to be an increasingly widespread problem and I think that modern lifestyles are probably responsible for this. In many countries, the birth rate is decreasing sb that families are smaller with fewer children. These children are-often spoilt, not in terms of love and attention because working parents do not have the time for this, but in more material ways. They are allowed to have whatever they want, regardless of price, and to behave as they please. This means that the children grow up without consideration for others and without any understanding of where their standard of living comes from. When they get to school age they have not learnt any self control or discipline. They have less respect for their teachers and refuse to obey rules in the way that their parents did. Teachers continually complain about this problem and measures should be taken to combat the situation. But I think the solution to the problem lies with the families, who need to be more aware of the future consequences of spoiling their children. If they could raise them to be considerate of others and to be social, responsible individuals, the whole community would benefit. Perhaps parenting classes are needed to help them to do this, and high quality nursery schools could be established that would support families more in terms of raising the next generation. The government should fund this kind of parental support, because this is no longer a problem for individual families, but for society as a whole. 涉及知识点:写作。
雅思task1写作模板雅思写作Task 1是许多考生感到挑战的部分,因为它要求考生在规定的时间内,对图表、表格或流程图进行分析,并以清晰、连贯的方式呈现出来。
以下是一个雅思Task 1写作模板,旨在帮助考生更好地组织文章结构,提高写作效率。
雅思Task 1写作模板:一、开头段落1.概括介绍:简要描述图表、表格或流程图的主题,说明要分析的内容。
Example: The table below presents data on the population of three countries from 2000 to 2010.2.主题句:明确指出文章要分析的主题。
Example: This report will focus on analyzing the changes in population of these countries over the given period.二、主体段落1.第一段:描述图表/表格/流程图中的第一个数据点或阶段。
a.主题句:指出要分析的数据点或阶段。
Example: The first stage of the process involves ...b.详细描述:对数据点或阶段进行详细描述,包括数据变化、比较等。
Example: In 2000, the population of Country A was 10 million, which accounted for 20% of the total population of the three countries.2.第二段:描述图表/表格/流程图中的第二个数据点或阶段。
a.主题句:指出要分析的数据点或阶段。
b.详细描述:对数据点或阶段进行详细描述,与第一段类似。
3.依次类推,描述其他数据点或阶段。
三、结尾段落1.总结句:总结文章分析的主要结果。
Example: In conclusion, the population of these three countries experienced significant changes from 2000 to 2010.2.指出可能的趋势或关联:如有必要,指出数据之间的趋势或关联。
雅思小作文大全及范文1雅思小作文大全及范文雅思考试是全球范围内最受欢迎的英语语言能力考试之一。
其中,雅思写作分为大作文和小作文两部分。
小作文主要测试考生的书面表达能力,包括图表描述、流程图描述、地图描述等。
下面将为大家提供一份雅思小作文大全及范文,以帮助考生更好地备考。
1. 图表描述题目:The chart below shows the percentage of people who played team sports in a small town in 2010 and 2015.范文:The bar chart illustrates the proportion of individuals participating in team sports in a small town in the years 2010 and 2015. Overall, it can be observed that there was a significant increase in the number of people engaging in team sports during this period.In 2010, approximately 40% of the town's population participated in team sports, while the remaining 60% did not engage in any form of team sports. However, by 2015, this figure had risen to around 60%, indicating a substantial growth in participation.Looking at the specific sports, football was the most popular team sport in both years. In 2010, around 25% of the population played football, while basketball and volleyball were played by approximately 10% and 5% of the residents, respectively. In contrast, by 2015, the percentage of people playing football had increased to nearly 40%, while basketball and volleyball saw a slight decline to about 8% and 4% respectively.In conclusion, the bar chart demonstrates that the number of individuals participating in team sports in the small town increased significantly between 2010 and 2015. Football remained the most popular sport, while basketball and volleyball experienced slight fluctuations in participation rates.2. 流程图描述题目:The diagram below shows the process of recycling plastic bottles.范文:The diagram illustrates the process of recycling plastic bottles. It can be seen that there are six main stages involved in this process, from the collection of plastic bottles to the production of new plastic products.Firstly, the plastic bottles are collected by recycling trucks and transported to a recycling center. At the recycling center, the bottles are sorted according to their type and color. This is followed by the process of shredding, where the bottles are cut into small pieces.Next, the shredded plastic is washed and cleaned to remove any impurities. Once the plastic is clean, it is melted down and transformed into small pellets. These pellets are then transported to a plastic manufacturing plant.In the manufacturing plant, the plastic pellets are reheated and molded into various shapes, such as bottles, containers, or other plastic products. Finally, the new plastic products are packaged and ready to be distributed to consumers.Overall, the diagram shows a clear and systematic process of recycling plastic bottles, starting from collection and sorting, to shredding, cleaning, melting, molding, and finally, the production of new plastic products.3. 地图描述题目:The maps below show the changes that have taken place in a seaside town between 1995 and present day.范文:The maps compare the changes that have occurred in a seaside town between 1995 and the present day. Overall, it can be seen that there have been significant developments in terms of infrastructure and facilities in the town over the years.In 1995, the town had a small harbor located to the east of the town center. There were only a few buildings near the harbor, including a hotel and a restaurant. The town center itself consisted of a few streets with residential houses and a small park.In contrast, the present day map shows a much larger and more developed town. The harbor has been expanded and now includes a marina, which can accommodate a greater number of boats. Additionally, there are several new buildings surrounding the harbor, including a shopping mall, a cinema, and a sports center.Furthermore, the town center has undergone significant changes. The number of streets has increased, and there are now more residential houses and commercial buildings. The small park has been transformed into a larger recreational area with a playground and a picnic area.In conclusion, the maps clearly demonstrate the substantial growth and development of the seaside town over the years. The expansion of the harbor, the construction of new buildings, and the improvement of recreational facilities have contributed to the overall transformation of the town.。
雅思写作task1范文Task 1 of the IELTS writing exam requires candidates to describe and interpret visual data, such as charts, graphs, tables, and diagrams. This task assesses the test-taker's ability to report and compare data, describe the stages of a process, or explain how something works. In this article, we will provide a sample response for a task 1 question and analyze the key features of a high-scoring answer.The given bar chart presents the percentage of household expenditure on five different categories in a European country in 2016. The categories include housing, food and drink, transport, leisure and education, and finally, other goods and services. It is evident that housing accounted for the largest proportion of household spending, while leisure and education had the lowest share.To begin with, housing was the most significant expenditure for households, comprising approximately 35% of the total budget. This was followed by food and drink, which represented around 20% of the expenditure. Transport and leisure and education accounted for similar proportions, at approximately 15% and 10% respectively. Finally, other goods and services made up the smallest share, at just under 10%.In terms of the key features of a high-scoring response, it is essential to accurately describe the data presented in the visual, as well as make comparisons where relevant. This sample response provides a clear and concise overview of the main trends in the data, including the highest and lowest expenditure categories, as well as the similarities and differences between the other categories. Additionally, the response uses a range of appropriate vocabulary to describe the data, such as "comprising," "represented," and "proportions."Furthermore, the response is well-organized and logically structured, with a clear introduction, body paragraphs, and conclusion. The information is presented in a coherent and cohesive manner, with each paragraph building on the previous one and leading to a logical conclusion. This demonstrates the test-taker's ability to effectively organize and present information in a written format.In conclusion, the sample response provided effectively describes and interprets the visual data presented in the bar chart. It accurately reports the main trends and features of the data, uses a range of appropriate vocabulary, and is well-organized and logically structured. These key features are essential for achieving a high score in task 1 of the IELTS writing exam.。
雅思写作1Some people think that universities should provide graduates with the knowledge and skills needed in the workplace. Others think that the true function of a university should be to give access to knowledge for its own sake, regardless of whether the course is useful to an employer.What, in your opinion, should be the main function of a university翻译练习:1.学生们上大学的目的是为了有能力找到好的工作。
The purpose of the students going to university is to be capable of gettinga good job.2.如果大学注重开设工作岗位所需要的课程,就会得到一些研究的良策,还可以跟上时代的脚步。
Focusing on the needs of the workplace, university could get sound strategies to do research and keep up with the time.3.如果学生们学了这些和工作有关的课程后,就会更容易找到好的工作,这可以促进我国经济发展。
Having these lessons relating to workplaces, students could get a job more easily, which promotes the development of the economy in our country.范文一:What knowledge and skills should universities provide has been argued for many years. Some people think that the true function of universities provide knowledge for their own purpose, but nowadays, more and more people point out that universities should provide graduates with the knowledge and skills according to their workplace.The first reason for universities should provide this knowledge and skill is the students’needs. Obviously, the most of the students go to university purpose of is to get some knowledge and skills which could make them have the ability to get a job. If a university does not provide these knowledge and skills, the students might not get a job and they would be very disappointed. As a result, the university would lose its students.Moreover, providing knowledge and skills needed in the workplace make a university progress. The new skills and information always are initiated in the workplace, so focusing on the needs of the workplace, university could get sound strategies to do research and make the modernization.Lastly, providing these knowledge and skills could benefit our country which usually gives a financial support to universities. Having these knowledge and skills, students are more easy to get a job, and this can make our country’s economy strong.In conclusion, it can be said that providing the knowledge and skills which the workplace needs is every universities’basic functions.Some people think that universities should not provide theoretical knowledge; instead, practical training courses should be provided to meet the needs of society. To what extent do you agree with this opinion?翻译练习:1.中国加入世贸组织后,大量的跨国公司涌入了城市和农村。
After China’s entry into the WTO, a large number of multinational firms have flooded into cities and rural areas.2. 实践应该预先被理论所检验。
Practical uses should be examined in theory in advance.3.大学应该开设基础理论课程,同时也要注重实践训练课程的开设。
Universities should provide basic theoretical courses and also focus on teaching practical training courses.范文二:Whenever a high school senior fills out college applications, he is more likely to consult his parents or some friends for making a right decision. His parents may instruct him to get through a process which leads him to the right major in a right university, and later, the right job for him. Job-orientated courses are welcomed by most of the students, but still, theoretical knowledge plays an important role in society.On the one hand, professional training can help students seek more job opportunities. Since computers are wildly used, a college graduate equipped with advanced knowledge of computer net-work or programming is expected to get a good-paid job. Next, I would like to show another phenomenon in China. After China’s entry into the WTO, a large number of multinational firms have flooded into many cities and some rural areas. A critical shortage of bilingual persons is signaling to the universities that foreign languages ought to be conducted for all students.On the other hand, practical uses should be examined in theory in advance. Looking back to the history, you can see that most of the scientific inventions were generated by theoretical knowledge. For example, man was imitating the birds when he was attempting to fly. Basing on this theory, the Wright brothers invented the first airplane. In the present time, all engineering majors are required to lay on a solid foundation of theoretical knowledge, which will help them better understand the applied courses in the following years.Finally, I will conclude this essay with a rational suggestion: universities should provide basic theoretical courses and focus on teaching practical training courses because professional skills will benefit the students’future careers, and simple theories can help them be more successful.The diagrams show the processes and the equipments used to make cement, and how these are used to produce concrete for building purposes. The first step in the cement productions is to introduce limestone and clay. These materials pass through a crusher that produces a powder . Then this powder goes into a mixer. After this, the product passes to a rotating heater which works with heat. Afterwards, the mixture goes into a grinder where the cement comes out. At the end of the process, the cement is packed in bags.Referring to the concrete production, the process begins with a combination of 15% cement, 10% water, 25% sand and 50% gravel. These four elements are introduced into a concrete mixer.As mentioned above, the concrete production takes fewer steps thanthe cement production, however, it is necessary to use more materials than the latter process in order to obtain the final product.The last difference between both progresses is that the concrete mixer does not work with heat.。