微观经济学原理曼昆英文第四章 ppt课件
- 格式:ppt
- 大小:1.32 MB
- 文档页数:53
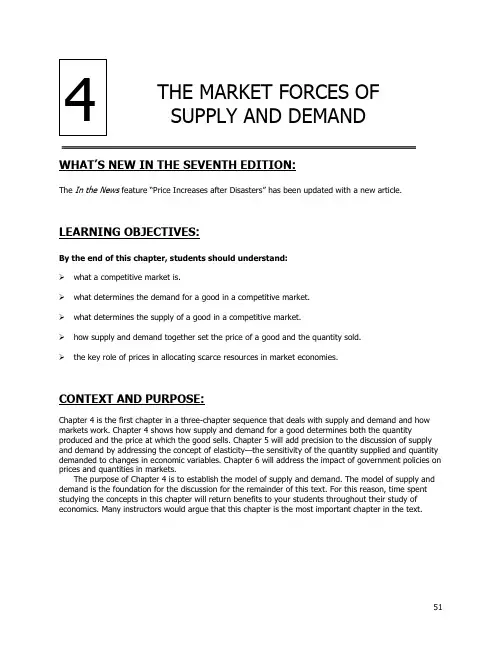
51WHAT’S NEW IN THE S EVENTH EDITION:The In the News feature “Price Increases after Disasters” has been updated with a new article.LEARNING OBJECTIVES:By the end of this chapter, students should understand:➢ what a competitive market is.➢ what determines the demand for a good in a competitive market.➢ what determines the supply of a good in a competitive market.➢ how supply and demand together set the price of a good and the quantity sold.➢ the key role of prices in allocating scarce resources in market economies.CONTEXT AND PURPOSE:Chapter 4 is the first chapter in a three-chapter sequence that deals with supply and demand and how markets work. Chapter 4 shows how supply and demand for a good determines both the quantity produced and the price at which the good sells. Chapter 5 will add precision to the discussion of supply and demand by addressing the concept of elasticity —the sensitivity of the quantity supplied and quantity demanded to changes in economic variables. Chapter 6 will address the impact of government policies on prices and quantities in markets.The purpose of Chapter 4 is to establish the model of supply and demand. The model of supply and demand is the foundation for the discussion for the remainder of this text. For this reason, time spent studying the concepts in this chapter will return benefits to your students throughout their study of economics. Many instructors would argue that this chapter is the most important chapter in the text.THE MARKET FORCES OF SUPPLY AND DEMAND52 ❖Chapter 4/The Market Forces of Supply and DemandKEY POINTS:• Economists use the model of supply and demand to analyze competitive markets. In a competitive market, there are many buyers and sellers, each of whom has little or no influence on the market price.• The demand curve shows how the quantity of a good demanded depends on the price. According to the law of demand, as the price of a good falls, the quantity demanded rises. Therefore, the demand curve slopes downward.• In addition to price, other determinants of how much consumers want to buy include income, the prices of substitutes and complements, tastes, expectations, and the number of buyers. If one of these factors changes, the demand curve shifts.• The supply curve shows how the quantity of a good supplied depends on the price. According to the law of supply, as the price of a good rises, the quantity supplied rises. Therefore, the supply curve slopes upward.• In addition to price, other determinants of how much producers want to sell include input prices, technology, expectations, and the number of sellers. If one of these factors changes, the supply curve shifts.• The intersection of the supply and demand curves determines the market equilibrium. At the equilibrium price, the quantity demanded equals the quantity supplied.• The behavior of buyers and sellers naturally drives markets toward their equilibrium. When the market price is above the equilibrium price, there is a surplus of the good, which causes the market price to fall. When the market price is below the equilibrium price, there is a shortage, which causes the market price to rise.• To analyze how any event influences a market, we use the supply-and-demand diagram to examine how the event affects equilibrium price and quantity. To do this we follow three steps. First, we decide whether the event shifts the supply curve or the demand curve (or both). Second, we decide which direction the curve shifts. Third, we compare the new equilibrium with the initial equilibrium.• In market economies, prices are the signals that guide economic decisions and thereby allocate scarce resources. For every good in the economy, the price ensures that supply and demand are in balance. The equilibrium price then determines how much of the good buyers choose to consume and how much sellers choose to produce.Chapter 4/The Market Forces of Supply and Demand ❖ 53CHAPTER OUTLINE: I. Markets and CompetitionA. What Is a Market?1. Definition of market: a group of buyers and sellers of a particular good or service.2. Markets can take many forms and may be organized (agricultural commodities) or lessorganized (ice creamB. What Is Competition?1. Definition of competitive market: a market in which there are so many buyers andso many sellers that each has a negligible impact on the market price.2. Each buyer knows that there are several sellers from which to choose. Sellers know that each buyer purchases only a small amount of the total amount sold.C. In this chapter, we will assume that markets are perfectly competitive.1. Characteristics of a perfectly competitive market:a. The goods being offered for sale are exactly the same.b. The buyers and sellers are so numerous that no single buyer or seller has any influence over the market price.2. Because buyers and sellers must accept the market price as given, they are often called "price takers."3. Not all goods are sold in a perfectly competitive market.a. A market with only one seller is called a monopoly market.b. Other markets fall between perfect competition and monopoly.54 ❖ Chapter 4/The Market Forces of Supply and DemandD. We will start by studying perfect competition.1. Perfectly competitive markets are the easiest to analyze because buyers and sellers take the price as a given.2. Because some degree of competition is present in most markets, many of the lessons that we learn by studying supply and demand under perfect competition apply in morecomplicated markets.II. DemandA. The Demand Curve: The Relationship between Price and Quantity Demanded1. Definition of quantity demanded: the amount of a good that buyers are willing andable to purchase.2. One important determinant of quantity demanded is the price of the product.a. Quantity demanded is negatively related to price. This implies that the demand curve isdownward sloping.b. Definition of law of demand: the claim that, other things being equal, thequantity demanded of a good falls when the price of the good rises .3. Definition of demand schedule: a table that shows the relationship between theprice of a good and the quantity demanded. Price of Ice-Cream ConeQuantity of Cones Demanded$0.0012 $0.5010 $1.008 $1.506 $2.004 $2.502 $3.00Figure 1Make sure that you explain that, when we discuss the relationship between quantity demanded and price, we hold all other variables constant. You will need toemphasize this more than once to ensure that students understand why a change inprice leads to a movement along the demand curve.Chapter 4/The Market Forces of Supply and Demand ❖ 554. Definition of demand curve: a graph of the relationship between the price of a good and the quantity demanded.a. Price is generally drawn on the vertical axis.b. Quantity demanded is represented on the horizontal axis. B. Market Demand versus Individual Demand1. The market demand is the sum of all of the individual demands for a particular good orservice.2. The demand curves are summed horizontally —meaning that the quantities demanded are added up for each level of price.3. The market demand curve shows how the total quantity demanded of a good varies with the price of the good, holding constant all other factors that affect how much consumers want to buy.C. Shifts in the Demand Curve1. Because the market demand curve holds other things constant, it need not be stable overtime.56 ❖ Chapter 4/The Market Forces of Supply and Demand2. If any of these other factors change, the demand curve will shift.a. An increase in demand is represented by a shift of the demand curve to the right.b. A decrease in demand is represented by a shift of the demand curve to the left.3. Incomea. The relationship between income and quantity demanded depends on what type of good the product is.b. Definition of normal good: a good for which, other things equal, an increase in income leads to an increase in demand.c. Definition of inferior good: a good for which, other things equal, an increase inincome leads to a decrease in demand.4. Prices of Related Goodsa. Definition of substitutes: two goods for which an increase in the price of one good leads to an increase in the demand for the other.b. Definition of complements: two goods for which an increase in the price of one good leads to a decrease in the demand for the other.5. Tastes6. Expectationsa. Future incomeb. Future prices7. Number of BuyersChapter 4/The Market Forces of Supply and Demand ❖57D. Case Study: Two Ways to Reduce the Quantity of Smoking Demanded1. Public service announcements, mandatory health warnings on cigarette packages, and theprohibition of cigarette advertising on television are policies designed to reduce the demandfor cigarettes (and shift the demand curve to the left).2. Raising the price of cigarettes (through tobacco taxes) lowers the quantity of cigarettesdemanded.a. The demand curve does not shift in this case, however.b. An increase in the price of cigarettes can be shown by a movement along the originaldemand curve.3. Studies have shown that a 10% increase in the price of cigarettes causes a 4% reduction inthe quantity of cigarettes demanded. For teens, a 10% increase in price leads to a 12% dropin quantity demanded.4. Studies have also shown that a decrease in the price of cigarettes is associated with greateruse of marijuana. Thus, it appears that tobacco and marijuana are complements.III. SupplyA. The Supply Curve: The Relationship between Price and Quantity Supplied1. Definition of quantity supplied: the amount of a good that sellers are willing andable to sell.a. Quantity supplied is positively related to price. This implies that the supply curve will beupward sloping.b. Definition of law of supply: the claim that, other things equal, the quantitysupplied of a good rises when the price of the good rises.2. Definition of supply schedule: a table that shows the relationship between the priceof a good and the quantity supplied.58 ❖ Chapter 4/The Market Forces of Supply and Demand3. Definition of supply curve: a graph of the relationship between the price of a good and the quantity supplied. Price of Ice-Cream ConeQuantity of Cones Supplied$0.000 $0.50 0 $1.001 $1.502 $2.003 $2.504 $3.005B. Market Supply versus Individual Supply1. The market supply curve can be found by summing individual supply curves.2. Individual supply curves are summed horizontally at every price.3. The market supply curve shows how the total quantity supplied varies as the price of thegood varies.C. Shifts in the Supply Curve1. Because the market supply curve holds other things constant, the supply curve will shift ifany of these factors changes.a. An increase in supply is represented by a shift of the supply curve to the right.b. A decrease in supply is represented by a shift of the supply curve to the left.Figure 5Figure 7Figure 6You will want to take time to emphasize the difference between a “change in supply” and a “change in quantity supplied.”Chapter 4/The Market Forces of Supply and Demand ❖ 592. Input Prices3. Technology4. Expectations5. Number of Sellers IV. Supply and Demand TogetherA. Equilibrium1. The point where the supply and demand curves intersect is called the market’s equilibrium.2. Definition of equilibrium: a situation in which the market price has reached thelevel at which quantity supplied equals quantity demanded.3. Definition of equilibrium price: the price that balances quantity supplied andquantity demanded.4. The equilibrium price is often called the "market-clearing" price because both buyers andsellers are satisfied at this price.Table 2Figure 8 Students will benefit from seeing equilibrium using both a graph and a supply-and-demand schedule. The schedule will also make it easier for students to understand concepts such as shortages and surpluses.60 ❖Chapter 4/The Market Forces of Supply and Demand5. Definition of equilibrium quantity: the quantity supplied and the quantitydemanded at the equilibrium price.6. If the actual market price is higher than the equilibrium price, there will be a surplus of thegood.Figure 9a. Definition of surplus: a situation in which quantity supplied is greater thanquantity demanded.b. To eliminate the surplus, producers will lower the price until the market reachesequilibrium.7. If the actual price is lower than the equilibrium price, there will be a shortage of the good.a. Definition of shortage: a situation in which quantity demanded is greater thanquantity supplied.b. Sellers will respond to the shortage by raising the price of the good until the marketreaches equilibrium.8. Definition of the law of supply and demand: the claim that the price of any goodadjusts to bring the supply and demand for that good into balance.B. Three Steps to Analyzing Changes in Equilibrium 1. Decide whether the event shifts the supply or demand curve (or perhaps both). 2. Determine the direction in which the curve shifts.3. Use the supply-and-demand diagram to see how the shift changes the equilibrium price andquantity. C. Example: A change in market equilibrium due to a shift in demand —the effect of hot weather onthe market for ice cream.D. Shifts in Curves versus Movements along Curves1. A shift in the demand curve is called a "change in demand." A shift in the supply curve iscalled a "change in supply."2. A movement along a fixed demand curve is called a "change in quantity demanded." Amovement along a fixed supply curve is called a "change in quantity supplied." E. Example: A change in market equilibrium due to a shift in supply —the effect of a hurricane thatdestroys part of the sugar-cane crop and drives up the price of sugar.F. Example: Shifts in both supply and demand —the effect of hot weather and a hurricane thatdestroys part of the sugar cane crop. G. Summary1. When an event shifts the supply or demand curve, we can examine the effects on theequilibrium price and quantity.ALTERNATIVE CLASSROOM EXAMPLE:Go through these examples of events that would shift either the demand or supply of #2 lead pencils:▪ an increase in the income of consumers▪ an increase in the use of standardized exams (using opscan forms) ▪ a decrease in the price of graphite (used in the production of pencils) ▪ a decrease in the price of ink pens ▪ the start of a school year▪ new technology that lowers the cost of producing pencils.2. Table 4 reports the end results of these shifts in supply and demand.H. In the News: Price Increases after Disasters1. When a disaster strikes a region, many good experience an increase in demand or a decreasein supply resulting in upward pressure on prices.2. This article from defends price increases following natural disasters as a naturalresult of market interactions.V. Conclusion: How Prices Allocate ResourcesA. The model of supply and demand is a powerful tool for analyzing markets.B. Supply and demand together determine the prices of the economy’s goods and services.1. These prices serve as signals that guide the allocation of scarce resources in the economy.2. Prices determine who produces each good and how much of each good is produced.SOLUTIONS TO TEXT PROBLEMS:Quick Quizzes1. A market is a group of buyers (who determine demand) and a group of sellers (whodetermine supply) of a particular good or service. A perfectly competitive market is one inwhich there are many buyers and many sellers of an identical product so that each has anegligible impact on the market price.2. Here is an example of a monthly demand schedule for pizza:Price of Pizza Slice Number of Pizza Slices Demanded$ 0.00 100.25 90.50 80.75 71.00 61.25 51.50 41.75 32.00 22.25 12.50 0The demand curve is graphed in Figure 1.Figure 1Examples of things that would shift the demand curve include changes in income, prices ofrelated goods like soda or hot dogs, tastes, expectations about future income or prices, andthe number of buyers.A change in the price of pizza would not shift this demand curve; it would only lead to amovement from one point to another along the same demand curve.3. Here is an example of a monthly supply schedule for pizza:Price of Pizza Slice Number of PizzaSlices Supplied$ 0.00 00.25 1000.50 2000.75 3001.00 4001.25 5001.50 6001.75 7002.00 8002.25 9002.50 1000The supply curve is graphed in Figure 2.Figure 2Figure 3Examples of things that would shift the supply curve include changes in prices of inputs like tomato sauce and cheese, changes in technology like more efficient pizza ovens or automatic dough makers, changes in expectations about the future price of pizza, or a change in the number of sellers.A change in the price of pizza would not shift this supply curve; it would only lead to amovement from one point to another along the same supply curve.4. If the price of tomatoes rises, the supply curve for pizza shifts to the left because there hasbeen an increase in the price of an input into pizza production, but there is no shift indemand. The shift to the left of the supply curve causes the equilibrium price to rise and the equilibrium quantity to decline, as Figure 3 shows.If the price of hamburgers falls, the demand curve for pizza shifts to the left because thelower price of hamburgers will lead consumers to buy more hamburgers and fewer pizzas,but there is no shift in supply. The shift to the left of the demand curve causes theequilibrium price to fall and the equilibrium quantity to decline, as Figure 4 shows.Figure 4Questions for Review1. A competitive market is a market in which there are many buyers and many sellers of anidentical product so that each has a negligible impact on the market price. Another type ofmarket is a monopoly, in which there is only one seller. There are also other markets that fallbetween perfect competition and monopoly.2. The demand schedule is a table that shows the relationship between the price of a good andthe quantity demanded. The demand curve is the downward-sloping line relating price andquantity demanded. The demand schedule and demand curve are related because thedemand curve is simply a graph showing the points in the demand schedule.The demand curve slopes downward because of the law of demand—other things beingequal, when the price of a good rises, the quantity demanded of the good falls. People buyless of a good when its price rises, both because they cannot afford to buy as much andbecause they switch to purchasing other goods.3. A change in consumers' tastes leads to a shift of the demand curve. If the change inconsumers' tastes leads to an increase in demand, consumers want to buy more of this goodat every price level. A change in price leads to a movement along the demand curve.Because price is measured on the vertical axis, a change in the price represents a movementalong the demand curve.4. Because Popeye buys more spinach when his income falls, spinach is an inferior good for him.His demand curve for spinach shifts out to the right as a result of the decrease in his income.5. A supply schedule is a table showing the relationship between the price of a good and thequantity a producer is willing and able to supply. The supply curve is the upward-sloping linerelating price and quantity supplied. The supply schedule and the supply curve are related because the supply curve is simply a graph showing the points in the supply schedule.The supply curve slopes upward because when the price is high, suppliers' profits increase, so they supply more output to the market. The result is the law of supply—other things being equal, when the price of a good rises, the quantity supplied of the good also rises.6. A change in producers' technology leads to a shift in the supply curve. A change in priceleads to a movement along the supply curve.7. The equilibrium of a market is the point at which the quantity demanded is equal to quantitysupplied. If the price is above the equilibrium price, sellers want to sell more than buyers want to buy, so there is a surplus. Sellers try to increase their sales by cutting prices. That continues until they reach the equilibrium price. If the price is below the equilibrium price, buyers want to buy more than sellers want to sell, so there is a shortage. Sellers can raise their price without losing customers. That continues until they reach the equilibrium price.8. When the price of beer rises, the demand for pizza declines, because beer and pizza arecomplements and people want to buy less beer. When we say the demand for pizza declines, we mean that the demand curve for pizza shifts to the left as in Figure 5. The supply curve for pizza is not affected. With a shift to the left in the demand curve, the equilibrium price and quantity both decline, as the figure shows. Thus, the quantity of pizza supplied anddemanded both fall. In sum, supply is unchanged, demand is decreased, quantity supplied declines, quantity demanded declines, and the price falls.Figure 59. Prices play a vital role in market economies because they bring markets into equilibrium. Ifthe price is different from its equilibrium level, quantity supplied and quantity demanded are not equal. The resulting surplus or shortage leads suppliers to adjust the price untilequilibrium is restored. Prices thus serve as signals that guide economic decisions andallocate scarce resources.Quick Check Multiple Choice1. b2. b3. d4. b5. a6. cProblems and Applications1. a. Cold weather damages the orange crop, reducing the supply of oranges and raising theprice of oranges. This leads to a decline in the supply of orange juice because orangesare an important input in the production of orange juice. This can be seen in Figure 6 asa shift to the left in the supply curve for orange juice. The new equilibrium price is higherthan the old equilibrium price.Figure 6b. People often travel to the Caribbean from New England to escape cold weather, so thedemand for Caribbean hotel rooms is high in the winter. In the summer, fewer peopletravel to the Caribbean, because northern climates are more pleasant. The result, asshown in Figure 7, is a shift to the left in the demand curve. The equilibrium price ofCaribbean hotel rooms is thus lower in the summer than in the winter, as the figureshows.Figure 7c. When a war breaks out in the Middle East, many markets are affected. Because a largeproportion of oil production takes place there, the war disrupts oil supplies, shifting thesupply curve for gasoline to the left, as shown in Figure 8. The result is a rise in theequilibrium price of gasoline. With a higher price for gasoline, the cost of operating agas-guzzling automobile like a Cadillac will increase. As a result, the demand for usedCadillacs will decline, as people in the market for cars will not find Cadillacs as attractive.In addition, some people who already own Cadillacs will try to sell them. The result isthat the demand curve for used Cadillacs shifts to the left, while the supply curve shifts to the right, as shown in Figure 9. The result is a decline in the equilibrium price of used Cadillacs.Figure 8 Figure 92. The statement is false. As Figure 10 shows, in equilibrium the increase in demand fornotebooks results in an increased quantity demanded and the quantity supplied.Figure 10 Figure 113. a. If people decide to have more children, they will want larger vehicles for hauling theirkids around, so the demand for minivans will increase. Supply will not be affected. The result is a rise in both the price and the quantity sold, as Figure 12 shows.Figure 12 Figure 13b. If a strike by steelworkers raises steel prices, the cost of producing a minivan rises andthe supply of minivans decreases. Demand will not be affected. The result is a rise in the price of minivans and a decline in the quantity sold, as Figure 13 shows.c. The development of new automated machinery for the production of minivans is animprovement in technology. This reduction in firms' costs will result in an increase in supply. Demand is not affected. The result is a decline in the price of minivans and an increase in the quantity sold, as Figure 14 shows.Figure 14d. The rise in the price of sport utility vehicles affects minivan demand because sport utilityvehicles are substitutes for minivans. The result is an increase in demand for minivans.Supply is not affected. The equilibrium price and quantity of minivans both rise, as Figure12 shows.e. The reduction in peoples' wealth caused by a stock-market crash reduces their income,leading to a reduction in the demand for minivans, because minivans are likely a normal good. Supply is not affected. As a result, both the equilibrium price and the equilibrium quantity decline, as Figure 15 shows.Figure 154. a. DVDs and TV screens are likely to be complements because you cannot watch a DVDwithout a television. DVDs and movie tickets are likely to be substitutes because a movie can be watched at a theater or at home. TV screens and movie tickets are likely to besubstitutes for the same reason.b. The technological improvement would reduce the cost of producing a TV screen, shiftingthe supply curve to the right. The demand curve would not be affected. The result is that the equilibrium price will fall, while the equilibrium quantity will rise. This is shown inFigure 16.Figure 16c. The reduction in the price of TV screens would lead to an increase in the demand forDVDs because TV screens and DVDs are complements. The effect of this increase in the demand for DVDs is an increase in both the equilibrium price and quantity, as shown inFigure 17.Figure 17The reduction in the price of TV screens would cause a decline in the demand for movie tickets because TV screens and movie tickets are substitute goods. The decline in thedemand for movie tickets would lead to a decline in the equilibrium price and quantitysold. This is shown in Figure 18.Figure 185. Technological advances that reduce the cost of producing computer chips represent a declinein an input price for producing a computer. The result is a shift to the right in the supply of computers, as shown in Figure 19. The equilibrium price falls and the equilibrium quantity rises, as the figure shows.Figure 19Because computer software is a complement to computers, the lower equilibrium price of computers increases the demand for software. As Figure 20 shows, the result is a rise in both the equilibrium price and quantity of software.Figure 20Because typewriters are substitutes for computers, the lower equilibrium price of computers reduces the demand for typewriters. As Figure 21 shows, the result is a decline in both the equilibrium price and quantity of typewriters.Figure 216. a. When a hurricane in South Carolina damages the cotton crop, it raises input prices forproducing sweatshirts. As a result, the supply of sweatshirts shifts to the left, as shownin Figure 22. The new equilibrium price is higher and the new equilibrium quantity ofsweatshirts is lower.。


微观经济学Chapter4The Market Forces of SupplyAnd Demand完全竞争市场被定义有两个基本特点:1)提供的物品全部相同2)买者与卖者众多,因此没有单一买家或卖家可以影响市场价格。
由于买卖双方都必须接受这一价格,我们称他们为价格接受者。
有些市场我们是可以考虑为完全竞争的。
谷物市场,比如说,有成千的销售者和上万的买家,没有人可以撼动市场价格,我们说它是完全竞争的。
不是每个市场都是完全竞争的,有一种情况称为垄断,在垄断的情况下,价格由唯一的卖价设定。
一些市场介于完全竞争与垄断之间,称为寡头垄断:由一定数量的卖家,但并不激烈地竞争。
航空公司是一个范例,如果一条航线只由两到三个载运承担,则这些承运者可以躲避竞争,从而使机票价格保持在高位。
另一种竞争是垄断竞争。
市场中有很多买家,但他们的商品不尽相同,因此他们有权为自己定价。
举例:杂志。
杂志竞争中,市场里随时都能闯入新人,并开创新的杂志。
尽管今天市场种产品多样,我们仍要从完全竞争学起。
完全竞争市场在这当中最容易分析。
需求Figure 3(需求增长,曲线右移,需求下降,曲线左移)指出,有很多变数可以影响需求曲线,以下是一些主要的:收入(Income )低收入意味着你的支出将减少,低而降低了,我们就说这种商品为normal good .不是所有商品都为一般商品,如果收入下降而需求升高,则我们称该商品为替代商品(Inferior good )。
就像,收入降低时,我们不会去买车或打出租车,而改坐公交。
1234567相关产品价格(Price of Related Goods)假如,冻酸奶的价格下降,则需求定理告诉我们,我们可能去购买冻得更好的酸奶。
同时,你会减少冰淇淋的购买量。
因为冰淇淋和冻酸奶都是冷的、甜的、奶油制甜品,他们满足人本呈负相关。
技术(Technology)技术有利于降低商品成本,解放人力,降低成本后,先进的技术增加了供给量。