常见的MATLAB绘图程序
- 格式:docx
- 大小:15.60 KB
- 文档页数:5

![[整理]Matlab学习笔记--Matlab画图.](https://uimg.taocdn.com/91443f3876c66137ee0619eb.webp)
1.基本绘图函数:2.Matlab绘图步骤3.plot(x,y,s) s是字符串,不同的字符串代表不同的线型plot(x1,y1,s1,x2,y2,s2,…..)是将多个图形或函数曲线拼接放置在同一个图形框中。
函数曲线的颜色、线型和数据点型上面左边的b代表蓝色,-.代表点线型,就是x取的各点之间的连线为-.,而x取值的各个点的类型为空,就代表是默认的点型上面那个是r代表红色,--代表线型,而点型是*就是x取了多少个点,就多少个*,而*和*直接的连接为—上面的s里面的写法为:线型+颜色+点型线性为-.,颜色为k代表黑色,点型为h代表六角星型。
我们还可以不定义线性,为空,那么两个点之间就不连线了。
4.我们还可以定义曲线的颜色和线宽LineWidth:设定绘图曲线的粗细MarkerEdgeColor:数据点型或边界的颜色(圆形、菱形、六角星型等) MarkerFaceColor:数据点型的天聪颜色。
MarkerSize:数据点的大小从上可以看出:线型为--,颜色为r代表红色,点型为s代表方形,线的粗细为3,点标记的颜色为r代表红色,点标记的填充颜色为y代表黄色,点标记的大小为10.5.很多时候,需要在一张图上多次画多条曲线。
就需要hold函数:即图形保持命令,主要用于暂存当前的图形窗口,可以让用户继续在命令窗口中绘制其他函数图形,并且后续的图形曲线与当前窗口中的曲线在同一个图形界面中显示。
Hold函数不会因后面画的图形的坐标值不一样而改变当前坐标轴的定义范围。
Hold on函数:作用同上,但可以根据新的图形曲线的坐标轴极限值来自动调整当前坐标轴的坐标值。
Hold off函数:结束当前的图形保持状态,一般与Hold on匹配,hold off函数后就需要从新设置坐标轴的属性。
Hold All函数:保留当前的颜色和线型,这样在绘制后面的图形时就是用当前的颜色和线型。
这里x变换是从0—1我们通过hold on之后,就把后面的1—2的变换接上去了,效果很好。

Matlab绘图强大的绘图功能是Matlab的特点之一,Matlab提供了一系列的绘图函数,用户不需要过多的考虑绘图的细节,只需要给出一些基本参数就能得到所需图形,这类函数称为高层绘图函数。
此外,Matlab还提供了直接对图形句柄进行操作的低层绘图操作。
这类操作将图形的每个图形元素(如坐标轴、曲线、文字等)看做一个独立的对象,系统给每个对象分配一个句柄,可以通过句柄对该图形元素进行操作,而不影响其他部分。
本章介绍绘制二维和三维图形的高层绘图函数以及其他图形控制函数的使用方法,在此基础上,再介绍可以操作和控制各种图形对象的低层绘图操作。
一.二维绘图二维图形是将平面坐标上的数据点连接起来的平面图形。
可以采用不同的坐标系,如直角坐标、对数坐标、极坐标等。
二维图形的绘制是其他绘图操作的基础。
一.绘制二维曲线的基本函数在Matlab中,最基本而且应用最为广泛的绘图函数为plot,利用它可以在二维平面上绘制出不同的曲线。
1.plot函数的基本用法plot函数用于绘制二维平面上的线性坐标曲线图,要提供一组x坐标和对应的y坐标,可以绘制分别以x和y为横、纵坐标的二维曲线。
plot函数的应用格式plot(x,y) 其中x,y为长度相同的向量,存储x坐标和y坐标。
例51 在[0 , 2pi]区间,绘制曲线程序如下:在命令窗口中输入以下命令>> x=0:pi/100:2*pi;>> y=2*exp(-0.5*x).*sin(2*pi*x);>> plot(x,y)程序执行后,打开一个图形窗口,在其中绘制出如下曲线注意:指数函数和正弦函数之间要用点乘运算,因为二者是向量。
例52 绘制曲线这是以参数形式给出的曲线方程,只要给定参数向量,再分别求出x,y向量即可输出曲线:>> t=-pi:pi/100:pi;>> x=t.*cos(3*t);>> y=t.*sin(t).*sin(t);>> plot(x,y)程序执行后,打开一个图形窗口,在其中绘制出如下曲线以上提到plot函数的自变量x,y为长度相同的向量,这是最常见、最基本的用法。
Matlab二维绘图2010-06-08 20:41本节介绍MATLAB 的两种基本绘图功能:二维平面图形和三维立体图形。
5.1 二维平面图形5.1.1 基本图形函数plot 是绘制二维图形的最基本函数,它是针对向量或矩阵的列来绘制曲线的。
也就是说,使用plot 函数之前,必须首先定义好曲线上每一点的x 及y 坐标,常用格式为:(1)plot(x) 当x 为一向量时,以x 元素的值为纵坐标,x 的序号为横坐标值绘制曲线。
当x 为一实矩阵时,则以其序号为横坐标,按列绘制每列元素值相对于其序号的曲线,当x 为m× n 矩阵时,就由n 条曲线。
(2)plot(x,y) 以x 元素为横坐标值,y 元素为纵坐标值绘制曲线。
(3)plot(x,y1,x,y2,…) 以公共的x 元素为横坐标值,以y1,y2,… 元素为纵坐标值绘制多条曲线。
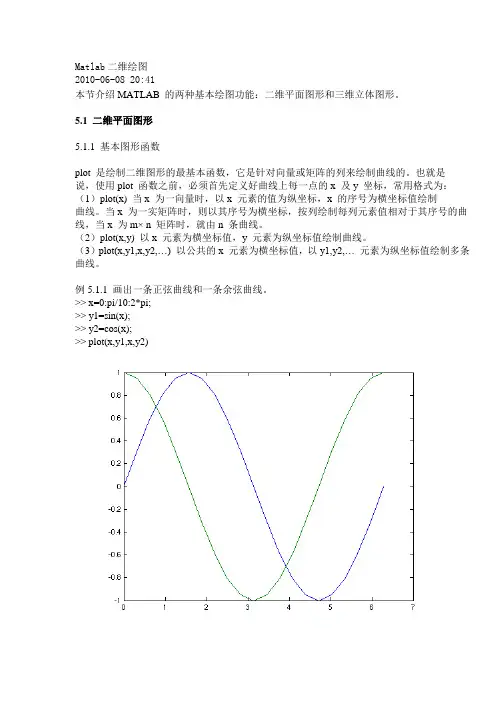
例5.1.1 画出一条正弦曲线和一条余弦曲线。
>> x=0:pi/10:2*pi;>> y1=sin(x);>> y2=cos(x);>> plot(x,y1,x,y2)图5.1.1 函数plot 绘制的正弦曲线在绘制曲线图形时,常常采用多种颜色或线型来区分不同的数据组,MATLAB 软件专门提供了这方面的参数选项(见表5.1.1),我们只要在每个坐标后加上相关字符串,就可实现它们的功能。
表5.1.1 绘图参数表色彩字符颜色线型字符线型格式标记符号数据点形式标记符号数据点形式y 黄- 实线. 点< 小于号m 紫:点线o 圆s 正方形c 青-. 点划线x 叉号d 菱形r 红- - 虚线+ 加号h 六角星g 绿* 星号p 五角星b 蓝v 向下三角形w 白^ 向上三角形k 黑> 大于号例如,在上例中输入>> plot(x,y1,'r+-',x,y2,'k*:')则得图5.1.2图5.1.2 使用不同标记的plot 函数绘制的正弦曲线5.1.2 图形修饰MATLAB 软件为用户提供了一些特殊的图形函数,用于修饰已经绘制好的图形。
1.第一步,建立一个M文件,用来存贮函数,本例题以达芬方程(Duffing)为例,其中force为参数function df=dafen(t,x,flag,force)df=[x(2);force*cos(1.2*t)-x(1)^3+x(1)-0.3*x(2)];第二步,建立一个画图的M文件clearforce=0.222;options=odeset('RelTol',1e-7);%定义误差精度的,系统默认1e-3,如果改为1e-3,X将等于0tt=2*pi/1.2 %定义步长的[t,x]=ode45(@dafen,[0:tt/100:80*tt],[0,0],options,[],force);figureplot(x(2000:end,1),x(2000:end,2),'-')%X=x-xxx %检验options的%pojialaihold oni=2000:100:3000plot(x(i,1),x(i,2),'*')2. global x;global y;global k;y=1;x=1;p=plot(x,y,'.','EraseMode','none','MarkerSize',3); axis([0 2 -2 2])hold onfor x=1:200for k=1:500y=1-x*y*y/100; set(p,'Xdata',x/100,'Ydata',y);drawnowset(p,'Xdata',x/100,'Ydata',y);drawnowend由于使用的是动画画图,所以只能使用屏幕截图保存,若此时点击窗口,已经画出的点会全部消失。
当然,将命令改用打点画图的话就可以点击窗口保存。
说明:Xn+1=1-k*Xn*Xn图形表示的是:对于0到2之间的一个k值,任给X一个初值,经过上式迭代循环500次之后,得到的X的值与k的关系图。

![matlab画图大全[资料]](https://uimg.taocdn.com/0e578e91bdeb19e8b8f67c1cfad6195f312be8c8.webp)
matlab绘图大全Matlab绘图系列之高级绘图一、目录1.彗星图二维彗星图三维彗星图2.帧动画3.程序动画4.色图变换5.Voronoi图和三角剖分Voronoi图三角剖分6.四面体7.彩带图彩带图三维流彩带图8.伪彩图9.切片图切片图切片轮廓线图10.轮廓图显示轮廓线显示围裙瀑布效果带光照模式的阴影图11.函数绘图轮廓线、网格图、曲面图、轮廓网格图轮廓曲面图、二维曲线、极坐标曲线图、自定义函数12.三维图形控制视点灯光效果色彩控制二、图形示例1.彗星图二维彗星图t=0:.01:2*pi;x=cos(2*t).*(cos(t).^2);y=sin(2*t).*(sin(t).^2);comet(x,y);title('二维彗星轨迹图')hold onplot(x,y)三维彗星图a=12;b=9;T0=2*pi;%T0是轨道的周期T=5*T0;dt=pi/100;t=[0:dt:T]';f=sqrt(a^2-b^2);%地球与另一焦点的距离th=12.5*pi/180;%未经轨道与x-y平面的倾角E=exp(-t/20);%轨道收缩率x=E.*(a*cos(t)-f);y=E.*(b*cos(th)*sin(t));z=E.*(b*sin(th)*sin(t));plot3(x,y,z,'g')%画全程轨线hold on,sphere(20);%画地球axis offtitle('卫星返回地球示例')x1=-18*T0;x2=6*T0;y1=-12*T0;y2=12*T0;z1=-6*T0;z2=6*T0;axis([x1 x2 y1 y2 z1 z2])% axis([-15 10 -15 10 -10 10])axis equalcomet3(x,y,z,0.02);%画运动轨线hold off2.帧动画Z=peaks;surf(Z)%绘制网格表面图axis tightset(gca,'nextplot','replacechildren');%设定axis覆盖重画模式title('帧动画播放示例')for j=1:20surf(sin(2*pi*j/20)*Z,Z)%重新绘制网格表面图,这里后面一个Z当成了颜色矩阵F(j)=getframe;%创建帧endmovie(F,20)%播放动画20次3.程序动画t=0:pi/50:10*pii=1;h=plot3(sin(t(i)),cos(t(i)),t(i),'*','erasemode','none');%设定擦除模式grid onaxis([-2 2 -2 2 -1 10*pi])title('程序动画示例')for i=2:length(t)set(h,'xdata',sin(t(i)),'ydata',cos(t(i)),'zdata',t(i));drawnowpause(0.01)end4.色图变换load spineimage(X)colormap coolspinmap(10)5.Voronoi图和三角剖分Voronoi图rand('state',5)x=rand(1,10);y=rand(1,10);subplot(131)voronoi(x,y);%绘制voronoi图形axis equalaxis([-0.2 1.6 -0.5 2.5])subplot(132)[vx,vy]=voronoi(x,y);plot(x,y,'r+',vx,vy,'b-');%应用返回值绘制axis equalaxis([-0.2 1.6 -0.5 2.5])subplot(133)rand('state',5);x=rand(10,2);[v,c]=voronoin(x);%返回值v参数维voronoi顶点矩阵,返回值c 参数为voronoi元胞数组for i=1:length(c)if all(c{i}~=1)patch(v(c{i},1),v(c{i},2),i);%应用色图iendendaxis equalaxis([-0.2 1.6 -0.5 2.5])box on三角剖分[x,y]=meshgrid(1:15,1:15);tri=delaunay(x,y);z=peaks(15);trimesh(tri,x,y,z)6.四面体d=[-1 1];[x,y,z]=meshgrid(d,d,d);%定义一个立方体x=[x(:);0];y=[y(:);0];z=[z(:);0];%[x,y,z]分别为加上中心的立方体顶点X=[x(:) y(:) z(:)];Tes=delaunayn(X);%返回m×n的数组值tetramesh(Tes,X);%绘制四面体图camorbit(20,0);%旋转摄像目标位置7.彩带图彩带图[x,y]=meshgrid(-3:.5:3,-3:.1:3);z=peaks(x,y);ribbon(y,z)三维流彩带图load wind%打开保存的数据lims=[100.64 116.67 17.25 28.75 -0.02 6.86];%定义坐标轴范围[x,y,z,u,v,w]=subvolume(x,y,z,u,v,w,lims);%lims来定义数据子集[sx sy sz]=meshgrid(110,20:5:30,1:5);%定义网格点verts=stream3(x,y,z,u,v,w,sx,sy,sz,.5);%计算彩带顶点cav=curl(x,y,z,u,v,w);%计算卷曲角速度wind_speed=sqrt(u.^2+v.^2+w.^2);%计算流速h=streamribbon(verts,x,y,z,cav,wind_speed,2);%绘制流彩带图view(3)8.伪彩图n=6%定义轮数r=(0:n)'/n;%定义轮的半径theta=pi*(-n:n)/n;%定义轮的扇区角X=r*cos(theta);Y=r*sin(theta);%定义网格顶点C=r*cos(2*theta);%定义色图pcolor(X,Y,C)%绘制伪彩图axis equal tight9.切片图切片图[x,y,z] = meshgrid(-2:.2:2,-2:.25:2,-2:.16:2);v = x.*exp(-x.^2-y.^2-z.^2);xslice = [-1.2,.8,2]; yslice = 2; zslice = [-2,0];slice(x,y,z,v,xslice,yslice,zslice)colormap hsv切片轮廓线图[x y z v]=flow;%打开水流数据h=contourslice(x,y,z,v,[1:9],[],[0],linspace(-8,2,10));%切片轮廓线view([-12 30])10.轮廓图显示轮廓线[x,y,z]=peaks;subplot(1,2,1)meshc(x,y,z);%同时画出网格图与轮廓线title('meshc 网格图与轮廓线')axis([-inf inf -inf inf -inf inf]);subplot(1,2,2)surfc(x,y,z);%同时画出曲面图与轮廓线title('surfc 曲面图与轮廓线')axis([-inf inf -inf inf -inf inf]);显示围裙[x y z]=peaks;meshz(x,y,z);瀑布效果[X,Y,Z]=peaks(30);waterfall(X,Y,Z)带光照模式的阴影图[x,y]=meshgrid(-3:1/8:3);z=peaks(x,y);surfl(x,y,z);shading interp%着色处理colormap(gray);%灰度处理axis([-3 3 -3 3 -8 8])11.函数绘图轮廓线、网格图、曲面图、轮廓网格图%图1绘制轮廓线、网格图、曲面图、轮廓网格图subplot(221)f=['3*(1-x)^2*exp(-(x^2)-(y+1)^2)-10*(x/5-x^3-y^5)*exp(-x^2-y^2)-1/3*exp(-(x+1)^2-y^2)'];%定义双变量x、y的函数式ezcontour(f,[-3,3],49)%x、y为[-3 3],网格为49×49subplot(222)ezmesh('sqrt(x^2+y^2)');subplot(223)ezsurf('real(atan(x+i*y))')%经过滤波,如果相同数据surf绘图没有滤波subplot(224)ezmeshc('y/(1+x^2+y^2)',[-5,5,-2*pi,2*pi])%x、y的数值范围分别为[-5 5]、[-2*pi 2*pi]轮廓曲面图、二维曲线、极坐标曲线图、自定义函数%图2绘制轮廓曲面图、二维曲线、极坐标曲线图、自定义函数figure(2)subplot(221)ezsurfc('sin(u)*sin(v)')subplot(222)ezplot('x^2-y^4');subplot(223)ezpolar('1+cos(t)')subplot(224)fplot('myfun',[-20 20])function Y=myfun(x)Y(:,1)=200*sin(x(:))./x(:);Y(:,2)=x(:).^2;三维曲线图%绘制三维曲线图figure(3)ezplot3('sin(t)','cos(t)','t',[0,6*pi])12.三维图形控制视点View图形旋转subplot(121)surf(peaks);title('旋转前图形');subplot(122)h=surf(peaks);rotate(h,[1 0 1],180)title('旋转后图形');灯光效果%灯光效果(1)camlight(2)light(3)lightangle(4)lighting(5)materialsphere;camlight色彩控制%色彩控制(1)缺省设置colordef、whitebg(2)色图colormap(3)浓淡处理shadingload flujetimage(X)colormap(jet)subplot(131)sphere(16)axis squareshading flattitle('Flat Shading')subplot(132)sphere(16)axis squareshading facetedtitle('Faceted Shading') subplot(133)sphere(16)axis squareshading interptitle('Interpolated Shading')。

MATLAB绘图二维数据曲线图pplot函数的基本调用格式为:x,y) )plot(plot(x,y其中x和y为长度相同的向量,分别用于存储x坐标和y坐标数据。
数据例1 在0≤x2π区间内,绘制曲线y=2e-0.5x cos(4πx)1≤区间内绘制曲线205x(4)程序如下:x=0:pi/100:2*pi;cos(4*pi*x);0.5*x).*cos(4*pi*x);y=2*exp(--0.5*x).*y=2*exp(x,y))plot(x,yplot(x yplot(x y)例2 绘制曲线。
绘制曲线程序如下:t=0:0.1:2*pi;x=t.sin(3t);x=t*sin(3*t);y=t.*sin(t).*sin(t); plot(x,y););plot(x,y数最简单的调用格式是包含个输参数plot函数最简单的调用格式是只包含一个输入参数:p()plot(x)在这种情况下,当x是实向量时,以该向量元素的下标为横坐标,元素值为纵坐标画出条连续曲线,标为横坐标,元素值为纵坐标画出一条连续曲线,这实际上是绘制折线图。
绘制多根二维曲线1.plot函数的输入参数是矩阵形式时数的输参数是矩阵形式时(1) 当x是向量,y是有一维与x同维的矩阵时,则绘制出多根不同颜色的曲线。
曲线条数等于y矩阵的另一维数,x被作为这些曲线共同的横坐标。
(2) 当x,y是同维矩阵时,则以x,y对应列元素为横、纵坐标分别绘制曲线,曲线条数等于矩阵的列数。
纵坐标分别绘制曲线曲线条数等于矩阵的列数(3) 对只包含一个输入参数的plot函数,当输入参数对包含个输参数的数当输参数是实矩阵时,则按列绘制每列元素值相对其下标的曲线曲线条数等于输入参数矩阵的列数的曲线,曲线条数等于输入参数矩阵的列数。
当输入参数是复数矩阵时,则按列分别以元素实部和虚部为横、纵坐标绘制多条曲线。
2.含多个输入参数的plot函数含多个输参数的数调用格式为:plot(x1,y1,x2,y2,…,xn,yn)(1) 当输入参数都为向量时,x1和y1,x2和y2,…,(1)当输入参数都为向量时xn和yn分别组成一组向量对,每一组向量对的长度可以不同每一向量对可以绘制出一条曲线度可以不同。
MATLAB中的绘图函数介绍概述:MATLAB是一种非常强大的数值计算和科学绘图软件,在各个领域中都得到广泛的应用。
在MATLAB中,绘图函数是其中一个非常重要的功能,它可以帮助我们将数据可视化,并进行分析和解释。
在本文中,我们将详细介绍一些常用的MATLAB绘图函数及其功能。
一、plot函数:plot函数是MATLAB中最基本的绘图函数之一,它可以绘制线性图。
通过将一系列的点连接起来,我们可以绘制出数据的变化趋势。
下面是plot函数的一个简单示例:```matlabx = 0:0.1:10;y = sin(x);plot(x, y);```在这个例子中,我们首先定义了x的取值范围为0到10,间隔为0.1。
然后通过使用sin函数计算出对应的y值。
最后,调用plot函数将x和y的数值传入,即可得到一条关于sin函数的图形。
除了基本的线性图,plot函数还可以绘制不同颜色和线型的曲线,并添加标题、标签等。
它是进行简单数据可视化的利器。
二、scatter函数:相比于plot函数,scatter函数可以绘制散点图,用于展示多个不同数据点之间的分布关系。
通过scatter函数,我们可以方便地比较不同变量之间的相关性。
以下是scatter函数的一个示例:```matlabx = randn(100,1);y = 0.5*x + randn(100,1);scatter(x, y);```在这个例子中,我们首先生成了两组随机数x和y。
然后使用scatter函数将它们绘制成散点图。
通过观察散点图的分布,我们可以判断出x和y之间是否存在线性相关性。
scatter函数还支持设置散点的颜色、大小和透明度等参数,以满足不同的需求。
它是进行多变量分析的重要工具之一。
三、bar函数:bar函数可以用于绘制柱状图,常用于展示各个类别的数据之间的差异。
通过柱状图,我们可以清晰地比较不同类别之间的数值大小。
以下是bar函数的一个示例:```matlabx = categorical({'A', 'B', 'C', 'D'});y = [10, 15, 8, 12];bar(x, y);```在这个例子中,我们首先定义了四个类别,分别是'A'、'B'、'C'和'D'。

绘图的指令1、plot函数MATLAB中最常用的绘图函数是plot( )。
其基本调用格式为:plot(x, y ),其中x, y均为向量,该函数表示以x向量作为X轴,以y向量作为Y轴。
示例3:绘制从0 ~ 4范围的正弦函数曲线。
t = 0 : pi/20 : 4*pi;y = sin(t);plot(t, y);2、stem函数对于离散序列,MATLAB用stem( )命令实现其绘制。
示例4:绘制从0 ~ 4范围的正弦函数序列。
t = 0 : pi/10 : 4*pi;y = sin(t);stem(t, y);3、subplot函数如果要在一个绘图窗口中显示多个图形,可用subplot函数实现。
其基本调用格式为:subplot(m, n, k) 或subplot(m n k),其中m, n, k取值为1 ~ 9。
该函数表示将绘图窗口划分为m×n个子窗口(子图),并在第k个子窗口中绘图。
示例5:在一个绘图窗口中绘制下列函数的图形。
t = 0 : 0.1 : 2;y1 = 2*exp(-3*t); % (a) 指数函数figure;subplot(221);plot(t,y1);xlabel('(a)');y2 = 2*t.*exp(-3*t); % (b) t乘指数函数subplot(222);plot(t,y2);xlabel('(b)');t1 = -4 : 0.1 : 4;y3 = 1/(2^0.5)*exp(-0.5*t1.^2); % (c) 正态分布函数subplot(223);plot(t1,y3);xlabel('(c)');t2 = -5 : 0.1 : 5;y4 = sinc(t2); % (d) 取样函数subplot(224);plot(t2,y4);xlabel('(d)');ylabel('sinc(t)');axis([-5 5 -0.25 1.1])grid on二维图形的修饰1、坐标轴名称标识函数xlabel、ylabel、title绘制 的nyquist 图和bode 图102.110)(2++=s s s G解MATLAB编程如下:»num=[10];»den=[1,1.2,10];»w=logspace(-2,2,1000); » nyquist(num,den,w)»grid»bode(num,den,w)»grid极小化»fx='10*exp(-x)*cos(x)';»fplot(fx,[2,5])»xmin=fmin(fx,2,5)xmin =2.35619746669214求零点»xzero=fzero(fx,5)xzero =4.71238898038469»xzero=fzero(fx,2)xzero =1.57079632679490曲线拟合»x=0:0.1:1;»y=[-.447 1.978 3.28 6.16 7.08 7.34 7.66 9.56 9.48 9.30 11.2];»p=polyfit(x,y,2);»xi=0:0.01:1;»yi=polyval(p,xi);»plot(x,y,xi,yi) 三维图形»x=-4:0.1:4;»y=x;»[x,y]=meshgrid(x,y);»z = 3*(1-x).^2.*exp(-(x.^2) - (y+1).^2) ...- 10*(x/5 - x.^3 - y.^5).*exp(-x.^2-y.^2) ...- 1/3*exp(-(x+1).^2 - y.^2);»mesh(x,y,z)二维图形»x=0:0.01:pi*3;»y=sin(x);»plot(x,y)»title('First Figure Example')»xlabel('Time(s)')»ylabel('Value(v)')»grid on»gtext(‘sinx’)»legend(‘sinx’)管理命令和函数help 在线帮助文件doc 装入超文本说明what M、MA T、MEX文件的目录列表 type 列出M文件lookfor 通过help条目搜索关键字which 定位函数和文件Demo 运行演示程序Path 控制MATLAB的搜索路径管理变量和工作空间Who 列出当前变量Whos 列出当前变量(长表) Load 从磁盘文件中恢复变量 Save 保存工作空间变量Clear 从内存中清除变量和函数Pack 整理工作空间内存Size 矩阵的尺寸Length 向量的长度disp 显示矩阵或与文件和*作系统有关的命令cd 改变当前工作目录Dir 目录列表Delete 删除文件Getenv 获取环境变量值! 执行DOS*作系统命令Unix 执行UNIX*作系统命令并返回结果Diary 保存MA TLAB任务控制命令窗口Cedit 设置命令行编辑 Clc 清命令窗口Home 光标置左上角Format 设置输出格式Echo 底稿文件内使用的回显命令more 在命令窗口中控制分页输出启动和退出MA TLABQuit 退出MATLABStartup 引用MA TLAB时所执行的M文件Matlabrc 主启动M文件*作符和特殊字符+ 加—减* 矩阵乘法.* 数组乘法^ 矩阵幂.^ 数组幂\ 左除或反斜杠/ 右除或斜杠./ 数组除Kron Kronecker张量积: 冒号( ) 圆括号[ ] 方括号. 小数点.. 父目录…继续, 逗号; 分号% 注释! 感叹号‘转置或引用= 赋值= = 相等< > 关系*作符& 逻辑与| 逻辑或~ 逻辑非xor 逻辑异或逻辑函数Exist 检查变量或函数是否存在Any 向量的任一元为真,则其值为真All 向量的所有元为真,则其值为真Find 找出非零元素的索引号三角函数Sin 正弦Sinh 双曲正弦Asin 反正弦Asinh 反双曲正弦Cos 余弦Cosh 双曲余弦Acos 反余弦Acosh 反双曲余弦Tan 正切Tanh 双曲正切Atan 反正切Atan2 四象限反正切Atanh 反双曲正切Sec 正割Sech 双曲正割Asech 反双曲正割Csc 余割Csch 双曲余割Acsc 反余割Acsch 反双曲余割Cot 余切Coth 双曲余切Acot 反余切Acoth 反双曲余切指数函数Exp 指数Log 自然对数Log10 常用对数Sqrt 平方根复数函数Abs 绝对值Argle 相角Conj 复共轭Image 复数虚部Real 复数实部特殊变量和常数Ans 当前的答案Eps 相对浮点精度Realmax 最大浮点数Realmin 最小浮点数Pi 圆周率I,j 虚数单位Inf 无穷大Nan 非数值Flops 浮点运算次数Nargin 函数输入变量数Nargout 函数输出变量数基本X—Y图形Plot 线性图形Loglog 对数坐标图形Semilogx半对数坐标图形(X轴为对数坐标) Semilogy 半对数坐标图形(Y轴为对数坐标) Fill 绘制二维多边形填充图特殊X—Y图形Polar 极坐标图Bar 条形图Stem 离散序列图或杆图Stairs 阶梯图Errorbar 误差条图Hist 直方图Rose 角度直方图Compass 区域图Feather 箭头图Fplot 绘图函数Comet 星点图图形注释Title 图形标题Xlabel X轴标记Ylabel Y轴标记Text 文本注释Gtext 用鼠标放置文本Grid 网格线MATLAB不但擅长於矩阵相关的数值运算,也适合用在各种科学目视表示(Scientific visualization)。
第四讲MATLAB 绘图为了使数据可视化,基本步骤是:1、准备好数据;2、选择适用的绘制图形函数;3、选择窗口和位置;4、编辑图形标注和说明;5、输出或保存。
表数据可视化的常用命令函数名说明plot 二维线性图plotyy 二维双纵坐标图loglog 双对数坐标平面图semilogx 半对数坐标平面图axis 控制坐标轴刻度及坐标范围axes 在任意位置建立坐标figure 建立图形窗口subplot 建立图形的平铺位置hold on 图形保持grid on 图形中添加栅格线axis equal 设置坐标轴纵、横比率相等axis square 设置当前纵坐标、横坐标为正方形bar 条形图area 面积图pie 饼图hist 直方图rose 极坐标柱状图stem 茎干图stair 阶梯图feather 羽毛图quiver 箭形图plot3 三维线性图bar3 三维条形图area3 三维面积图pie3 三维饼图contour 等高线图mesh 三维网格图surf 三维曲面图一、线性图函数plot1、线性图是绘制数据图形的基础,所以线性图函数plot 在MATLAB 中用得最广。
它可以用来绘制散点图、序列图、向量图、矩阵图和函数图等。
它可以设置线的类型(LineStyle),如实线、虚线、双点线、点划线,可以改变线的颜色(color)和线的宽度(LineWidth),也可以设置线图上的标记(marker)。
还可以对图面进行标注,如增加标题、图例、坐标、文字标注等,使图形的内容更加丰富。
2、plot 函数的书写格式有:plot(Y)plot(X,Y)plot(X1,Y1,LineStyle,X2,Y2,…)plot(…,’PropertyName’,PropertyValue,…)h=plot(…)(1)若Y 的元素值为实数,则plot(Y)绘制以向量Y 元素值为纵坐标,它的下标值为横坐标的线性图。
若Y 的元素值为复数,则以实数为横坐标,虚数为纵坐标绘制线性图。
MATLAB中绘图命令介绍本节将介绍MATLAB基本xy平面及xyz空间的各项绘图命令,包含一维曲线及二维曲面的绘制。
plot是绘制一维曲线的基本函数,但在使用此函数之前,我们需先定义曲线上每一点的x 及y座标。
下例可画出一条正弦曲线:close all;x=linspace(0, 2*pi, 100); % 100个点的x坐标y=sin(x); % 对应的y坐标plot(x,y);小整理:MATLAB基本绘图函数plot: x轴与y轴均为线性刻度(Linear scale)loglog: x轴与y轴均为对数刻度(Logarithmic scale)semilogx: x轴为对数刻度,y轴为线性刻度semilogy: x轴为线性刻度,y轴为对数刻度若要画出多条曲线,只需将座标对依次放入plot函数即可:hold on 保持当前图形,以便继续画图到当前坐标窗口hold off 释放当前图形窗口title(’图形名称’)(都放在单引号内)xlabel(’x轴说明’)ylabel(’y轴说明’)text(x,y,’图形说明’)legend(’图例1’,’图例2’,…)plot(x, sin(x), x, cos(x));若要改变颜色,在座标对後面加上相关字串即可:plot(x, sin(x), 'c', x, cos(x), 'g');若要同时改变颜色及图线型态,也是在座标对後面加上相关字串即可:plot(x, sin(x), 'co', x, cos(x), 'g*');小整理:plot绘图函数的叁数字元、颜色元、图线型态,y 黄色 .点k 黑色o 圆w 白色x xb 蓝色++g 绿色* *r 红色- 实线c 亮青色: 点线m锰紫色-. 点虚线-- 虚线plot3 三维曲线作图图形完成后,我们可用axis([xmin,xmax,ymin,ymax])函数来调整图轴的范围: axis([0, 6, -1.2, 1.2]);axis函数的功能丰富,其常用的用法有:axis equal :纵横坐标轴采用等长刻度axis square:产生正方形坐标系(默认为矩形)axis auto:使用默认设置axis off:取消坐标轴axis on :显示坐标轴此外,MATLAB也可对图形加上各种注解与处理:xlabel('Input Value'); % x轴注解ylabel('Function Value'); % y轴注解title('Two Trigonometric Functions'); % 图形标题legend('y = sin(x)','y = cos(x)'); % 图形注解grid on; % 显示格线我们可用subplot来同时画出数个小图形於同一个视窗之中:subplot(2,2,1); plot(x, sin(x));subplot(2,2,2); plot(x, cos(x));subplot(2,2,3); plot(x, sinh(x));subplot(2,2,4); plot(x, cosh(x));MATLAB还有其他各种二维绘图函数,以适合不同的应用,详见下表。
Matlab绘制三维图形三维曲线plot3函数与plot函数用法十分相似,其调用格式为:plot3(x1,y1,z1,选项1,x2,y2,z2,选项2,…,xn,yn,zn,选项n)其中每一组x,y,z组成一组曲线的坐标参数,选项的定义和plot函数相同。
当x,y,z是同维向量时,则x,y,z 对应元素构成一条三维曲线。
当x,y,z是同维矩阵时,则以x,y,z对应列元素绘制三维曲线,曲线条数等于矩阵列数。
例绘制三维曲线。
程序如下:t=0:pi/100:20*pi;x=sin(t);y=cos(t);z=t.*sin(t).*cos(t);plot3(x,y,z);title('Line in 3-D Space');xlabel('X');ylabel('Y');zlabel('Z');三维曲面1.产生三维数据在MATLAB中,利用meshgrid函数产生平面区域内的网格坐标矩阵。
其格式为:x=a:d1:b; y=c:d2:d;[X,Y]=meshgrid(x,y);语句执行后,矩阵X的每一行都是向量x,行数等于向量y的元素的个数,矩阵Y的每一列都是向量y,列数等于向量x的元素的个数。
2.绘制三维曲面的函数surf函数和mesh函数的调用格式为:mesh(x,y,z,c):画网格曲面,将数据点在空间中描出,并连成网格。
surf(x,y,z,c):画完整曲面,将数据点所表示曲面画出。
一般情况下,x,y,z是维数相同的矩阵。
x,y是网格坐标矩阵,z是网格点上的高度矩阵,c 用于指定在不同高度下的颜色范围。
例绘制三维曲面图z=sin(x+sin(y))-x/10。
程序如下:[x,y]=meshgrid(0:0.25:4*pi); %在[0,4pi]×[0,4pi]区域生成网格坐标z=sin(x+sin(y))-x/10;mesh(x,y,z);axis([0 4*pi 0 4*pi -2.5 1]);此外,还有带等高线的三维网格曲面函数meshc和带底座的三维网格曲面函数meshz。
fplot(inline('x^3-x-1'),[-1,2]);hold on;x=-1:0.2:2;y=abs(x).^0.2.*sin(5*x);plot(x,y,':ro');hold off;8. 绘图命令①二维图形二维绘图的基本命令有plot,loglog,semilogx,semilogy和polar。
它们的使用方法基本相同,其不同特点是在不同的坐标中绘制图形。
plot命令使用线性坐标空间绘制图形;loglog命令在两个对数坐标空间中绘制图形;而semilogx(或semilogy)命令使用x轴(或y轴)为对数刻度,另外一个轴为线性刻度的坐标空间绘制图形;polar使用极坐标空间绘制图形。
二维绘图命令plot为了适应各种绘图需要,提供了用于控制线色、数据点和线型的3组基本参数。
它的使用格式如下:plot(x,y,’color_point_linestyle’)该命令是绘制y对应x的轨迹的命令。
y与x均为向量,且具有相同的元素个数。
用字符串‘color_point_linestyle’完成对上面3个参数的设置。
线色(r-red,g-green,b-blue,w-white,k-black,i-invisible,y-yellow),数据点(.,o,x,+,*,S,H,D,V,^,>,<,p)与线型(-,-.,--,:)都可以根据需要适当选择。
当plot(x,y)中的x和y均为nm 矩阵时,plot命令将绘得n条曲线。
plot(t,[x1,x2,x3])在同一坐标轴内同时绘制三条曲线。
如果多重曲线对应不同的向量绘制,可使用命令plot(t1,x1,t2,x2,t3,x3)式中x1对应t1,x2对应t2等等。
在这种情况下,t1,t2和t3可以具有不同的元素个数,但要求x1,,x2和x3必须分别与t1,t2和t3具有相同的元素数量。
subplot 命令使得在一个屏幕上可以分开显示n个不同坐标系,且可分别在每一个坐标系中绘制曲线。
常见的MATLAB绘图程序y=[3,7,9,1,5,2,8];subplot(1,2,1),plot(y,'linewidth',2),gridx=[3,3,9;8,1,2;1,8,5;7,9,1];subplot(1,2,2),plot(x),xlabel('x'),ylabel('y') grid on%极坐标曲线theta=0:0.1:8*pi;polar(theta,cos(4*theta)+1/4)%对数坐标x=0:0.1:2*pi;y=sin(x);semilogx(x,y);grid on%各种坐标系中theta=0:0.1:6*pi;r=cos(theta/3)+1/9;subplot(2,2,1),polar(theta,r);subplot(2,2,2),plot(theta,r);subplot(2,3,4),semilogx(theta,r);subplot(2,3,5),semilogy(theta,r);subplot(2,3,6),loglog(theta,r);grid on%双y轴图形x=0:0.01:5;y=exp(x);plotyy(x,y,x,y,'semilogy','plot'),gridgrid on%复数数据t=0:0.1:2*pi;x=sin(t);y=cos(t);z=x+i*y;plot(t,z),gridplot(z)grid on%二维图形处理x=(0:0.1:2*pi)';y1=2*exp(-0.5*x)*[1,-1];y2=2*exp(-0.5*x).*sin(2*pi*x);x1=(0:12)/2;y3=2*exp(-0.5*x1).*sin(2*pi*x1);plot(x,y1,'g:',x,y2,'b--',x1,y3,'rp');title('曲线及其包络线');xlabel('变量X');ylabel('变量Y');text(3.2,0.5,'包络线');text(0.5,0.5,'曲线y');text(1.4,0.15,'离散数据点');legend('包络线','包络线','曲线y','离散数据点') clc%坐标控制x=(0:0.1:2*pi)';y1=2*exp(-0.5*x)*[1,-1];y2=2*exp(-0.5*x).*sin(2*pi*x);x1=(0:12)/2;y3=2*exp(-0.5*x1).*sin(2*pi*x1);plot(x,y1,'g:',x,y2,'b--',x1,y3,'rp');plot(x,y1,'g:');hold on;plot(x,y2,'b--');plot(x1,y3,'rp');grid on;box off;hold off;%图形窗口的分割t=(0:10:360)*pi/180;y=sin(t);subplot(2,1,1),plot(t,y);subplot(2,2,3),stem(t,y);subplot(2,2,4),polar(t,y);y2=cos(t);y3=y2.*y2;plot(t,y,'-or',t,y2,'-h',t,y3,'-xb');xlabel('时间');ylabel('幅值');axis([-1,8,-1.2,1.2]);%图形设置t=linspace(0,2*pi,60);y1=sin(t);y2=cos(t);y3=y1.*y2;h=figure(1);stairs(t,y1);h1=axes('pos',[0.2,0.2,0.6,0.4]);plot(t,y1);h2=axes('pos',[0.1,0.1,0.8,0.1]);stem(t,y1);h3=axes('pos',[0.5,0.5,0.4,0.4]);fill(t,y1,'g');h4=axes('pos',[0.1,0.6,0.3,0.3]);plot(t,y1,'-',t,y2,':',t,y3,'o'); %在图形中任意绘制坐标系set(h4,'pos',[0.1,0.1,0.4,0.4]);set(h,'pos',[0,0,560,400]);set(h3,'box','off');set(h3,'xgrid','on');set(h3,'gridlinestyle','-');set(h3,'xdir','reverse');set(h3,'xdir','normal');ht3=get(h3,'title');set(ht3,'string','澳洲人的回旋镖');set(ht3,'rotation',-10);set(ht3,'color',[244 29 249]/255);%三维曲线图t=-pi:pi/200:8*pi;h=figure(1);set(h,'color',[1,1,1]);subplot(1,2,1),plot3(cos(t),sin(t),t,'b-');subplot(1,2,2),plot3(sin(t),cos(t),t,':');%三维网格图[x,y]=meshgrid(-8:0.5:8,-10:0.5:10);R=sqrt(x.^2+y.^2)+eps;z=sin(R)./R;mesh(x,y,z);hidden off%三维曲面%绘制标准球面图subplot(2,2,1),sphere(4);title('n=4'),axis equal;subplot(2,2,2),sphere(6);title('n=6'),axis equal;subplot(2,2,3),sphere(20);title('n=20'),axis equal;subplot(2,2,4),sphere(50);title('n=50'),axis equal;%标准柱面图t=linspace(pi/2,3.5*pi,50);R=cos(t)+2;subplot(2,2,1),cylinder(R,3),title('n=3');subplot(2,2,2),cylinder(R,6),title('n=6');subplot(2,2,3),cylinder(R,20),title('n=20');subplot(2,2,4),cylinder(R,50),title('n=50');%图形的平滑[x,y]=meshgrid(-8:0.5:8,-10:0.5:10);R=sqrt(x.^2+y.^2)+eps;z=sin(R)./R;surf(x,y,z);colorbar;shading flatshading interp[x,y]=meshgrid(-8:0.5:8,-10:0.5:10);R=sqrt(x.^2+y.^2)+eps;z=sin(R)./R;surfc(x,y,z);colorbar;[x,y]=meshgrid(-8:0.5:8,-10:0.5:10);R=sqrt(x.^2+y.^2)+eps;z=sin(R)./R;surfl(x,y,z);colorbar;%专用图形%条形图Y=[3,8,2;8,9,2;8,3,3;2,5,6;9,5,1];subplot(1,2,1),bar(Y),title('二维条形图');subplot(1,2,2),bar3(Y),title('三维条形图');%直方图y1=randn(10000,1);y2=rand(10000,1);subplot(1,2,1);hist(y1,20);title('正态分布');subplot(1,2,2);hist(y2,10);title('均匀分布');theta=randn(1000,1);theta=pi*theta/max(theta);rose(theta);%饼形图%二维饼形图cj=[80,95,70,40];pie(cj,[0,0,1,0]);%三维饼形图cj=[80,95,70,40];pie3(cj,[0,0,1,0],{'语文28%','数学33%','外语25%','政治14%'}); %离散数据图x=linspace(0,2*pi,40);a=sin(2*x);b=cos(x);stem(x,a+b);hold on;plot(x,a);hold on;plot(x,b);hold on;%三维离散数据图th=(0:127)/128*2*pi;x=th.*cos(th);y=th.*sin(th);stem3(x,y,th,'fill');view([-158 66]);xlabel('X轴');ylabel('Y轴');zlabel('Z轴');title('三维火柴杆图');hold on;plot3(x,y,th,'k');hold on;%阶梯图alpha=0.01;beta=0.5;t=0:10;f=exp(-alpha*t).*sin(2*beta*t);stairs(t,f);hold on;plot(t,f,'--*');hold off;label='函数e^{-(\alpha*t)}sin2\beta*t的阶梯图'; text(0.5,0.2,label,'FontSize',12);xlabel('t=0:10','FontSize',14);axis([0,10,-1.2,1.2]);%等高线图[x,y,z]=peaks;contour(x,y,z,15);%三维等高图[x,y,z]=peaks;contour3(x,y,z,20);colormap(hsv)%瀑布图waterfall(peaks);axis tight;。