2013年考研英语二图表作文终极预测15篇
- 格式:doc
- 大小:1.30 MB
- 文档页数:8

2013年考研英语二作文范文Nowadays, environmental protection is a global concern. More and more people realize the importance of achieving sustainable development and protecting the earth we rely on. However, not everyone takes action to contribute to environmental protection, and some even ignore or deny the fact that environmental problems exist.To address this issue, governments and organizations should take the lead in promoting environmental awareness and implementing policies to protect the environment. For example, governments can impose regulations and taxes on industries that pollute the environment or consume excessive resources. Organizations can also educate their employees and customers on environmentally-friendly practices, such as reducing waste and adopting renewable energy sources.Individuals also have a responsibility to protect the environment. We can start by making small changes in our daily lives, such as reducing plastic usage, conserving water, and properly disposing of electronic waste. We can also support environmentally-friendly businesses andproducts, and speak out against environmental issues to raise awareness.In addition, international cooperation is crucial in addressing global environmental challenges such as climate change and biodiversity loss. Countries should work together to establish global environmental standards and agreements, and provide support to developing countries in their efforts to protect the environment and achieve sustainable development.In conclusion, environmental protection is the responsibility of everyone, including governments, organizations, and individuals. By taking action to protect the environment, we can ensure a sustainable future for ourselves and for generations to come.如今,环境保护是全球关注的焦点。
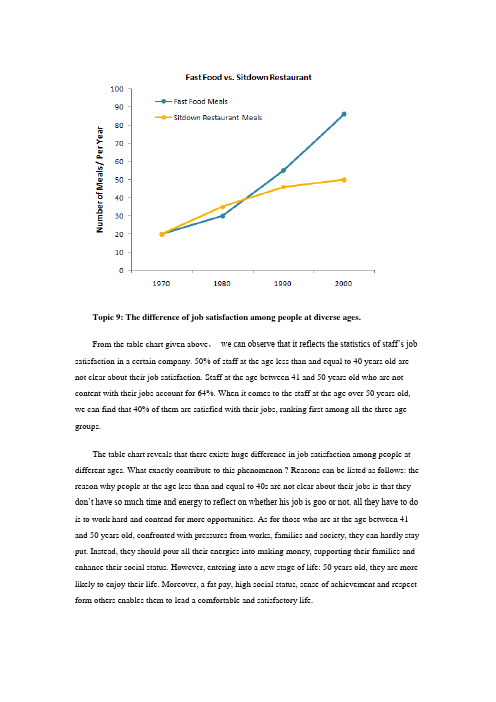
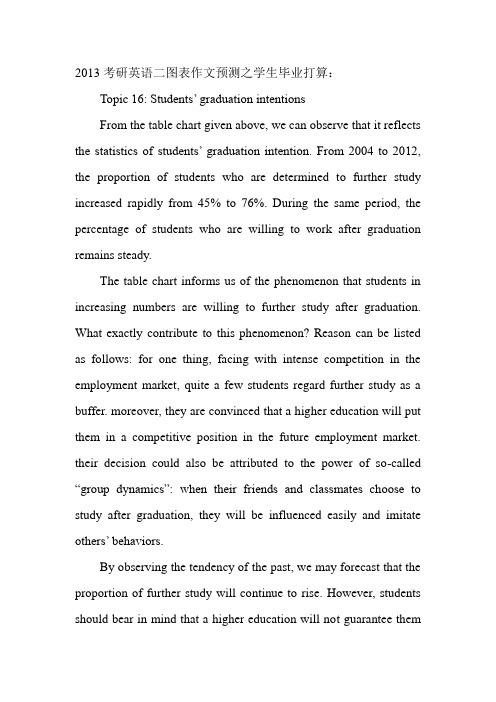
Topic 9: The difference of job satisfaction among people at diverse ages.From the table chart given above,we can observe that it reflects the statistics of staff’s job satisfaction in a certain company. 50% of staff at the age less than and equal to 40 years old are not clear about their job satisfaction. Staff at the age between 41 and 50 years old who are not content with their jobs account for 64%. When it comes to the staff at the age over 50 years old, we can find that 40% of them are satisfied with their jobs, ranking first among all the three age groups.The table chart reveals that there exists huge difference in job satisfaction among people at different ages. What exactly contribute to this phenomenon ? Reasons can be listed as follows: the reason why people at the age less than and equal to 40s are not clear about their jobs is that they don’t have so much time and energy to reflect on whether his job is goo or not, all they have to do is to work hard and contend for more opportunities. As for those who are at the age between 41 and 50 years old, confronted with pressures from works, families and society, they can hardly stay put. Instead, they should pour all their energies into making money, supporting their families and enhance their social status. However, entering into a new stage of life: 50 years old, they are more likely to enjoy their life. Moreover, a fat pay, high social status, sense of achievement and respect form others enables them to lead a comfortable and satisfactory life.As common saying goes, “ it is impossible to please anyone.” In terms of jobs, it also can hardly please any staffs. However, we can do something to change the situation : staffs themselves should adjust their attitude towards jobs. The companies should also enforce some policies to improve staffs’ living standard and enhance the sense of gratification. (325words)Topic 9: The difference of job satisfaction among people at diverse ages.From the table chart given above,we can observe that it reflects the statistics of staff’s job satisfaction in a certain company. 50% of staff at the age less than and equal to 40 years old are not clear about their job satisfaction. Staff at the age between 41 and 50 years old who are not content with their jobs account for 64%. When it comes to the staff at the age over 50 years old, we can find that 40% of them are satisfied with their jobs, ranking first among all the three age groups.The table chart reveals that there exists huge difference in job satisfaction among people at different ages. What exactly contribute to this phenomenon ? Reasons can be listed as follows: the reason why people at the age less than and equal to 40s are not clear about their jobs is that they don’t have so much time and energy to reflect on whether his job is goo or not, all they have to do is to work hard and contend for more opportunities. As for those who are at the age between 41 and 50 years old, confronted with pressures from works, families and society, they can hardly stay put. Instead, they should pour all their energies into making money, supporting their families and enhance their social status. However, entering into a new stage of life: 50 years old, they are more likely to enjoy their life. Moreover, a fat pay, high social status, sense of achievement and respect form others enables them to lead a comfortable and satisfactory life.As common saying goes, “ it is impossible to please anyone.” In terms of jobs, it also can hardly please any staffs. However, we can do something to change the situation : staffs themselves should adjust their attitude towards jobs. The companies should also enforce some policies to improve staffs’ living standard and enhance the sense of gratification. (325words)2Topic 7: The development tendency of fast food and sitdown restaurantFrom the curve chart given above, we can observe that the number meals of fast food and sitdown restaurant experienced some changes during the past several years. The number of meals of fast food increased slowly from 20 in 1970 to nearly 30 in 1980. From 1980 to 2000, it ascended rapidly from 30 to approximately 90. On the contrary, when observing the statistics of sitdown restaurant meals, we can find that it increased slowly from 20 in 1970 to roughly 50 in 2000.The curve chart informs us of the phenomenon that there exists some difference in the development tendency between fast food and sitdown restaurants. What exactly contribute to this phenomenon? Reasons can be listed as follows: for one thing, with the pace of modern life quickening, people barely have much time to waste in lining up for restaurant meals, on the contrary, fast food meals can do help busy people save a great deal of time. Additionally, the authorities have issued some preferential policies to protect and encourage the rapid extension of fast food industry , thus the public can buy fast food at shops scattering around the city. On the contrary , people in diminishing numbers are willing to eat at sitdown restaurant. They think that eating at restaurant is always time-consuming and inconvenient. Besides, food at restaurant is comparatively expensive than fast food.by observing the trend of the past, we may forecast that the number of fast food meals will continue to rise in the years to come. However, we should also take the detrimental impact of fast food into consideration. Do remember that fast food is one of the main causing factors of diseases such as heart attack, obesity and diabetes.3Topic 6: Global E-commerce turnoverFrom the curve chart given above, we can observe that the turnover of global E-commerce experienced some change during the past several years. From 1997 to 2005, it rose dramatically from 20 billion to 900 billion.The curve chart reveals that the global E-commerce industry enjoys an explosive growth. Quite a few reasons can be listed to account for this phenomenon, and the followings might be the most critical ones: for one thing, the authorities of different countries have issued some preferential policies to protect and encourage the development of E-commerce, thus quite a few online-transaction websites emerge overnight. Moreover, the one-click-payment consumption mode has been widely accepted by the public thanks to the widespread availability of the Internet. Last but not least, people’s decision to purchase on-line can also be put down to the power ofso-called “group-dynamics”: when our friends are sho pping at network, we will be influenced by them and imitate their behaviors unconsciously.The rapid development of E-commerce signals that new business models contribute largely to the sustainable development of the global economy. However, when enjoying the fruits offered by modern technology, we should also keep an eye on the underlying threat of it. In a world features open boundary, deception and fraud sometime abound. (209 words )Topic 2: Domestic market share of different car brandsFrom the bar chart given above, we can observe that the market share of different brands in domestic car markets experienced some changes during the past several years. The car market share of Chinese brands increased markedly from 25% in 2008 to roughly 35% in 2009. During the same period , the proportion of Japanese brands decreased sharply by nearly 10% from 35% to 25%. The percentage of American brands remained unchanged at 15% from 2008 to 2009.The bar chart reveals that there exists some difference in the development tendency among different car brands. What exactly contribute to this phenomenon ? Reasons can be listed as follows: for one thing, the Chinese government has issued some preferential policies to protect and promote the rapid extension of domestic automotive industry. Moreover, with the decline of the prices of domestic cars, people in mounting numbers are more inclined to choose them. As for Japanese car brands, its loss of customers can be attributed to the “Recall Crisis” and low price performance ration.To maintain the leading position, Chinese automotive industry should spare no efforts to improve their capabilities of products innovation, service awareness and continue to lower its prices. Only in this way can the car industry enjoy a sustainable development. (208 words)Topic 1: Mobile-phone subscriptionsFrom the bar chart given above, we can observe that mobile-phone subscriptions in developing and developed country experienced some changes during the past several year. The number of mobile-phone subscriptions in developing countries increased dramatically from less than 1 billion in 2000 to 4 billion in 2008. Taking a look at the statistics of mobile-phone subscriptions in developed countries, we can see that it ascended gradually from less than 1 billion in 2000 to the maximum at 1 billion in 2007, and then remained unchanged in 2008.The bar chart reveals that there exists difference in the development of mobile-phone subscriptions between developing and developed countries. What exactly contribute to this phenomenon? Reasons can be listed as follows: the authorities in developing countries have issued some preferential policies to protect and promote the development of the mobile-phone industry. Moreover, with the improvement of financial status and purchasing power, people in mounting numbers can afford to buy mobile-phones which was once deemed expensive. When it comes to developed countries, its slow growth can be best attributed to the market saturation: almost every one has owned mobile-phones, it is no need for them to buy a new one.By observing the trend in developed countries, we may forecast that the mobile-phone subscriptions will not continue to grow rapidly, as developing countries will meet the same problem of “limited grow space”. This is, obviously, the law of the market developmentTopic 1: Mobile-phone subscriptionsFrom the bar chart given above, we can observe that mobile-phone subscriptions in developing and developed country experienced some changes during the past several year. The number of mobile-phone subscriptions in developing countries increased dramatically from less than 1 billion in 2000 to 4 billion in 2008. Taking a look at the statistics of mobile-phone subscriptions in developed countries, we can see that it ascended gradually from less than 1 billion in 2000 to the maximum at 1 billion in 2007, and then remained unchanged in 2008.The bar chart reveals that there exists difference in the development of mobile-phone subscriptions between developing and developed countries. What exactly contribute to this phenomenon? Reasons can be listed as follows: the authorities in developing countries have issued some preferential policies to protect and promote the development of the mobile-phone industry. Moreover, with the improvement of financial status and purchasing power, people in mounting numbers can afford to buy mobile-phones which was once deemed expensive. When it comes to developed countries, its slow growth can be best attributed to the market saturation: almost every one has owned mobile-phones, it is no need for them to buy a new one.By observing the trend in developed countries, we may forecast that the mobile-phone subscriptions will not continue to grow rapidly, as developing countries will meet the same problem of “limited grow space”. This is, obviously, the law of the market development2013考研英语二图表作文预测之学生毕业打算Topic 16: Students’ graduation intentionsFrom the table chart given above, we can observe that it reflects the statistics of students’ graduation intention. From 2004 to 2012, the proportion of students who are determined to further study increased rapidly from 45% to 76%. During the same period, the percentage of students who are willing to work after graduation remains steady.The table chart informs us of the phenomenon that students in increasing numbers are willing to further study after graduation. What exactly contribute to this phenomenon? Reason can be listed as follows: for one thing, facing with intense competition in the employment market, quite a few students regard further study as a buffer. moreover, they are convinced that a higher education will put them in a competitive position in the future employment market. their decision could also be attributed to the power of so-called “group dynamics”: when their friends and classmates choose to study after graduation, they will be influenced easily an d imitate others’ behaviors.By observing the tendency of the past, we may forecast that the proportion of further study will continue to rise. However, students should bear in mind that a higher education will not guarantee them an ideal job. It is capabilities and skills that determine their future. (206words)2013考研英语二图表作文预测之工程硕士招生Topic 13: The enrollments of The master of engineeringFrom the bar chart given above, we can observe that the enrollments of master of engineering experienced some changes during the past several years. From 1998 to 2000, it increased gradually from roughly 2,500 to nearly 5000. However,it rose rapidly from 15,000 in 2001 to approximately 3,5000 in 2004.The bar chart reveals the phenomenon that the enrollments of master of engineering is growing sharply. Many factors can account for this phenomenon, and the followings might be the most critical ones: for one thing , the authorities have issued some policies to promote the development and expansion of engineering industry which includes architecture, electric engineering and so on. Thus, experts , specialists and graduates majoring in this field are needed. Moreover, Quite a few students hold that a master degree of engineering can ensure them to find an ideal an d promising job with ease. Last but not least, students’ decision to pursue a master degree of engineering can also be attributed to the power of “group dynamics”: when members of their social networks take engineering as a college major, they unconsciously imitate and follow the trend.By observing the trend of the past, we may forecast that this tendency will continue. However, A master degree of engineering can not ensure students an ideal and well-paid job, it is their abilities, skills and diligence that will guarantee a satisfactory job and promising future.(234 words)2013考研英语二图表作文预测之中美学生外快的来源Topic 15: Sources of income of American and Chinese studentsFrom the pie chart given above, we can observe that it reflects the statistics of sources of income of American and Chinese students. When it comes to American students, they get 15% of income from scholarship, 35% from part-time jobs and 50% from parents. In terms of Chinese students, income from scholarship accounts for 5%, and 5% of their income are from part-time jobs, 90% from their parents, 40% higher than that of American students.The pie charts informs us of the phenomenon that there exists some difference in the sources of income between American and Chinese students. What exactly contribute to this phenomenon? Reasons can be listed as follows: for one thing, the reason why Chinese students get most of income from their parents is that Chinese parents hold that students should focus all their energies on study, they don’t need to worry abou t their living expense and endeavor to make money. For another, However, American students tend to have a strong sense of independence. They would rather make money through part-time jobs or scholarship than ask their parents for money.This difference between American and Chinese students may stem from cultural difference. Americans emphasize independence, to encourage students from their parents earlier. While Chinese people emphasize interpersonal relationships ,mutual aid and rely on. From my perspective, Chinese students should enhance their consciousness of independence. On in this way can they be mature sooner. (235 words )Topic 4: Changes in the ownership of houses in ChinaFrom the bar char given above, we can observe that the ownership of houses in China experienced some changes during the past several years. The proportion of state-owned houses decreased sharply by almost 50% from 70% in 1950’ to 20% in 1990’. On the contrary, during the same period, the percentage of private houses increased rapidly from 30% to 80%.The bar chart reveals that there exists an opposite trend in the development of state-owned and private houses ownership. What exactly contribute to this phenomenon? Reasons can be listed as follows: for one thing, the authorities have issued some preferential policies to the development of private houses industry. Additionally, with the improvement of financial status and purchasing power, citizens in mounting numbers can afford to buy private houses which were deemed expensive. Last but not least, people’s decision to buy a house can also be ascribed to the power of so-called “group dynamics”: when members of our social networks own their private house one after another, we unconsciously imitate them , of course, if we have enough money.The continual growth of private houses is a symbol of the improvement of people’s living standard. However, the authorities should also place a value on the restriction of houses’ price. Otherwise, it will one day be a obstacle of the rapid and sound development of economy.(224words)。

2013年考研英语二大作文范文Write an essay based on the following chart. In your writing, you should1) interpret the chart, and2) give your comments.You should write about 150 words on the ANSWER SHEET.The chart provides an overview of the percentage of university students engaged in part-time jobs across different academic years. The horizontal axis represents the four years of college, namely freshman year, sophomore year, junior year, and senior year. The vertical axis displays the percentage of students, ranging from 0% to 100%.According to the chart, there is a gradual increase in the proportion of students with part-time jobs as they progress through their college years. Starting at 67.77% in the freshman year, the percentage rises to71.13% in the sophomore year, further to 71.93% in the junior year, and peaks at 88.24% in the senior year.These findings indicate that more students opt for part-time employment as they advance academically. This trend could be attributed to various factors. Seniors may seek part-time jobs to gain practical experience before entering the workforce, while younger students may gradually recognize the benefits of balancing work and study.Overall, the chart highlights the prevalent involvement of university students in part-time employment, with a significant rise occurring in the senior year. While part-time jobs can offer valuable experiences and financial support, it is essential for students to strike a balance between work and their academic commitments to ensure overall success during their college years.。

2013年考研英语二作文英文回答:In the tapestry of life, woven with intricate threads of triumphs and setbacks, one's resilience serves as an invaluable compass, guiding us through the labyrinthine paths that lead to personal growth and fulfillment. It is the indomitable spirit that empowers us to rise above adversity, to embrace challenges with unwavering determination, and to emerge from trials as stronger, wiser individuals.Resilience, like a sturdy oak that withstands howling winds and raging storms, is forged through the crucible of adversity. When faced with life's inevitable setbacks, it is not the absence of pain or sorrow that determines our resilience, but rather our ability to navigate the turbulent waters of adversity with grace and fortitude. It is in the face of adversity that our true character is revealed, and it is through overcoming challenges that wediscover our hidden strengths and cultivate a profound sense of inner resilience.The seeds of resilience are sown in the fertile soil of adversity. With every setback we encounter, we are given an opportunity to learn from our mistakes, to grow in strength and character, and to cultivate a deep-seated belief in our own abilities. Resilience is not simply about surviving adversity; it is about thriving in the face of challenges, about transforming adversity into a catalyst for personal transformation and growth.中文回答:在人生的挂毯上,用胜利和挫折交织着错综复杂的线,一个人的韧性就像一个宝贵的指南针,引导我们穿过于曲折的道路,通向个人成长和成就。
2013考研英语二图表作文预测之学生毕业打算:Topic 16: Students’ graduation intentionsFrom the table chart given above, we can observe that it reflects the statistics of students’ graduation intention. From 2004 to 2012, the proportion of students who are determined to further study increased rapidly from 45% to 76%. During the same period, the percentage of students who are willing to work after graduation remains steady.The table chart informs us of the phenomenon that students in increasing numbers are willing to further study after graduation. What exactly contribute to this phenomenon? Reason can be listed as follows: for one thing, facing with intense competition in the employment market, quite a few students regard further study as a buffer. moreover, they are convinced that a higher education will put them in a competitive position in the future employment market. their decision could also be attributed to the power of so-called “group dynamics”: when their friends and classmates choose to study after graduation, they will be influenced easily and imitate others’ behaviors.By observing the tendency of the past, we may forecast that the proportion of further study will continue to rise. However, students should bear in mind that a higher education will not guarantee theman ideal job. It is capabilities and skills that determine their future. (206words)2013考研英语二图表作文预测之中美学生外快的来源:Topic 15: Sources of income of American and Chinese students From the pie chart given above, we can observe that it reflects the statistics of sources of income of American and Chinese students. When it comes to American students, they get 15% of income from scholarship, 35% from part-time jobs and 50% from parents. In terms of Chinese students, income from scholarship accounts for 5%, and 5% of their income are from part-time jobs, 90% from their parents, 40% higher than that of American students.The pie charts informs us of the phenomenon that there exists some difference in the sources of income between American and Chinese students. What exactly contribute to this phenomenon? Reasons can be listed as follows: for one thing, the reason why Chinese students get most of income from their parents is that Chinese parents hold that students should focus all their energies on study, they don’t need to worry about their living expense and endeavor to make money. For another, However, American students tend to have a strong sense of independence. They would rather make money through part-time jobs or scholarship than ask theirparents for money.This difference between American and Chinese students may stem from cultural difference. Americans emphasize independence, to encourage students from their parents earlier. While Chinese people emphasize interpersonal relationships ,mutual aid and rely on. From my perspective, Chinese students should enhance their consciousness of independence. On in this way can they be mature sooner. (235 words )2013考研英语二图表作文预测之哪种职业加班多:Topic 12:Different additional working hours among diverse professionsFrom the bar chart given above, we can observe that it reflects the statistics of additional working hours among different kinds of professions. Self-employed businessmen spends nearly 2 hours per day in working overtime, ranking first. On the contrary, civil servants’ additional working hours is the shortest, only less than 50 minutes per day. The overtime of scientific researchers, cultural and sports workers and teachers ranks from 80 minutes to less than 50 minutes.The bar chart informs us of the phenomenon that there exists some difference in additional working hours among diverse careers,especially between self-employed businessmen and civil servants. Ample reasons can account for this phenomenon: firstly, to ma ke more profits, businessmen have to spend more time in manufacturing products, attracting and retaining customers and managing staffs. Moreover, with the competition becoming fiercer, they have no alternative but to work overtime to avoid being eliminated by the market and their rivals. When it comes to civil servants, things are not all the thing. Confronted with less risks and pressures, leading a steady and routine life, they don’t have to work overtime frequently.W orking overtime is a two-bladed sword. Surely, it will both generate considerable benefits. However, it will give rise to some damages. W e should balance our work, life and health. Otherwise we will eventually become a machine and slave of work. (224words)2013考研英语二图表作文预测之职业选择:Topic 11: Different job inclination between boys and girlsFrom the bar chart given above, we can find that it reflects the statistics of profession inclination between girls and boys. Most obviously, 40% of boys intend to be a manager, with only 15% of girls choosing this job. When it comes to the profession of teacher, we can observe that 45% of girls prefer to take this job, while theproportion of boys only account for 5%, 40% lower than that of girls.The bar chart informs us of the phenomenon that there exists some difference in profession inclination between boys and girls. What exactly contribute to this phenomenon ? reasons can be listed as follow: for one thing, quite a few boys regard being a manager as a symbol of success. As this profession stands for promising futures, fat pay and competence. Moreover, boys’ decision to be a manager can also be attributed to the power of so-called “group dynamics”: when members of their social network prefer to be a manager after graduation, they are easily influenced and imitate others’ behavior unconsciously or consciously. When it comes to girls, the are more inclined to be a teacher. As this profession features stability and respect. Take social and biological factors into account, we know that it is reasonable for girl to choose teacher as their ideal profession goals.Both girls and boys have rights to choose their profession. However, one thing we should bear in mind is that there exists no better or worse, superior or inferior jobs, but suitable and satisfactory ones. (254words)2013考研英语二图表作文预测之中国职业的变化:Topic 10: The changes of Chinese professionsFrom the pie chart given above, we can observe that the professions structure of Chinese people experienced some changes during the past several years. From 1980 to 1999, the percentage of agricultural professions decreased by 30% from 68% to 38%. During the same period, however, service sectors increased rapidly from 5% to 22%. When it comes to the manufacturing professions, its percentage rose markedly from 27% in 1980 to 40% in 1999.The pie chart reveals the phenomenon that there exists some difference in the development tendency among different professions in China. What exactly contribute to this phenomenon ? reasons can be listed as follows: for one thing, with the rapid process of urbanization, people in mounting numbers, especially youngster, have left their village homes ,moved into big cities and thus been out of agricultural industries. Moreover, quite a few people, especially college graduates hold that it is comparatively easy for them to make more money in the service industry. When it comes to the manufacturing industry, its transformation might be attributed to the adjustment of industrial structure: the authorities have issued some preferential policies to promote the rapid extension of manufacturing industry, thus, more workforces are required.By observing the change over the past several years, we mayforecast that the proportion of professions of service and manufacture will continue to rise. However, a high value should be placed on the development of agricultural industry by the public and the authorities. Otherwise, with the number of people who are engaged in agriculture diminishing, we will one day have nothing to eat! (262words)2013考研英语二图表作文预测之不同年龄的职场满意度:Topic 9: The difference of job satisfaction among people at diverse ages.From the table chart given above,we can observe that it reflects the statistics of staff’s job satisfaction in a certain company. 50% of staff at the age less than and equal to 40 years old are not clear about their job satisfaction. Staff at the age between 41 and 50 years old who are not content with their jobs account for 64%. When it comes to the staff at the age over 50 years old, we can find that 40% of them are satisfied with their jobs, ranking first among all the three age groups.The table chart reveals that there exists huge difference in job satisfaction among people at different ages. What exactly contribute to this phenomenon ? Reasons can be listed as follows: the reason why people at the age less than and equal to 40s are not clear abouttheir jobs is that they don’t have so much time and energy to reflect on whether his job is goo or not, all they have to do is to work hard and contend for more opportunities. As for those who are at the age between 41 and 50 years old, confronted with pressures from works, families and society, they can hardly stay put. Instead, they should pour all their energies into making money, supporting their families and enhance their social status. However, entering into a new stage of life: 50 years old, they are more likely to enjoy their life. Moreover, a fat pay, high social status, sense of achievement and respect form others enables them to lead a comfortable and satisfactory life.As common saying goes, “it is impossible to please anyone.”In terms of jobs, it also can hardly please any staffs. However, we can do something to change the situation : staffs themselves should adjust their attitude towards jobs. The companies should also enforce some policies to improve staffs’ living standard and enhance the sense of gratification. (325words)2013考研英语二图表作文预测之快餐和坐下来餐厅发展趋势:Topic 7: The development tendency of fast food and sitdown restaurantFrom the curve chart given above, we can observe that thenumber meals of fast food and sitdown restaurant experienced some changes during the past several years. The number of meals of fast food increased slowly from 20 in 1970 to nearly 30 in 1980. From 1980 to 2000, it ascended rapidly from 30 to approximately 90. On the contrary, when observing the statistics of sitdown restaurant meals, we can find that it increased slowly from 20 in 1970 to roughly 50 in 2000.The curve chart informs us of the phenomenon that there exists some difference in the development tendency between fast food and sitdown restaurants. What exactly contribute to this phenomenon? Reasons can be listed as follows: for one thing, with the pace of modern life quickening, people barely have much time to waste in lining up for restaurant meals, on the contrary, fast food meals can do help busy people save a great deal of time. Additionally, the authorities have issued some preferential policies to protect and encourage the rapid extension of fast food industry , thus the public can buy fast food at shops scattering around the city. On the contrary , people in diminishing numbers are willing to eat at sitdown restaurant. They think that eating at restaurant is always time-consuming and inconvenient. Besides, food at restaurant is comparatively expensive than fast food.by observing the trend of the past, we may forecast that thenumber of fast food meals will continue to rise in the years to come. However, we should also take the detrimental impact of fast food into consideration. Do remember that fast food is one of the main causing factors of diseases such as heart attack, obesity and diabetes.2013考研英语二图表作文预测之不同国家和地区在京投资:Topic 8: Investment in Beijing from different countries and regions From the pie chart given above, we can observe that it reflects the statistics of investment in Beijing from different countries and regions. The proportion of investment from Hong Kong accounts for 44%, ranking first. The percentage of investment from other 23 countries and regions ranks second among all, making up 20.8 %. Japan occupies 19.2%, ranking third. When it comes to the U.S.A., we can find that it takes up 16% , 28% lower than that of Hong Kong.The pie chart reveals the phenomenon that most of the investment in Beijing stem from Hong Kong. What exactly contribute to this phenomenon? Reasons can be listed as follows: in the first place, China's investment policy provide preferential treatment to investors from Hong Kong. They are more likely to be immune to high taxes and other charges. Moreover, quite a few Hong Kong investors hold the opinion that, with the same language,cultures, traditions and customs, mainland is an ideal and promising investment resort which will be bound to generate considerable profits. Last but not least, it will not take a long time to commute between Hong Kong and Chinese mainland, the region advantage also has attracted more Hong Kong investors to locate their companies and factories in the mainland.The public can benefit a lot from Hong Kong investment. People can buy products with superior quality at a comparatively cheaper price. However, balancing the investment proportion from different countries is also a issue needed to be put at the top of r elevant administration departments’ agenda. Thus, people can be exposed to a greater variety of products and have more purchasing options. (272 words)2013考研英语二图表作文预测之全球电子商务成交额:Topic 6: Global E-commerce turnoverFrom the curve chart given above, we can observe that the turnover of global E-commerce experienced some change during the past several years. From 1997 to 2005, it rose dramatically from 20 billion to 900 billion.The curve chart reveals that the global E-commerce industryenjoys an explosive growth. Quite a few reasons can be listed to account for this phenomenon, and the followings might be the most critical ones: for one thing, the authorities of different countries have issued some preferential policies to protect and encourage the development of E-commerce, thus quite a few online-transaction websites emerge overnight. Moreover, the one-click-payment consumption mode has been widely accepted by the public thanks to the widespread availability of the Internet. Last but not least, people’s decision to purchase on-line can also be put down to the power of so-called “group-dynamics”: when our friends are shopping at network, we will be influenced by them and imitate their behaviors unconsciously.The rapid development of E-commerce signals that new business models contribute largely to the sustainable development of the global economy. However, when enjoying the fruits offered by modern technology, we should also keep an eye on the underlying threat of it. In a world features open boundary, deception and fraud sometime abound. (209 words )2013考研英语二图表作文预测之电视观众与电影观众数量变化:Topic 5: Changes in the number of TV-goers and Film-goers From the curve chart given above, we can observe that thenumber of film-goers and TV-goers experienced some changes over the past decade. From 1975 to 1985, the number of film-goers decreased rapidly from 80 million to nearly 10 million. During the same period, the number of TV-goers increased sharply from less than 10 million to approximately 100 million.The curve chart informs us of the phenomenon that there exists an opposite tendency between film-goers and TV-goers. Many reasons can account for this phenomenon, and the followings might be the most critical ones: for one thing, by improving the quality of programs, the TV-industry has retained a large body of televiewers and attracted quite a few potential viewers that would have swarmed into cinemas. When it comes to the cinema, the reason why it slackens might be attributed to the change of people’s consumption idea, people in increasing numbers hold the opinion that the ticket fare is sometimes too high for them to afford. Besides, by taking advantage of the convenience offered by the Internet, people can download their favorite movies from the websites directly instead of sitting in the movie theater, which also reinforces the inexorable decline of cinema industry.Whether the film industry will continue to shrink away or not is still unknown. However, no one can deny the fact that movies play an indispensable role in enriching our lives. Perhaps one day, thecinema industry will enjoy a revival, time will tell.2013考研英语二图表作文预测之中国所有制的变化:Topic 4: Changes in the ownership of houses in ChinaFrom the bar char given above, we can observe that the ownership of houses in China experienced some changes during the past several years. The proportion of state-owned houses decreased sharply by almost 50% from 70% in 1950’to 20% in 1990’. On the contrary, during the same period, the percentage of private houses increased rapidly from 30% to 80%.The bar chart reveals that there exists an opposite trend in the development of state-owned and private houses ownership. What exactly contribute to this phenomenon? Reasons can be listed as follows: for one thing, the authorities have issued some preferential policies to the development of private houses industry. Additionally, with the improvement of financial status and purchasing power, citizens in mounting numbers can afford to buy private houses which were deemed expensi ve. Last but not least, people’s decision to buy a house can also be ascribed to the power of so-called “group dynamics”: when members of our social networks own their private house one after another, we unconsciously imitate them , of course, if we have enough money.The continual growth of private houses is a symbol of the improvement of people’s living standard. However, the authorities should also place a value on the restriction of houses’price. Otherwise, it will one day be a obstacle of the rapid and sound development of economy. (224words)2013考研英语二图表作文预测之移动电话预订:Topic 1: Mobile-phone subscriptionsFrom the bar chart given above, we can observe that mobile-phone subscriptions in developing and developed country experienced some changes during the past several year. The number of mobile-phone subscriptions in developing countries increased dramatically from less than 1 billion in 2000 to 4 billion in 2008. Taking a look at the statistics of mobile-phone subscriptions in developed countries, we can see that it ascended gradually from less than 1 billion in 2000 to the maximum at 1 billion in 2007, and then remained unchanged in 2008.The bar chart reveals that there exists difference in the development of mobile-phone subscriptions between developing and developed countries. What exactly contribute to this phenomenon? Reasons can be listed as follows: the authorities in developing countries have issued some preferential policies to protect andpromote the development of the mobile-phone industry. Moreover, with the improvement of financial status and purchasing power, people in mounting numbers can afford to buy mobile-phones which was once deemed expensive. When it comes to developed countries, its slow growth can be best attributed to the market saturation: almost every one has owned mobile-phones, it is no need for them to buy a new one.By observing the trend in developed countries, we may forecast that the mobile-phone subscriptions will not continue to grow rapidly, as developing countries will meet the same problem of “limited grow space”. This is, obviously, the law of the market development.。
2013年考研英语二大作文评讲及参考范文2013年考研英语二的大作文正如课前预测的一样,考的是图表作文(柱状图)。
新东方的考研班上我们说过图表作文一共有两大类,动态图和静态图。
2010和2011年考的是动态图,2012年考的是静态图。
而这次又再一次重复2012年的静态图,而柱状图也是在前两年(2010年和2011年)考到过,是我们上课训练的重点。
这篇文章从审题上不难得出这样一个结论:大一学生兼职比例小,大四学生兼职比例高。
那么文章三段怎么布局呢?按照上课重点讲过的结构分析,以下是可以参考的文章结构:第一段:描写图表(分别写出4个数字,以及最值)第二段:分析原因(为什么年级越高打工比例高,年级低打工比例小)第三段:自己看法(兼职很重要,我们要利用好这样的机会提升自己能力)那么这篇文章的难点在哪里呢?第一,描写图表,百分比说,百分比的最大最小值比较怎么讲,这些内容是我们上课图表作文描写的重点内容;第二,原因分析,比如兼职打工可以积累经验(accumulate working experience),高年级的学生自己可以安排时间(have autonomy over their schedule);而低年级的学生不知道社会经验的重要(lack of awareness)以及因为父母的保护(parents’protection);第三,自己看法,这个段落上课讲过,主要是总结上文内容以及表达愿望,比如兼职打工确实很重要,我们要利用好这样的机会第四,语言表达,在这篇文章里,“大一”、“大二”、“大三”、“大四”的表达要会写,另外“打工兼职”这个词会不断出现,而学会同义词替换是得分的关键之一。
比如do part-time job, work part time, be a part-timer, work in a company two or three days a week。
这些替换分别从替换动词,替换词性和解释名词的角度来进行,也是我们讲课的重点内容之一。
The Power of Persistence and the Journey ofSuccessIn the fast-paced and often unpredictable world of today, the value of persistence cannot be overstated. The journey of success, whether it be in academics, careers, or personal goals, often hinges on our ability to persevere in the face of challenges and setbacks. The essay prompt from the 2013 graduate entrance examination for English II, which asks us to reflect on the saying "The greatest glory in living lies not in never falling, but in rising every time we fall," serves as a powerful reminder of this truth. The essence of this proverb lies in the understanding that success is not solely measured by our achievements or the absence of failure. Instead, it is the resilience we exhibit when faced with adversity that truly defines our success. Falling is inevitable in life, whether it be in our professional careers, personal relationships, or even our dreams and aspirations. What separates the successful individuals from the rest is their refusal to stay down and their determination to get back up, stronger and wiser.Persistence, therefore, becomes the key ingredient in this recipe for success. It is the driving force that propels us forward, even when faced with seemingly insurmountable obstacles. It is the silent witness to our dedication and commitment, the silent testament to our belief in ourselves and our goals. It is the invisible hand that guides us through the dark, reminding us that every fall is merely a temporary halt in our journey, not a permanent end.However, persistence does not mean stubbornly sticking to a single path regardless of obstacles. It rather entails a flexible and adaptive approach, one that is willing to reevaluate and redirect when necessary. Persistence is about learning from our falls, about growing stronger and wiser with each experience. It is about understanding that success is not a destination, but a journey, one that is filled with both highs and lows, but ultimately leads us to our desired destination.In conclusion, the power of persistence lies in its ability to transform our falls into stepping stones towards success. It is the invisible force that propels us forward,even when faced with adversity. It is the silent witness to our dedication and commitment, the silent testament to our belief in ourselves and our goals. As we embark on our journey towards success, let us remember that the greatest glory lies not in never falling, but in rising every timewe fall, stronger and wiser than before.**坚持的力量与成功的旅程**在当下这个快节奏且充满变数的世界中,坚持的价值不容忽视。
2013年考研英语二范文--------------------------------------------------- 本文来自韦博国际英语2013年的考研英语已经结束,韦博()本文为大家总结今年英语二的大作文讲义。
今年的考研英语二是简单的现象原因型的作文,相关话题很常见,增加了今年考题的简单性和评分难度。
这次的考题为图表作文,主要是分析现象背后的原因而不是利弊,这是值得大家注意的一点。
下面为大家介绍这次考研英语二的写作范文;Along with the advance of the society more and more social issues are brought to our attention, one of which is that the number of college students taking part-time jobs is increasing sharply with the increase of their grades. The freshmen doing part-time jobs account for 67.77 percent of the total, whereas the proportion of senior students is 88.24 percent.Many factors that contribute to the phenomenon may be summarized as follows. Above all, as the result of globalization, it is believed that students now take a more positive attitude towards part-time jobs, and regard it as a healthy and active lifestyle. According to a survey performed by socialists, almost 65% of the undergraduates regard part-time jobs as their top priority, compared to 46 percent only a few years ago. What’s more, the diversity of modern employment ways may bring about the drastic changes in old-fashioned concepts. Last but not the least, with the rapid pace of modern society, there is an increasing demand for various kinds of professional skills which can be learned from part-time jobs.Based on the factors discussed above, all the analysis points to an unshakableconclusion. The trend does not exist in this single field, and it is bound to usher in a new era of relevant spheres. (Now that we have perceived it, we should take advantage of the opportunity to gain the upper hand in the competition of the modern world.)希望能对即将参加2014年考研英语考试的考生有帮助。
2013考研英语二作文范文:The Importance of Learning English。
In today's world, English has become the most widely used language in the fields of business, science, technology, and international communication. Therefore, it is of great importance for people to learn English. In this essay, I will discuss the significance of learning English and offer some suggestions on how to improve English proficiency.First and foremost, learning English can open up a world of opportunities. English is the dominant language in international business and trade, and it is also the language of the internet and many international organizations. By mastering English, people can access a wealth of information and resources that are not available in their native language. This can greatly enhance theircareer prospects and give them a competitive edge in the global job market.Furthermore, English is the language of science and technology. Many of the world's most important scientific journals, research papers, and technological innovations are published in English. Therefore, a good command of English is essential for anyone who wants to stay current with the latest developments in these fields. Moreover, English is the language of diplomacy and international relations. In order to participate in global discussions and negotiations, it is crucial for people to be able to communicate effectively in English.In addition, learning English can broaden one's cultural horizons. English is the language of Shakespeare, Dickens, and other great literary figures. By learning English, people can access the rich literary heritage of the English-speaking world and gain a deeper understanding of its culture and history. Furthermore, English is the language of popular culture, including music, film, and television. By learning English, people can enjoy a widerrange of entertainment and connect with people fromdifferent countries and backgrounds.To improve English proficiency, there are several strategies that people can use. First, they should immerse themselves in the language as much as possible. This can be done by watching English-language movies and TV shows, listening to English-language music, and reading English-language books and newspapers. Second, they should practice speaking and writing in English on a regular basis. Thiscan be done by participating in English conversation groups, writing essays and journal entries in English, and engaging in language exchange programs with native English speakers. Finally, they should take advantage of formal language learning opportunities, such as English classes, tutoring, and online courses.In conclusion, learning English is of great importancein today's globalized world. It can open up a world of opportunities, enhance career prospects, and broadencultural horizons. By following the strategies outlined above, people can improve their English proficiency andreap the many benefits that come with being fluent in this important language.。
2013年考研英语作文十大热点预测一、低碳与环保低碳与环保高分范文As is vividly depicted by the drawing above, a boy is sleeping soundly①and comfortably in the sofa, with the television on, when his mother comes and turns off the television for him, blaming the boy for not having turned off the television again②。
This phenomenon can easily be found anywhere in our daily life. Many people are used to doing③everything with the television on, not actually watching it at all. Such a habit can cause waste of much electricity and energy, and result in the emission of car bon. This deviates from the popular concept of “low carbon life” — to reduce the emission of carbon, especially carbon dioxide, to protect our environment and realize sustainable development. According to statistics, if we can decrease the time for having the television on by one hour each day, we can deduce the amount of carbon emission by 4. 71 kilogram each month。
2013考研英语二图表作文预测之学生毕业打算Topic 16: Students’ graduation intentionsFrom the table chart given above, we can observe that it reflects the statistics of students’ graduation intention. From 2004 to 2012, the proportion of students who are determined to further study increased rapidly from 45% to 76%. During the same period, the percentage of students who are willing to work after graduation remains steady.The table chart informs us of the phenomenon that students in increasing numbers are willing to further study after graduation. What exactly contribute to this phenomenon? Reason can be listed as follows: for one thing, facing with intense competition in the employment market, quite a few students regard further study as a buffer. moreover, they are convinced that a higher education will put them in a competitive position in the future employment market. their decision could also be attributed to the power of so-called “group dynamics”: when their friends and classmates choose to study after gradu ation, they will be influenced easily and imitate others’ behaviors.By observing the tendency of the past, we may forecast that the proportion of further study will continue to rise. However, students should bear in mind that a higher education will not guarantee them an ideal job. It is capabilities and skills that determine their future. (206words)2013考研英语二图表作文预测之中美学生外快的来源Topic 15: Sources of income of American and Chinese studentsFrom the pie chart given above, we can observe that it reflects the statistics of sources of income of American and Chinese students. When it comes to American students, they get 15% of income from scholarship, 35% from part-time jobs and 50% from parents. In terms of Chinese students, income from scholarship accounts for 5%, and 5% of their income are from part-time jobs, 90% from their parents, 40% higher than that of American students.The pie charts informs us of the phenomenon that there exists some difference in the sources of income between American and Chinese students. What exactly contribute to this phenomenon? Reasons can be listed as follows: for one thing, the reason why Chinese students get most of income from their parents is that Chinese parents hold that students should focus all their energies on study, they don’t need to worry about their living expense and endeavor to make money. For another, However, American students tend to have a strong sense of independence. They would rather make money through part-time jobs or scholarship than ask their parents for money.This difference between American and Chinese students may stem from cultural difference. Americans emphasize independence, to encourage students from their parents earlier. While Chinese people emphasize interpersonal relationships ,mutual aid and rely on. From my perspective, Chinese students should enhance their consciousness of independence. On in this way can they be mature sooner. (235 words )2013考研英语二图表作文预测之工程硕士招生Topic 13: The enrollments of The master of engineeringFrom the bar chart given above, we can observe that the enrollments of master of engineering experienced some changes during the past several years. From 1998 to 2000, it increased gradually from roughly 2,500 to nearly 5000. However,it rose rapidly from 15,000 in 2001 to approximately 3,5000 in 2004.The bar chart reveals the phenomenon that the enrollments of master of engineering is growing sharply. Many factors can account for this phenomenon, and the followings might be the most critical ones: for one thing , the authorities have issued some policies to promote the development and expansion of engineering industry which includes architecture, electric engineering and so on. Thus, experts , specialists and graduates majoring in this field are needed. Moreover, Quite a few students hold that a master degree of engineering can ensure them to find an ideal and promising job with ease. Last but not least, students’ decision to pursue a master degree of engineering can also be attributed to the power of “group dynamics”: when members of their social networks take engineering as a college major, they unconsciously imitate and follow the trend.By observing the trend of the past, we may forecast that this tendency will continue. However, A master degree of engineering can not ensure students an ideal and well-paid job, it is their abilities, skills and diligence that will guarantee a satisfactory job and promising future.2013考研英语二图表作文预测之哪种职业加班多Topic 12:Different additional working hours among diverse professionsFrom the bar chart given above, we can observe that it reflects the statistics of additional working hours among different kinds of professions. Self-employed businessmen spends nearly 2 hours per day in working overtime, ranking first. On the contrary, civil servants’ additional working hours is the shortest, only less than 50 minutes per da y. The overtime of scientific researchers, cultural and sports workers and teachers ranks from 80 minutes to less than 50 minutes.The bar chart informs us of the phenomenon that there exists some difference in additional working hours among diverse careers, especially between self-employed businessmen and civil servants. Ample reasons can account for this phenomenon: firstly, to make more profits, businessmen have to spend more time in manufacturing products, attracting and retaining customers and managing staffs. Moreover, with the competition becoming fiercer, they have no alternative but to work overtime to avoid being eliminated by the market and their rivals. When it comes to civil servants, things are not all the thing. Confronted with less risks an d pressures, leading a steady and routine life, they don’t have to work overtime frequently.Working overtime is a two-bladed sword. Surely, it will both generate considerable benefits. However, it will give rise to some damages. We should balance our work, life and health. Otherwise we will eventually become a machine and slave of work. (224words)2013考研英语二图表作文预测之职业选择Topic 11: Different job inclination between boys and girlsFrom the bar chart given above, we can find that it reflects the statistics of profession inclination between girls and boys. Most obviously, 40% of boys intend to be a manager, with only 15% of girls choosing this job. When it comes to the profession of teacher, we can observe that 45% of girls prefer to take this job, while the proportion of boys only account for 5%, 40% lower than that of girls.The bar chart informs us of the phenomenon that there exists some difference in profession inclination between boys and girls. What exactly contribute to this phenomenon ? reasons can be listed as follow: for one thing, quite a few boys regard being a ma nager as a symbol of success. As this profession stands for promising futures, fat pay and competence. Moreover, boys’ decision to be a manager can also be attributed to the power of so-called “group dynamics”: when members of their social network prefer t o be a manager after graduation, they are easily influenced and imitate others’ behavior unconsciously or consciously. When it comes to girls, the are more inclined to be a teacher. As this profession features stability and respect. Take social and biological factors into account, we know that it is reasonable for girl to choose teacher as their ideal profession goals.Both girls and boys have rights to choose their profession. However, one thing we should bear in mind is that there exists no better or worse, superior or inferior jobs, but suitable and satisfactory ones. (254words)Topic 10: The changes of Chinese professionsFrom the pie chart given above, we can observe that the professions structure of Chinese people experienced some changes during the past several years. From 1980 to 1999, the percentage of agricultural professions decreased by 30% from 68% to 38%. During the same period, however, service sectors increased rapidly from 5% to 22%. When it comes to the manufacturing professions, its percentage rose markedly from 27% in 1980 to 40% in 1999.The pie chart reveals the phenomenon that there exists some difference in the development tendency among different professions in China. What exactly contribute to this phenomenon ? reasons can be listed as follows: for one thing, with the rapid process of urbanization, people in mounting numbers, especially youngster, have left their village homes ,moved into big cities and thus been out of agricultural industries. Moreover, quite a few people, especially college graduates hold that it is comparatively easy for them to make more money in the service industry. When it comes to the manufacturing industry, its transformation might be attributed to the adjustment of industrial structure: the authorities have issued some preferential policies to promote the rapid extension of manufacturing industry, thus, more workforces are required.By observing the change over the past several years, we may forecast that the proportion of professions of service and manufacture will continue to rise. However, a high value should be placed on the development of agricultural industry by the public and the authorities. Otherwise, with the number of people who are engaged in agriculture diminishing, we will one day have nothing to eat! (262words)Topic 9: The difference of job satisfaction among people at diverse ages.From the table chart given above,we can observe that it reflects the statistics of staff’s job satisfaction in a certain company. 50% of staff at the age less than and equal to 40 years old are not clear about their job satisfaction. Staff at the age between 41 and 50 years old who are not content with their jobs account for 64%. When it comes to the staff at the age over 50 years old, we can find that 40% of them are satisfied with their jobs, ranking first among all the three age groups.The table chart reveals that there exists huge difference in job satisfaction among people at different ages. What exactly contribute to this phenomenon ? Reasons can be listed as follows: the reason why people at the age less than and equal to 40s are not clear about their jobs is that t hey don’t have so much time and energy to reflect on whether his job is goo or not, all they have to do is to work hard and contend for more opportunities. As for those who are at the age between 41 and 50 years old, confronted with pressures from works, families and society, they can hardly stay put. Instead, they should pour all their energies into making money, supporting their families and enhance their social status. However, entering into a new stage of life: 50 years old, they are more likely to enjoy their life. Moreover, a fat pay, high social status, sense of achievement and respect form others enables them to lead a comfortable and satisfactory life.As common saying goes, “ it is impossible to please anyone.” In terms of jobs, it also can hardl y please any staffs. However, we can do something to change the situation : staffs themselves should adjust their attitude towards jobs. The companies should also enforce some policies to improve staffs’ living standard and enhance the sense of gratificati on. (325words)Topic 7: The development tendency of fast food and sitdown restaurantFrom the curve chart given above, we can observe that the number meals of fast food and sitdown restaurant experienced some changes during the past several years. The number of meals of fast food increased slowly from 20 in 1970 to nearly 30 in 1980. From 1980 to 2000, it ascended rapidly from 30 to approximately 90. On the contrary, when observing the statistics of sitdown restaurant meals, we can find that it increased slowly from 20 in 1970 to roughly 50 in 2000.The curve chart informs us of the phenomenon that there exists some difference in the development tendency between fast food and sitdown restaurants. What exactly contribute to this phenomenon? Reasons can be listed as follows: for one thing, with the pace of modern life quickening, people barely have much time to waste in lining up for restaurant meals, on the contrary, fast food meals can do help busy people save a great deal of time. Additionally, the authorities have issued some preferential policies to protect and encourage the rapid extension of fast food industry , thus the public can buy fast food at shops scattering around the city. On the contrary , people in diminishing numbers are willing to eat at sitdown restaurant. They think that eating at restaurant is always time-consuming and inconvenient. Besides, food at restaurant is comparatively expensive than fast food.by observing the trend of the past, we may forecast that the number of fast food meals will continue to rise in the years to come. However, we should also take the detrimental impact of fast food into consideration. Do remember that fast food is one of the main causing factors of diseases such as heart attack, obesity and diabetes.Topic 8: Investment in Beijing from different countries and regionsFrom the pie chart given above, we can observe that it reflects the statistics of investment in Beijing from different countries and regions. The proportion of investment from Hong Kong accounts for 44%, ranking first. The percentage of investment from other 23 countries and regions ranks second among all, making up 20.8 %. Japan occupies 19.2%, rankingthird. When it comes to the U.S.A., we can find that it takes up 16% , 28% lower than that of Hong Kong.The pie chart reveals the phenomenon that most of the investment in Beijing stem from Hong Kong. What exactly contribute to this phenomenon? Reasons can be listed as follows: in the first place, China's investment policy provide preferential treatment to investors from Hong Kong. They are more likely to be immune to high taxes and other charges. Moreover, quite a few Hong Kong investors hold the opinion that, with the same language, cultures, traditions and customs, mainland is an ideal and promising investment resort which will be bound to generate considerable profits. Last but not least, it will not take a long time to commute between Hong Kong and Chinese mainland, the region advantage also has attracted more Hong Kong investors to locate their companies and factories in the mainland.The public can benefit a lot from Hong Kong investment. People can buy products with superior quality at a comparatively cheaper price. However, balancing the investment proportion from different countries is also a issue needed to be put at the top of relevant administration departments’ agenda. Thus, people can be exposed to a greater variety of products and have more purchasing options. (272 words)Topic 1: Mobile-phone subscriptionsFrom the bar chart given above, we can observe that mobile-phone subscriptions in developing and developed country experienced some changes during the past several year. The number of mobile-phone subscriptions in developing countries increased dramatically from less than 1 billion in 2000 to 4 billion in 2008. Taking a look at the statistics of mobile-phone subscriptions in developed countries, we can see that it ascended gradually from less than 1 billion in 2000 to the maximum at 1 billion in 2007, and then remained unchanged in 2008.The bar chart reveals that there exists difference in the development of mobile-phone subscriptions between developing and developed countries. What exactly contribute to this phenomenon? Reasons can be listed as follows: the authorities in developing countries have issued some preferential policies to protect and promote the development of the mobile-phone industry. Moreover, with the improvement of financial status and purchasing power, people in mounting numbers can afford to buy mobile-phones which was once deemed expensive. When it comes to developed countries, its slow growth can be best attributed to the market saturation: almost every one has owned mobile-phones, it is no need for them to buy a new one.By observing the trend in developed countries, we may forecast that the mobile-phone subscriptions will not continue to grow rapi dly, as developing countries will meet the same problem of “limited grow space”. This is, obviously, the law of the market development.Topic 2: Domestic market share of different car brandsFrom the bar chart given above, we can observe that the market share of different brands in domestic car markets experienced some changes during the past several years. The car market share of Chinese brands increased markedly from 25% in 2008 to roughly 35% in 2009. During the same period , the proportion of Japanese brands decreased sharply by nearly 10% from 35% to 25%. The percentage of American brands remained unchanged at 15% from 2008 to 2009.The bar chart reveals that there exists some difference in the development tendency among different car brands. What exactly contribute to this phenomenon ? Reasons can be listed as follows: for one thing, the Chinese government has issued some preferential policies to protect and promote the rapid extension of domestic automotive industry. Moreover, with the decline of the prices of domestic cars, people in mounting numbers are more inclined to choose them. As for Japanese car brands, i ts loss of customers can be attributed to the “Recall Crisis” and low price performance ration.To maintain the leading position, Chinese automotive industry should spare no efforts to improve their capabilities of products innovation, service awareness and continue to lower its prices. Only in this way can the car industry enjoy a sustainable development. (208 words)Topic 3: The boom of overseas traveling industryFrom the bar chart given above, we can observe that the number of people traveling abroad experienced some changes during the past several years. From 1999 to 2000, the number of Chinese people traveling abroad increased rapidly from 7.5 million to 10 million, and then to 12.1 million in 2001.The bar chart reveals that people in mounting numbers are going to travel abroad. What exactly contribute to this phenomenon? Reasons can be listed as follows: for one thing, the authorities have issued some preferential policies to promote the development of the overseas tourism industry, which encourages a sudden emergence of travel agencies that can provide customers with convenient overseas tourism services. Additionally, with the improvement of financial status and purchasing power, a considerable number of Chinese people can afford the once-deemed-expensive traveling expenses. Last but not least, as there exists huge difference in cultures, customs and landscapes between China and overseas countries, quite a few people hold that overseas traveling is not only a perfect way to relax oneself, but also enrich their knowledge and expand their horizons.By observing the past trends, we may forecast that the growth tendency will continue. However,it is also a highly variable industry which is vulnerable to seasons and climates,international political situation,fluctuations in exchange.Topic 4: Changes in the ownership of houses in ChinaFrom the bar char given above, we can observe that the ownership of houses in China experienced some changes during the past several years. The proportion of state-owned houses decreased sharply by almost 50% from 70% in 1950’ to 20% in 1990’. On the contrary, during the same period, the percentage of private houses increased rapidly from 30% to 80%.The bar chart reveals that there exists an opposite trend in the development of state-owned and private houses ownership. What exactly contribute to this phenomenon? Reasons can be listed as follows: for one thing, the authorities have issued some preferential policies to the development of private houses industry. Additionally, with the improvement of financial status and purchasing power, citizens in mounting numbers can afford to buy private houses which were deemed expensive. Last but not least, people’s decision to buy a house can also be ascribed to the power of so-called “group dynamics”: when members of oursocial networks own their private house one after another, we unconsciously imitate them , of course, if we have enough money.The continual growth of private houses is a symbol of the improvement of people’s living standard. However, the authorities should also place a value on the restriction of houses’ price. Otherwise, it will one day be a obstacle of the ra pid and sound development of economy. (224words)Topic 5: Changes in the number of TV-goers and Film-goersFrom the curve chart given above, we can observe that the number of film-goers and TV-goers experienced some changes over the past decade. From 1975 to 1985, the number of film-goers decreased rapidly from 80 million to nearly 10 million. During the same period, the number of TV-goers increased sharply from less than 10 million to approximately 100 million.The curve chart informs us of the phenomenon that there exists an opposite tendency between film-goers and TV-goers. Many reasons can account for this phenomenon, and the followings might be the most critical ones: for one thing, by improving the quality of programs, the TV-industry has retained a large body of televiewers and attracted quite a few potential viewers that would have swarmed into cinemas. When it comes to the cinema, the reason why it slackens might be attributed to the change of people’s consu mption idea, people in increasing numbers hold the opinion that the ticket fare is sometimes too high for them to afford. Besides, by taking advantage of the convenience offered by the Internet, people can download their favorite movies from the websites directly instead of sitting in the movie theater, which also reinforces the inexorable decline of cinema industry.Whether the film industry will continue to shrink away or not is still unknown. However, no one can deny the fact that movies play an indispensable role in enriching our lives. Perhaps one day, the cinema industry will enjoy a revival, time will tell.Topic 6: Global E-commerce turnoverFrom the curve chart given above, we can observe that the turnover of global E-commerce experienced some change during the past several years. From 1997 to 2005, it rose dramatically from 20 billion to 900 billion.The curve chart reveals that the global E-commerce industry enjoys an explosive growth. Quite a few reasons can be listed to account for this phenomenon, and the followings might be the most critical ones: for one thing, the authorities of different countries have issued some preferential policies to protect and encourage the development of E-commerce, thus quite a fewonline-transaction websites emerge overnight. Moreover, the one-click-payment consumption mode has been widely accepted by the public thanks to the widespread availability of the Internet. Last but not least, people’s decision to purchase on-line can also be put down to the power of so-called “group-dynamics”: when our friends are shopping at network, we will be influenced by them and imitate their behaviors unconsciously.The rapid development of E-commerce signals that new business models contribute largely to the sustainable development of the global economy. However, when enjoying the fruits offered by modern technology, we should also keep an eye on the underlying threat of it. In a world features open boundary, deception and fraud sometime abound. (209 words )。