2014年最新版财务报表
- 格式:doc
- 大小:197.50 KB
- 文档页数:4
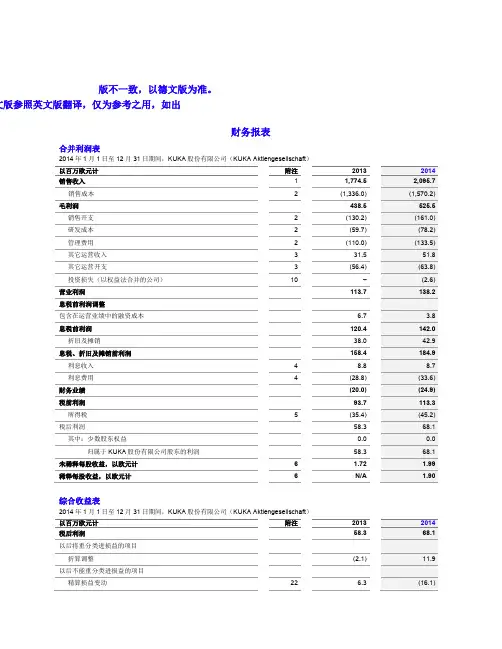
版不一致,以德文版为准。
文版参照英文版翻译,仅为参考之用,如出财务报表合并利润表2014年1月1日至12月31日期间,KUKA股份有限公司(KUKA Aktiengesellschaft)以百万欧元计附注2013 2014销售收入 1 1,774.5 2,095.7 销售成本 2 (1,336.0) (1,570.2) 毛利润438.5 525.5 销售开支 2 (130.2) (161.0)研发成本 2 (59.7) (78.2)管理费用 2 (110.0) (133.5)其它运营收入 3 31.5 51.8其它运营开支 3 (56.4) (63.8)投资损失(以权益法合并的公司)10 –(2.6) 营业利润113.7 138.2息税前利润调整包含在运营业绩中的融资成本 6.7 3.8息税前利润120.4 142.0 折旧及摊销38.0 42.9 息税、折旧及摊销前利润158.4 184.9 利息收入 4 8.8 8.7利息费用 4 (28.8) (33.6) 财务业绩(20.0) (24.9)税前利润93.7 113.3 所得税 5 (35.4) (45.2) 税后利润58.3 68.1 其中:少数股东权益0.0 0.0 归属于KUKA股份有限公司股东的利润58.3 68.1 未稀释每股收益,以欧元计 6 1.72 1.99稀释每股收益,以欧元计 6 N/A 1.90综合收益表2014年1月1日至12月31日期间,KUKA股份有限公司(KUKA Aktiengesellschaft)以百万欧元计附注2013 2014税后利润58.3 68.1以后将重分类进损益的项目折算调整(2.1) 11.9 以后不能重分类进损益的项目精算损益变动22 6.3 (16.1)2014年1月1日至12月31日期间,KUKA股份有限公司(KUKA Aktiengesellschaft)以百万欧元计附注2013 2014精算损益变动相关的递延所得税(1.6) 3.8 直接在股东权益中的变动 2.6 (0.4) 综合收益60.9 67.7 其中:少数股东权益- - 归属于KUKA股份有限公司股东的权益60.9 67.7现金流量表*2014会计年度,KUKA股份有限公司以百万欧元计2013 2014税后净收入58.3 68.1 无形资产摊销20.3 18.4 有形资产折旧17.9 25.1 其它非支付相关收入(2.3) (16.2) 其它非支付相关费用21.1 31.9 现金收益115.3 127.3 处置资产现金收入0.3 0.4 减值准备变动10.4 34.8 流动资产和债务变动存货变动27.9 (27.7) 应收款项和递延费用变动(0.1) (35.4) 债务和递延收益变动(不包含金融债务)67.2 67.6 经营活动产生的现金流221.0 167.0 处置固定资产产生的现金支付0.7 0.7 支付无形资产资本费用的现金(17.7) (15.9) 支付有形资产资本费用的现金(57.0) (78.4) 收购合并公司以及其它业务部分支付的现金(16.6) (284.6) 短期基金管理过程中从金融资产收到的现金(35.0) 12.7 投资活动产生的现金流量(125.6) (365.5) 自由现金流95.4 (198.5) 增资收到的现金- 86.6 分配股利(6.8) (10.2) 发行/偿还债券以及与债券类似的债务收到/支付的现金111.0 (173.0) 获得/偿还银行贷款收到/支付的现金(0.4) (17.4) 融资活动产生的现金流量103.8 (114.0) 与支付相关的现金以及现金等价物变动199.2 (312.5) 收购公司产生的变动–56.8 与汇率相关的现金与现金等价物变动及其他变动(2.4) 6.7 现金以及现金等价物的变动196.8 (249.0)2014会计年度,KUKA股份有限公司以百万欧元计2013 2014其中:使用受限的现金的净增加/减少 6.1 3.7 期初现金与现金等价物244.3 441.1 期末现金与现金等价物441.1 192.1 使用受限的现金 6.1 2.4 *参见附注29,以获取现金流量表的更多信息合并资产负债表2014年1月1日至12月31日期间,KUKA股份有限公司以百万欧元计附注2013 2014资产非流动资产无形资产7 92.5 430.4 物业、厂房和设备8 133.6 233.8 金融投资9 0.2 0.6 采用权益法核算的投资10 – 5.6226.3 670.4 融资租赁应收款项11 61.9 66.1 应退税金 4.8 3.4 其它长期应收款项和其它资产14 9.1 9.9 递延所得税资产 5 25.6 48.2327.7 798.0 流动资产存货12 186.2 272.4 应收款项和其它资产贸易应收账款13 167.5 273.8 建造合同应收款项13 181.1 339.1 融资租赁应收款项11 5.3 6.9 应收所得税7.1 9.7 其它资产、预付费用和递延费用14 61.1 71.0422.1 700.5 现金及现金等价物15 441.1 192.1持有待售资产27 –16.51,049.4 1,181.51,377.1 1,979.5股东权益及负债股东权益(16)认缴资本(17) 88.2 92.8合并资产负债表2014年1月1日至12月31日期间,KUKA股份有限公司以百万欧元计附注2013 2014资本公积(18) 94.5 176.5 盈余公积(19) 195.1 255.0 少数股东权益(20) 1.3 16.8379.1 541.1 非流动负债、减值准备和预提费用288.1 137.0 金融负债(24+25)其它负债(24) 14.7 18.2 养老金和类似债务(22) 73.4 121.7 递延所得税负债(5) 24.5 65.3400.7 342.2 流动负债246.5 22.5金融债务(24+25)贸易应付款项(24) 171.7 274.6 预收款项(24) 52.3 78.3 建造合同债务(24) 132.7 247.6 应付关联公司款项(24) 0.1 0.1 应付所得税(24) 7.1 24.9 其它负债和递延收益(26) 132.2 290.8 其它减值准备(23) 94.7 150.1597.3 1,088.9 持有待售资产产生的负债–7.3597.3 1,096.21,377.1 1,979.5司”)的总部位于德国奥格斯堡,公司已根据在资产负布的《国际财务报告准则》编制了2014年12月31含所有有效的国际会计准则。
单选(股利发放率)是普通股股利与每股收益的比值,反映普通股股东从每股的全部获利中分到多少。
(结构百分比资产负债表)反映了同一报表内有关项目之间的比例关系以及各项目相对重要性。
(经营活动)产生的现金流量最能反映企业获取现金的能力。
(净资产收益率)是反映盈利能力的核心指标。
(每股经营活动现金流量)不属于财务弹性分析。
(每股账面价值)是指股东权益总额减去优先股权益后的余额与发行在外的普通股评价股数的比值。
(审计报告)本身并不产生任何关于企业财务状况和经营成果的信息,但是可以增加财务信息的可信性。
(投资分析)目的是选择未来具有优良业绩和成长性的投资对象。
(无法表示意见)的审计报告可读性最差,很难用来帮助报表使用者分析企业的财务状况、经营成果和现金流量。
(盈利能力分析)是财务分析中最重要的一部分。
(营运能力分析)主要是指企业资产运用、循环的效率高低。
(预期三个月内短期证券的买卖)不属于企业的投资活动。
(长期股权卖出)不属于企业的投资活动.A处理设备B长期股权卖出C长期债权的购入D.预期三个月内短期证券的买卖(主营业务利润)的增长是企业营业利润增长的主体。
(综合分析)是对企业的各个方面进行系统、全面的分析,从而对企业的财务状况和经营成果做出整体的评价与判断。
(总资产报酬率)可以用来反映企业的财务效益。
(总资产报酬率)指标越高,说明企业资产的运用效率越好,也意味着企业的资产盈利能力越强。
“财务绩效定量评价指标用于综合评价企业财务会计报表所反映的经营绩效状况。
”此处的经营绩效状况不包括(C)。
A.企业盈利能力状况;B. D.企业经营增长状况”对此理解不正确的是(A )产权比率反映了债权人提供的资本与股东提供的资本的相对关系;C.“从各个视角对企业赚取利润的能力进行定量分析和定性分析”指的是(D )“以各种方式把一个或多个信息关联在一起的信息结构,是客观世界规律的总结””符合上述条件的指标是(D )。
A.;”对此,下列判断错误的是(D )。

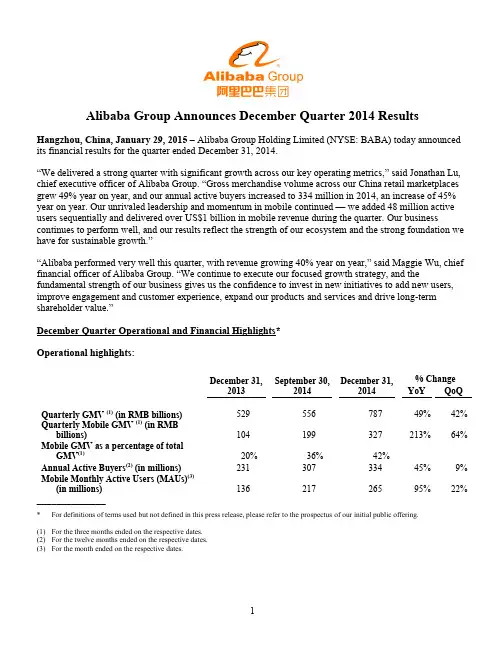
Alibaba Group Announces December Quarter 2014 Results Hangzhou, China, January 29, 2015– Alibaba Group Holding Limited (NYSE: BABA) today announced its financial results for the quarter ended December 31, 2014.“We delivered a strong quarter with significant growth across our key operating metrics,” said Jonathan Lu, chief executive officer of Alibaba Group. “Gross merchandise volume across our China re tail marketplaces grew 49% year on year, and our annual active buyers increased to 334 million in 2014, an increase of 45% year on year. Our unrivaled leadership and momentum in mobile continued — we added 48 million active users sequentially and delivered over US$1 billion in mobile revenue during the quarter. Our business continues to perform well, and our results reflect the strength of our ecosystem and the strong foundation we have for sustainable growth.”“Alibaba performed very well this quarter, with revenue growing 40% year on year,” said Maggie Wu, chief financial officer of Alibaba Group. “We continue to execute our focused growth strategy, and the fundamental strength of our business gives us the confidence to invest in new initiatives to add new users, improve engagement and customer experience, expand our products and services and drive long-term shareholder value.”December Quarter Operational and Financial Highlights*Operational highlights:December 31,2013 September 30,2014December 31,2014% ChangeYoY QoQQuarterly GMV (1) (in RMB billions)529 556 787 49% 42% Quarterly Mobile GMV (1) (in RMBbillions)104 199 327 213% 64% Mobile GMV as a percentage of totalGMV(1)20% 36% 42%Annual Active Buyers(2) (in millions)231 307 334 45% 9% Mobile Monthly Active Users (MAUs)(3)(in millions) 136 217 265 95% 22% ______________* For definitions of terms used but not defined in this press release, please refer to the prospectus of our initial public offering.(1)For the three months ended on the respective dates.(2)For the twelve months ended on the respective dates.(3)For the month ended on the respective dates.Financial highlights:Three months ended December 31,2013 2014RMB RMB US$⑤YoY % Change(in millions, except percentages and per shareamounts)Revenue18,745 26,179 4,219 40% Mobile Revenue 1,171 6,420 1,035 448% Income from Operations 8,801 9,347 1,506 6%Non-GAAP EBITDA⑤⑤11,246 15,103 2,434 34%Non-GAAP EBITDA Margin⑤⑤60% 58% 58%Net Income 8,357 5,983 964 (28%)⑤⑤⑤Non-GAAP Net Income⑤⑤10,463 13,115 2,114 25% Diluted Earnings per Share/ADS(EPS) 3.55 2.29 0.37 (35%)⑤⑤⑤Non-GAAP Diluted EPS⑤⑤ 4.45 5.05 0.81 13%_______________⑤This release contains translation of certain Renminbi (“RMB”) amounts into U.S. dollars (“US$”) for the convenience of the reader, unlessotherwise stated, all translations of RMB into US$ were made at RMB6.2046 to US$1.00, the exchange rate set forth in the H.10 statistical release of the Federal Reserve Board on December 31, 2014. The percentages stated in this release are calculated based on the RMB amounts.⑤⑤See the sections entitled “Non-GAAP Financial Measures” and “Reconciliati on of Non-GAAP Measures to the Nearest Comparable GAAPMeasures” for more information about the non-GAAP measures referred to within this release.⑤⑤⑤D ecrease primarily due to an increase in share-based compensation expense, a one-time charge for financing-related fees and an increase inincome tax expenses in the quarter ended December 31, 2014, as discussed in detail below.GMV –GMV transacted on our China retail marketplaces in the quarter ended December 31, 2014 wasRMB787 billion (US$127 billion), an increase of 49% compared to the same quarter of 2013, and compared to RMB556 billion in the quarter ended September 30, 2014, representing a net addition of RMB231 billion GMV in three months. GMV transacted on Taobao Marketplace in the quarter ended December 31, 2014 was RMB494 billion (US$80 billion), an increase of 43% compared to the same quarter of 2013. GMV transacted on Tmall in the quarter ended December 31, 2014 was RMB293 billion (US$47 billion), an increase of 60% compared to the same quarter of 2013. The GMV growth was primarily driven by an increase in the number of active buyers and also partially attributable to category expansion, for example, auction transactions. On November 11, 2014, our Singles Day promotion generated GMV settled through Alipay of RMB57 billion (US$9.2 billion) on our China and international retail marketplaces within a 24-hour period, an increase of 58% compared to the Singles Day in 2013.Mobile GMV –Mobile GMV in the quarter ended December 31, 2014 was RMB327 billion (US$53 billion), an increase of 213% compared to the same quarter of 2013. Mobile GMV accounted for 42% of total GMV transacted on our China retail marketplaces in this quarter, compared to 36% in the quarter ended September 30, 2014 and 20% in the same quarter of 2013. The growth was primarily driven by an increase in the monthly active users accessing our platforms through mobile devices and an increase in the level of their spending.Annual active buyers–Our China retail marketplaces had 334 million annual active buyers in the twelve months ended December 31, 2014, compared to 307 million in the twelve months ended September 30, 2014 and 231 million in the twelve months ended December 31, 2013, representing an increase of 45% compared to the same period in 2013. The growth in annual active buyers was driven by an increase in active buyers throughout China, with substantially faster growth from lower tier cities.Mobile MAUs–Mobile MAUs grew to 265 million in the month ended December 31, 2014, compared to 217 million in the month ended September 30, 2014, representing a record high net addition of 48 million MAUs in three months, and a 95% increase from 136 million in the month ended December 31, 2013. According to iResearch, our Mobile Taobao App continues to be the No. 1 e-commerce app in China, demonstrating our ability to attract mobile users with strong purchasing intent on a large scale.Revenue–Revenue increased by 40% to RMB26,179 million (US$4,219 million) in the quarter ended December 31, 2014, compared to RMB18,745 million in the same quarter of 2013. Revenue from the China commerce retail business increased by 32% to RMB21,275 million (US$3,429 million), compared toRMB16,149 million in the same quarter of 2013, mainly driven by the growth in commission revenue and online marketing services revenue. Mobile revenue from the China commerce retail business increased by 448% to RMB6,420 million (US$1,035 million) in the quarter ended December 31, 2014, compared to RMB1,171 million in the same quarter of 2013, primarily due to a greater proportion of GMV generated on mobile devices and an increase in the mobile monetization rate.Income from operations – Income from operations in the quarter ended December 31, 2014 was RMB9,347 million (US$1,506 million), an increase of 6% compared to RMB8,801 million in the same quarter of 2013. Operating income growth was lower than revenue growth primarily due to an increase in share-based compensation expense (as discussed in “Share-based compensation expense” below).Non-GAAP EBITDA–Non-GAAP EBITDA increased by 34% to RMB15,103 million (US$2,434 million) in the quarter ended December 31, 2014, compared to RMB11,246 million in the same quarter of 2013. Non-GAAP EBITDA margin was 58% in the quarter ended December 31, 2014, compared to 60% in the December quarter of 2013. The year-on-year decrease in non-GAAP EBITDA margin was primarily due to the consolidation of newly acquired businesses, mainly UCWeb Inc., or UCWeb, and AutoNavi Holding Limited, or AutoNavi, and investments in new business initiatives, such as our mobile operating system, local services and digital entertainment. The quarter-on-quarter increase in non-GAAP EBITDA margin from 51% in the quarter ended September 30, 2014 was primarily due to operating leverage in this seasonally strong quarter.Net income –Our net income in the quarter ended December 31, 2014 was RMB5,983 million (US$964 million), a decrease of 28% compared to RMB8,357 million in the same quarter of 2013. The decrease was primarily due to (i) an increase in share-based compensation expense (including the effect of “mark-to-market” accounting of share-based awards in an amount of RMB1,494 million (US$241 million)) (as discussed in “Share-based compensation expense” below), (ii) an RMB830 million (US$134 million) one-time charge for financing-related fees as a result of the early repayment of our US$8 billion bank borrowings (as discussed in “Interest expense” below), and (iii) an increase in income tax expenses, primarily due to the expiration of an enterprise income tax (“EIT”) exemption period for one of our major subsidiaries (as discussed in “Income tax expenses” below).Non-GAAP net income–Non-GAAP net income increased by 25% to RMB13,115 million (US$2,114 million) in the quarter ended December 31, 2014, compared to RMB10,463 million in the same quarter of 2013.Diluted EPS and non-GAAP diluted EPS –Diluted EPS in the quarter ended December 31, 2014 was RMB2.29 (US$0.37) on 2,588 million diluted shares outstanding, a decrease of 35% compared to RMB3.55 on 2,343 million diluted shares outstanding in the same quarter of 2013. Non-GAAP diluted EPS in the quarter ended December 31, 2014 was RMB5.05 (US$0.81) on 2,588 million diluted shares outstanding, an increase of 13% compared to RMB4.45 on 2,343 million diluted shares outstanding in the same quarter of 2013. The lower non-GAAP diluted EPS growth rate relative to non-GAAP net income growth rate was due to an increase in number of diluted shares outstanding in the quarter ended December 31, 2014 following the completion of our initial public offering in September 2014.December Quarter Financial ResultsRevenue –Revenue for the quarter ended December 31, 2014 was RMB26,179 million (US$4,219 million), an increase of 40% compared to RMB18,745 million in the same quarter of 2013. The increase was mainly driven by the continuing rapid growth of our China commerce retail business. The following table sets forth a breakdown of our revenue for the periods indicated.Three months ended December 31,2013 2014RMB% ofRevenue RMB US$% ofRevenueYoYChange (in millions, except percentages)China commerceRetail 16,149 86% 21,275 3,429 82% 32% Wholesale 612 3% 860 139 3% 41% Total China commerce 16,761 89% 22,135 3,568 85% 32% International commerceRetail 264 2% 554 89 2% 110% Wholesale 1,000 5% 1,209 195 5% 21% Total international commerce 1,264 7% 1,763 284 7% 39% Cloud computing and Internetinfrastructure 196 1% 362 58 1% 85% Others 524 3% 1,919 309 7% 266% Total 18,745 100% 26,179 4,219 100% 40% China commerce retail business –Revenue from our China commerce retail business in the quarter ended December 31, 2014 was RMB21,275 million (US$3,429 million), or 82% of total revenue, an increase of 32% compared to RMB16,149 million in the same quarter of 2013. The increase was mainly driven by the growth in commission revenue and online marketing services revenue. Commissionrevenue accounted for 37% of China commerce retail revenue in the quarter ended December 31, 2014, compared to 30% in the same quarter of 2013. Revenue growth during this period occurred in the context of and reflected an increase of 49% in GMV transacted on our China retail marketplaces, which was primarily driven by a 45% increase in the number of active buyers.The lower revenue growth relative to GMV growth was mainly a result of (i) the higher percentage of total GMV contributed by mobile GMV, which has a lower monetization rate compared to the non-mobile monetization rate, and (ii) lower pay-for-performance (“P4P”) monetization on the personal computer (“PC”) interface compared to the same quarter of 2013. The lower P4P monetization on PC was primarily caused by our continued efforts to improve user experience, which adversely affected cost per click. Our strong momentum in mobile and commitment to improving user experience may slow the growth rate of our online marketing services revenue in the near term, but we believe they will create significant value for both our users and our business in the longer term.Mobile revenue from the China commerce retail business in the quarter ended December 31, 2014 was RMB6,420 million (US$1,035 million), an increase of 448% compared to RMB1,171 million in the same quarter of 2013, representing 30% of our China commerce retail business revenue, compared to 29% in the quarter ended September 30, 2014 and 7% in the same quarter of 2013. The increase in mobilerevenue from the China commerce retail business was primarily due to a greater proportion of GMV generated on mobile devices and an increase in the mobile monetization rate.∙China commerce wholesale business –Revenue from our China commerce wholesale business in the quarter ended December 31, 2014 was RMB860 million (US$139 million), an increase of 41% compared to RMB612 million in the same quarter of 2013. The increase was due to an increase in average revenue from paying members and an increase in paying members.∙International commerce retail business –Revenue from our international commerce retail business in the quarter ended December 31, 2014 was RMB554 million (US$89 million), an increase of 110%compared to RMB264 million in the same quarter of 2013. The increase was primarily due to an increase in GMV transacted on AliExpress, partially attributable to AliExpress’ participation in our Singles Day promotion campaign on November 11, 2014 for the first time.∙International commerce wholesale business –Revenue from our international commerce wholesale business in the quarter ended December 31, 2014 was RMB1,209 million (US$195 million), an increase of 21% compared to RMB1,000 million in the same quarter of 2013. The main reason for this increase was an increase in the number of paying members and an increase in average revenue from payingmembers.∙Others –Other revenue in the quarter ended December 31, 2014 was RMB1,919 million (US$309 million), an increase of 266% compared to RMB524 million in the same quarter of 2013. This increase was primarily due to the consolidation of revenue from acquired business (mainly UCWeb and AutoNavi) and an increase in interest income generated by our SME loan business. When the restructuring of our relationship with Ant Financial closes, which we expect in the March 2015 quarter, we will no longer consolidate revenue generated by the SME loan business in our financial results.Cost of revenue –Cost of revenue in the quarter ended December 31, 2014 was RMB7,520 million(US$1,212 million), or 29% of revenue, compared to RMB4,171 million, or 22% of revenue, in the same quarter of 2013. The increase was primarily due to an increase in share-based compensation expense (as discussed in “Share-based compensation expense” below), an increase in costs associated with our new businesses initiatives, and an increase in payment processing fees resulting from an increase in GMV transacted on our retail marketplaces.Product development expenses – Product development expenses in the quarter ended December 31, 2014 were RMB3,083 million (US$497 million), or 12% of revenue, compared to RMB1,707 million, or 9% of revenue in the same quarter of 2013. The increase was primarily due to an increase in share-based compensation expense (as discussed in “Share-based compensation expense” below). The increase was partially offset by the decrease in royalty fees paid to Yahoo which terminated upon completion of our initial public offering in September 2014.Sales and marketing expenses –Sales and marketing expenses in the quarter ended December 31, 2014 were RMB3,021 million (US$487 million), or 12% of revenue, compared to RMB1,897 million, or 10% of revenue in the same quarter of 2013. The increase was primarily due to an increase in share-based compensation expense (as discussed in “Share-based compensation expense” below). The increase was alsodue to the consolidation of marketing expenses of acquired business (mainly UCWeb and AutoNavi), an increase in advertising and promotional spending mainly to strengthen marketing of our Taobao and Tmall brands, especially in lower tier cities, as well as to promote our new businesses initiatives (e.g., local services) during this quarter.General and administrative expenses – General and administrative expenses in the quarter ended December 31, 2014 were RMB2,419 million (US$390 million), or 9 % of revenue, compared to RMB2,046 million, or 11% of revenue in the same quarter of 2013. The decrease in general and administrative expenses as a percentage of revenue was primarily due to a one-time equity-settled donation expense of RMB1,269 million made in the quarter ended December 31, 2013 relating to the grant of options to purchase 50,000,000 of our ordinary shares to a non-profit organization, which was partially offset by an increase in share-based compensation expense in the quarter ended December 31, 2014 (as discussed in “Share-based compensation expense” below).Share-based compensation expense – Share-based compensation expense included in respective cost or expense items above in the quarter ended December 31, 2014 was RMB4,313 million (US$695 million), or 16% of revenue, an increase of 554% compared to RMB659 million, or 4% of revenue, in the same quarterof 2013. The increase was primarily caused by (1) performance-based and retention grants of share-based awards granted prior to our initial public offering in 2014, with vesting periods of four years for our employees and six years for senior management, (2) the “mark-to-market” accounting of (i) share-based awards we granted to the employees of Zhejiang Ant Small and Micro Financial Services Company Ltd., or Ant Financial, and (ii) Ant Financial’s share-based awards granted by a major shareholding entity of Ant Financial controlled by Jack Ma, our executive chairman, to our employees. The expense arising from such Ant Financial share-based awards granted to our employees represents a non-cash accounting charge to us that will not result in any equity dilution to our shareholders. Without the effect of such “mark-to-market” accounting, our share-based compensation expense would have been RMB2,819 million (US$454 million) in the quarter ended December 31, 2014, compared to RMB2,233 million in the quarter ended September 30, 2014. Pursuant to generally accepted accounting principles in the United States, we are required to perform such re-measurement at each period end. Accordingly, we expect that our share-based compensation expense will continue to be affected by changes in the fair value of our share-based awards as well as the fair value of Ant Financial’s share-based awards granted to our employees.Amortization of intangible assets – Amortization of intangible assets in the quarter ended December 31, 2014 was RMB614 million (US$99 million), a significant increase from RMB123 million in the same quarter of 2013. This increase was due to an increase in intangibles assets primarily as a result of our strategic acquisitions, mainly UCWeb and AutoNavi.Income from operations – Income from operations in the quarter ended December 31, 2014 was RMB9,347 million (US$1,506 million), an increase of 6% compared to RMB8,801 million in the same quarter of 2013. The lower growth of operating income relative to revenue growth in this quarter and the decrease in operating margin to 36% in the quarter ended December 31, 2014 from 47% in the same quarter of 2013 were primarily due to an increase in share-based compensation expense (as discussed in “Share-based compensation expense” above).Non-GAAP EBITDA – Non-GAAP EBITDA increased by 34% to RMB15,103 million (US$2,434 million) in the quarter ended December 31, 2014, compared to RMB11,246 million in the same quarter of 2013.Non-GAAP EBITDA margin was 58% in the quarter ended December 31, 2014, compared to 60% in the December quarter of 2013. The year-on-year decrease in non-GAAP EBITDA margin was primarily due to the consolidation of newly acquired businesses, mainly UCWeb and AutoNavi, and investments in new business initiatives, such as our mobile operating system, local services and digital entertainment. Thequarter-on-quarter increase in non-GAAP EBITDA margin from 51% in the quarter ended September 30, 2014 was primarily due to operating leverage in this seasonally strong quarter. A reconciliation of operating income to non-GAAP EBITDA is included at the end of this release.Interest and investment income, net – Interest and investment income, net in the quarter ended December 31, 2014 was RMB313 million (US$51 million), an increase of 6% compared to RMB296 million in the same quarter of 2013. The increase was primarily due to an increase in interest income as a result of higher cash balance during the period, which in turn was primarily due to the proceeds from our initial public offering in September 2014 and an increase in operating cash flow. This increase was partially offset by an increase in impairment charge of cost-method investments and losses recognized with respect to the periodic revaluation of convertible bonds we held in connection with our strategic investments in publicly traded entities.Interest expense –Interest expense in the quarter ended December 31, 2014 was RMB1,344 million(US$216 million), an increase of 247% compared to RMB387 million in the same quarter of 2013. The increase was primarily due to an RMB830 million (US$134 million) one-time charge for financing-related fees as a result of the early repayment of our US$8 billion bank borrowings with proceeds from our issuance of US$8 billion senior unsecured notes in this quarter.Other income, net –Other income, net in the quarter ended December 31, 2014 was RMB901 million (US$145 million), an increase of 64% compared to RMB548 million in the same quarter of 2013. The increase was primarily due to an increase of RMB101 million (US$16 million) in royalty fees and software technology service fees received from Ant Financial to RMB344 million (US$55 million) in the quarter ended December 31, 2014 from RMB243 million in the same quarter of 2013 as a result of an increase in pre-tax income of Ant Financial, as well as an increase in government grants received from central and local governments in connection with our contribution to technology development and investments in local business districts.Income tax expenses – Income tax expenses in the quarter ended December 31, 2014 were RMB2,429 million (US$392 million), an increase of 228% compared to RMB741 million in the same quarter of 2013. The increase was primarily due to the increase in taxable income from our operations in China. Our effective tax rate increased to 26% in the quarter ended December 31, 2014 from 8% in the same quarter of 2013. Excluding share-based compensation expense, impairment of goodwill, intangible assets and investments, and unrealized gain/loss on investments which are not deductible or assessable for income tax purposes, our effective tax rate would have been 17% in the quarter ended December 31, 2014, compared to 7% in the same quarter of 2013. The increase was primarily due to the expiration of an EIT exemption period for one of our major subsidiaries, upon which the subsidiary became subject to an EIT rate of 12.5% (or 50% of the statutory EIT rate) in calendar year 2014.Net income and non-GAAP net income –As a result of the foregoing, our net income in the quarter ended December 31, 2014 was RMB5,983 million (US$964 million), a decrease of 28% compared to RMB8,357 million in the same quarter of 2013. Excluding the effects of share-based compensation expense, impairment of goodwill and investment in equity investees, the one-time charge for financing-related fees, amortization of intangible assets and certain other items, non-GAAP net income in the quarter ended December 31, 2014 was RMB13,115 million (US$2,114 million), an increase of 25% compared to RMB10,463 million in the same quarter of 2013. A reconciliation of net income to non-GAAP net income is included at the end of this release.Net income attributable to ordinary shareholders – Net income attributable to ordinary shareholders in the quarter ended December 31, 2014 was RMB5,936 million (US$957million), a decrease of 28% compared to RMB8,266 million in the same quarter of 2013.Diluted EPS and non-GAAP diluted EPS –Diluted EPS in the quarter ended December 31, 2014 was RMB2.29 (US$0.37) on 2,588 million diluted shares outstanding, a decrease of 35% compared to RMB3.55 on 2,343 million diluted shares outstanding in the same quarter of 2013. Excluding the effects of share-based compensation expense, impairment of goodwill and investment in equity investees, the one-time charge for financing-related fees, amortization of intangible assets and certain other items, non-GAAP diluted EPS in the quarter ended December 31, 2014 was RMB5.05 (US$0.81), an increase of 13% compared to RMB4.45 in the same quarter of 2013. The lower non-GAAP diluted EPS relative to non-GAAP net income growth rate was due to an increase in the number of diluted shares outstanding in the quarter ended December 31, 2014 following the completion of our initial public offering. A reconciliation of diluted EPS to the non-GAAP diluted EPS is included at the end of this release.Cash –As of December 31, 2014, cash, cash equivalents and short-term investments were RMB130,741 million (US$21,071 million), compared to RMB43,632 million as of March 31, 2014.Cash flow from operating activities and free cash flow – Net cash provided by operating activities in the quarter ended December 31, 2014 was RMB19,408 million (US$3,128 million), an increase of 30% compared to RMB14,922 million in the same quarter of 2013. Capital expenditures in the quarter ended December 31, 2014 were RMB1,513 million (US$244 million), compared to RMB1,601 million in the same quarter of 2013. Capital expenditures in the quarter ended December 31, 2014 included cash outflow for acquisition of land use rights and construction in progress of RMB291 million (US$47 million). Free cash flow, a non-GAAP measurement of liquidity, in the quarter ended December 31, 2014 was RMB22,924 million (US$3,695 million), an increase of 34% compared to RMB17,163 million in the same quarter of 2013. A reconciliation of net cash provided by operating activities to free cash flow, a non-GAAP measure of liquidity, is included at the end of this release.Net cash used in investing activities – During the quarter ended December 31, 2014, net cash used in investing activities of RMB4,817 million (US$776 million) mainly included disbursements for short-term investments of RMB1,944 million (US$313 million), capital expenditure of RMB1,513 million (US$244 million) as well as investment and acquisition activities of RMB2,657 million (US$428 million) primarily in mobile and logistics related businesses.Employee number – As of December 31, 2014, we had a total of 34,081 employees, compared to 33,239 as of September 30, 2014 and 20,884 as of December 31, 2013.Webcast and Conference Call InformationA live webcast of the earnings conference call, which will be held shortly following the release of this announcement, can be accessed at /en/ir/earnings. An archived webcast will be available through the same link following the call. A replay of the conference call will be available for one week (dial-in number: +1 646-254-3697; conference ID: 65377381).Please visit Alibaba Group’s Investor Relations website at /en/ir/home on January 29, 2015 to view the earnings release and accompanying slides prior to the conference call.About Alibaba Group。
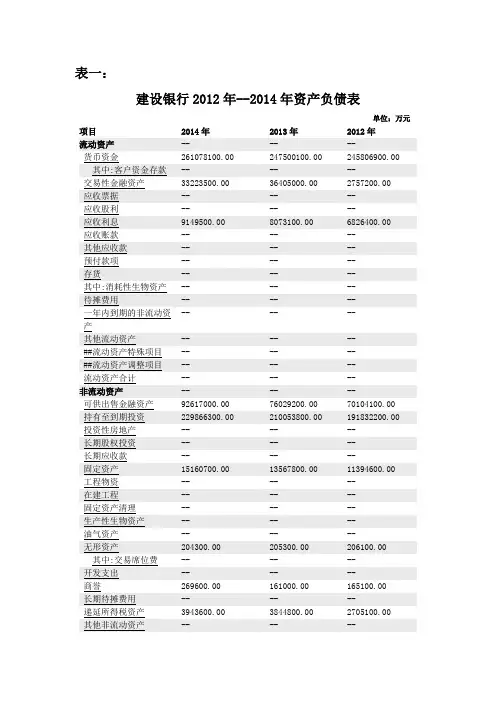
表一:建设银行2012年--2014年资产负债表单位:万元项目2014年2013年2012年流动资产-- ----货币资金261078100.00 247500100.00245806900.00其中:客户资金存款-- ----交易性金融资产33223500.00 36405000.002757200.00应收票据-- ----应收股利-- ----应收利息9149500.00 8073100.006826400.00应收账款-- ----其他应收款-- ----预付款项-- ----存货-- ----其中:消耗性生物资产-- ----待摊费用-- ----一年内到期的非流动资-- ----产其他流动资产-- ----##流动资产特殊项目-- ----##流动资产调整项目-- ----流动资产合计-- ----非流动资产-- ----可供出售金融资产92617000.00 76029200.0070104100.00持有至到期投资229866300.00 210053800.00191832200.00投资性房地产-- ----长期股权投资-- ----长期应收款-- ----固定资产15160700.00 13567800.0011394600.00工程物资-- ----在建工程-- ----固定资产清理-- ----生产性生物资产-- ----油气资产-- ----无形资产204300.00 205300.00206100.00其中:交易席位费-- ----开发支出-- ----商誉269600.00 161000.00165100.00长期待摊费用-- ----递延所得税资产3943600.00 3844800.002705100.00其他非流动资产-- ----##非流动资产特殊项目-- ----##非流动资产调整项目-- ----非流动资产合计-- ----金融类资产-- ----17080100.00 18973700.0021971300.00投资-贷款及应收款项(应收款项类投资)结算备付金-- ----其中:客户备付金-- ----存放同业款项26646100.00 32128600.0058589800.00贵金属4793100.00 3563700.003841900.00拆出资金24852500.00 15206500.0012965300.00衍生金融资产1376900.00 1891000.001267100.00买入返售金融资产27375100.00 28144700.0031668500.00发放贷款和垫款922291000.00 836136100.00730987900.00应收保费-- ----应收代位追偿款-- ----应收分保账款-- ------ ----应收分保未到期责任准备金应收分保未决赔款准备-- ----金-- ----应收分保寿险责任准备金应收分保长期健康险责-- ----任准备金保户质押贷款-- ----定期存款-- ----存出保证金-- ----存出资本保证金-- ----独立账户资产-- ----其他资产2601400.00 2601100.002333500.00资产总计-- ----##资产特殊项目1884200.00 1835500.001859800.00##资产调整项目-- ----资产总计1674413000.00 1536321000.001397282800.00流动负债-- ----短期借款-- ----其中:质押借款-- ----交易性金融负债29600900.00 38038000.003725100.00应付票据-- ----应付账款-- ----应付短期债券-- ----预收款项-- ----应付职工薪酬3453500.00 3408000.003277200.00应付股利-- ----应交税费6264400.00 6020900.005327100.00应付利息18587400.00 15362700.0012321500.00其他应付款-- ----预提费用-- ----递延收益-- ----一年内到期的非流动负-- ----债其他流动负债-- ----##流动负债特殊项目-- ----##流动负债调整项目-- ----流动负债合计-- ----非流动负债-- ----长期借款-- ----应付债券43165200.00 35754000.0026299100.00长期应付款-- ----专项应付款-- ----预计负债706800.00 501400.00505800.00递延所得税负债40100.00 13800.0033200.00其他非流动负债-- ----##非流动负债特殊项目-- ----##非流动负债调整项目-- ----非流动负债合计-- ----金融类负债-- ----向中央银行借款9121600.00 7915700.00628100.00100411800.00 69209500.0097748700.00同业及其他金融机构存放款项拆入资金20240200.00 15591700.0012025600.00衍生金融负债1237300.00 1987200.001154100.00卖出回购金融资产款18152800.00 6187300.00236000.00吸收存款1289867500.00 1222303700.001134307900.00代理买卖证券款-- ----代理承销证券款-- ----存入保证金-- ----预收保费-- ----应付手续费及佣金-- ----应付分保账款-- ----应付赔付款-- ----应付保单红利-- ----保户储金及投资款-- ----未到期责任准备金-- ----未决赔款准备金-- ----寿险责任准备金-- ----长期健康险责任准备金-- ----独立账户负债-- ----其他负债8327200.00 6594200.004738900.00负债合计-- ----##负债特殊项目-- ----##负债调整项目-- ----负债合计1549176700.00 1428888100.001302328300.00所有者权益(或股东权益)-- ----实收资本(或股本)25001100.00 25001100.0025001100.00资本公积13511800.00 13511800.0013521700.00盈余公积13051500.00 10797000.008671800.00未分配利润55870500.00 44408400.0039103400.00减:库存股-- ----一般风险准备16949600.00 15383500.008048300.00外币报表折算差额-- ---481800.00未确认投资损失-- ------ ----其他储备(公允价值变动储备)专项储备-- ------ --302300.00##归属母公司所有者权益特殊项目##归属母公司所有者权-- ----益调整项目归属母公司股东权益合124217900.00 106595100.0094166800.00计少数股东权益1018400.00 837800.00787700.00##所有者权益调整项目-- ----125236300.00 107432900.0094954500.00所有者权益(或股东权益)合计负债和所有者(或股东权-- ----益)总计##负债和权益特殊项目-- ----##负债和权益调整项目-- ----1674413000.00 1536321000.001397282800.00负债和所有者权益(或股东权益)总计表二:建设银行2012--2014利润分配表单位:万元项目2014年2013年2012年营业收入-- -- --一、营业总收入57047000.00 50860800.00 46074600.00营业收入57047000.00 50860800.00 46074600.00利息净收入43739800.00 38954400.00 35320200.00其中:利息收入73912600.00 64625300.00 60324100.00其中:利息支出30172800.00 25670900.00 25003900.00手续费及佣金净收入10851700.00 10428300.00 9350700.00其中:手续费及佣金收11223800.00 10743200.00 9621800.00入372100.00 314900.00 271100.00其中:手续费及佣金支出-- -- --其中:代理买卖证券业务净收入-- -- --其中:证券承销业务净收入-- -- --其中:受托客户资产管理业务净收入已赚保费-- -- --保险业务收入-- -- --其中:分保费收入-- -- --减:分出保费-- -- --提取未到期责任准备-- -- --金其他营业收入1703000.00 797800.00 686700.00##营业收入特殊项目-- -- --##营业收入调整项目-- -- --营业支出-- -- --二、营业总成本27322300.00 23063600.00 21046000.00营业支出27322300.00 23063600.00 21046000.00退保金-- -- --赔付支出-- -- --减:摊回赔付支出-- -- --提取保险责任准备金-- -- --减:摊回保险责任准备-- -- --金保单红利支出-- -- --分保费用-- -- --业务及管理费15982500.00 14869200.00 13456600.00减:摊回分保费用-- -- --保险手续费及佣金支出-- -- --其他营业成本1650400.00 708700.00 562000.00营业成本-- -- --营业税金及附加3498300.00 3164800.00 3023300.00销售费用-- -- --管理费用-- -- --财务费用-- -- --资产减值损失6191100.00 4320900.00 4004100.00 ##营业总成本特殊项目-- -- --##营业总成本调整项目-- -- --特别收益/收入-- -- --三、非经营性净收益-- -- --公允价值变动净收益-26300.00 -132500.00 -66100.00投资净收益602000.00 631800.00 632700.0024500.00 6000.00 2800.00其中:对联营合营企业的投资收益汇兑收益176800.00 181000.00 150400.00 ##非经营性净收益特殊-- -- --项目-- -- --##非经营性净收益调整项目营业利润-- -- --四、营业利润29724700.00 27797200.00 25028600.00加:营业外收入316000.00 273700.00 194100.00减:营业外支出132100.00 90300.00 78800.00-- -- --其中:非流动资产处置净损失加:##影响利润总额的其-- -- --他科目-- -- --加:##影响利润总额的调整项目利润总额-- -- --五、利润总额29908600.00 27980600.00 25143900.00减:所得税费用7083900.00 6468400.00 5783700.00加:未确认的投资损失-- -- ---- -- --加:##影响净利润的其他科目加:##影响净利润的调整-- -- --项目净利润-- -- --六、净利润22824700.00 21512200.00 19360200.0022783000.00 21465700.00 19317900.00归属于母公司所有者的净利润少数股东损益41700.00 46500.00 42300.00##加:影响母公司净利润-- -- --的特殊项目-- -- --##加:影响母公司净利润的调整项目其他综合收益-- -- --七、其他综合收益2370100.00 -2342200.00 -357400.00-- -- --加:##影响综合收益总额的调整项目八、综合收益总额25194800.00 19170000.00 19002800.00归属于母公司所有者的综25123100.00 19128600.00 18958500.00合收益总额71700.00 41400.00 44300.00归属于少数股东的综合收益总额-- -- --加:##影响母公司综合收益总额的调整项目每股收益-- -- --基本每股收益0.00 0.00 0.00稀释每股收益0.00 0.00 0.00表三:建设银行2012--2014现金流量表单位:万元项目2014年2013年2012年一、经营活动产生的现金流量-- ----销售商品、提供劳务收到的现金-- ----收到的税费返还-- ----客户存款和同业存放款项净增加额94765300.00 61301700.00137356200.00向中央银行借款净增加额1160500.00 7311600.00409000.00向其他金融机构拆入资金净增加额3625600.00 3881600.004227800.00收回已核销贷款-- ----收取利息、手续费及佣金的现金83840500.00 73943800.0068520100.00处置交易性金融资产净增加额-- ----回购业务资金净增加额-- ----收到原保险合同保费取得的现金-- ----收到再保业务现金净额-- ----保户储金及投资款净增加额-- ----收到其他与经营活动有关的现金2951700.00 1676500.001078300.00 ##经营活动现金流入特殊项目20852800.00 53483500.005715900.00 ##经营活动现金流入调整项目-- ----经营活动现金流入小计207196400.00 201598700.00217307300.00购买商品、接受劳务支付的现金-- ----支付给职工以及为职工支付的现金9153700.00 8565300.007693200.00支付的各项税费11242200.00 9471400.008769600.00客户贷款及垫款净增加额88315800.00 111643300.00102858800.00存放中央银行和同业款项净增加额18477300.00 3391500.0021206200.00拆出资金净增加额7496900.00 5110800.00618600.00支付手续费及佣金的现金26554200.00 22178800.0020454200.00支付原保险合同赔付款项的现金-- ----支付再保业务现金净额-- ----支付保单红利的现金-- ----支付其他与经营活动有关的现金5824100.00 3383300.006087900.00 ##经营活动现金流出特殊项目8437100.00 33261400.0012737500.00 ##经营活动现金流出调整项目-- ----经营活动现金流出小计175501300.00 197005800.00180426000.00 ##经营活动现金流量净额调整项目-- ----经营活动产生的现金流量净额31695100.00 4592900.0036881300.00二、投资活动产生的现金流量-- ----收回投资收到的现金50366200.00 73016000.0060834500.00取得投资收益收到的现金50400.00 46100.0025000.00203000.00 185100.00120000.00处置固定资产、无形资产和其他长期资产收回的现金净额处置子公司及其他营业单位收到的现-- ----金净额收到其他与投资活动有关的现金-- ----##投资活动现金流入特殊项目-- ----##投资活动现金流入调整项目-- ----投资活动现金流入小计50619600.00 73247200.0060979500.003549000.00 3840600.003493900.00购建固定资产、无形资产和其他长期资产支付的现金投资支付的现金81030400.00 97199800.0073041700.00取得子公司及其他营业单位支付的现428900.00 25000.0029400.00金净额质押贷款净增加额-- ----支付其他与投资活动有关的现金-- ----##投资活动现金流出特殊项目-- ----##投资活动现金流出调整项目-- ----投资活动现金流出小计85008300.00 101065400.0076565000.00 ##投资活动现金流量净额调整项目-- ----投资活动产生的现金流量净额-34388700.00 -27818200.00-15585500.00三、筹资活动产生的现金流量-- ----吸收投资收到的现金13000.00 5100.00333200.00其中:子公司吸收少数股东投资收到13000.00 5100.00333200.00的现金发行债券收到的现金4223800.00 199700.004195100.00取得借款收到的现金-- ----收到其他与筹资活动有关的现金-- ----##筹资活动现金流入特殊项目-- ----##筹资活动现金流入调整项目-- ----筹资活动现金流入小计4236800.00 204800.004528300.00偿还债务支付的现金2250000.00 --556200.008271800.00 7458900.005922000.00分配股利、利润或偿付利息支付的现金其中:子公司支付给少数股东的股利、-- ----利润或偿付的利息支付其他与筹资活动有关的现金-- --128800.00 ##筹资活动现金流出特殊项目-- ----##筹资活动现金流出调整项目-- ----筹资活动现金流出小计10521800.00 7458900.006607000.00 ##筹资活动流量现金净额调整项目-- ----筹资活动产生的现金流量净额-6285000.00 -7254100.00-2078700.00四、现金及现金等价物-- ----汇率变动对现金及现金等价物的影响273100.00 -335300.00-171400.00 ##影响现金及现金等价物的其他科目-- ----##影响现金及现金等价物的调整项目-- ----五、现金及现金等价物净增加额-- ----现金及现金等价物净增加额-8705500.00 -30814700.0019045700.00加:期初现金及现金等价物余额44077300.00 74892000.0055846300.00-- ----##现金及现金等价物净增加额的特殊项目##现金及现金等价物净增加额的调整-- ----项目期末现金及现金等价物余额35371800.00 44077300.0074892000.00将净利润调节为经营活动的现金流量-- ----1.将净利润调节为经营活动现金流量-- ----净利润22824700.00 21512200.0019360200.00加:少数股东损益-- ----加:资产减值准备6191100.00 4320900.004004100.00固定资产折旧1781100.00 1541600.001388900.00无形资产摊销-- ----长期待摊费用摊销-- ----待摊费用减少(减:增加) -- ----预提费用增加(减:减少) -- ----处置固定资产、无形资产和其他长期-10800.00 -16900.00-6700.00资产的损失固定资产报废损失-- ----公允价值变动损失26300.00 132500.0066100.00财务费用-- ----投资损失-- ----递延所得税资产减少-- ----递延所得税负债增加-- ----存货的减少-- ----经营性应收项目的减少-111730500.00 -151394000.00-140096900.00经营性应付项目的增加112335100.00 128168000.00152558600.00其他-- ----278100.00 328600.00-393000.00##(附注)经营活动现金流量净额特殊项目##(附注)经营活动现金流量净额调整-- ----项目(附注)经营活动产生的现金流量净额31695100.00 4592900.0036881300.00 ##加:经营流量净额前后对比调整项-- ----目2.不涉及现金收支的投资和筹资活动-- ----债务转为资本-- ----一年内到期的可转换公司债券-- ----融资租入固定资产-- ----3.现金及现金等价物净变动情况-- ----现金的期末余额35371800.00 44077300.0074892000.00减:现金的期初余额44077300.00 74892000.0055846300.00加:现金等价物的期末余额-- ----减:现金等价物的期初余额-- ----##(附注)现金特殊项目-- ----##(附注)现金调整项目-- ----(附注)现金及现金等价物净增加额-8705500.00 -30814700.0019045700.00 ##加:现金净额前后对比调整项目-- ----。
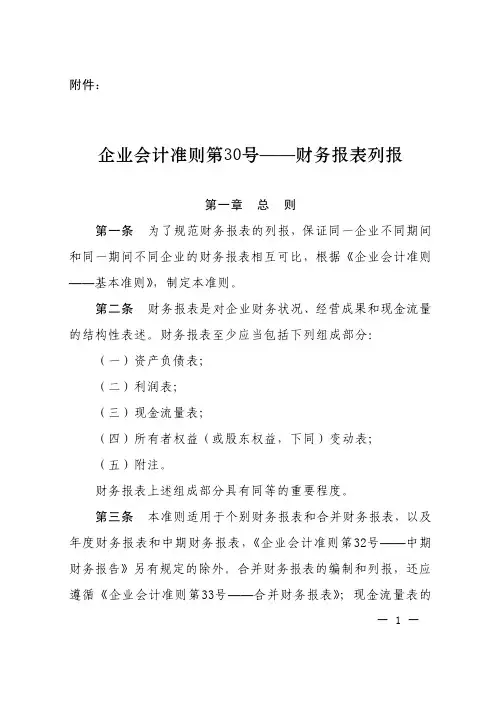
附件:企业会计准则第30号——财务报表列报第一章总则第一条为了规范财务报表的列报,保证同一企业不同期间和同一期间不同企业的财务报表相互可比,根据《企业会计准则——基本准则》,制定本准则。
第二条财务报表是对企业财务状况、经营成果和现金流量的结构性表述。
财务报表至少应当包括下列组成部分:(一)资产负债表;(二)利润表;(三)现金流量表;(四)所有者权益(或股东权益,下同)变动表;(五)附注。
财务报表上述组成部分具有同等的重要程度。
第三条本准则适用于个别财务报表和合并财务报表,以及年度财务报表和中期财务报表,《企业会计准则第32号——中期财务报告》另有规定的除外。
合并财务报表的编制和列报,还应遵循《企业会计准则第33号——合并财务报表》;现金流量表的— 1 —编制和列报,还应遵循《企业会计准则第31号——现金流量表》;其他会计准则的特殊列报要求,适用其他相关会计准则。
第二章基本要求第四条企业应当以持续经营为基础,根据实际发生的交易和事项,按照《企业会计准则——基本准则》和其他各项会计准则的规定进行确认和计量,在此基础上编制财务报表。
企业不应以附注披露代替确认和计量,不恰当的确认和计量也不能通过充分披露相关会计政策而纠正。
如果按照各项会计准则规定披露的信息不足以让报表使用者了解特定交易或事项对企业财务状况和经营成果的影响时,企业还应当披露其他的必要信息。
第五条在编制财务报表的过程中,企业管理层应当利用所有可获得信息来评价企业自报告期末起至少12个月的持续经营能力。
评价时需要考虑宏观政策风险、市场经营风险、企业目前或长期的盈利能力、偿债能力、财务弹性以及企业管理层改变经营政策的意向等因素。
评价结果表明对持续经营能力产生重大怀疑的,企业应当在附注中披露导致对持续经营能力产生重大怀疑的因素以及企业— 2 —拟采取的改善措施。
第六条企业如有近期获利经营的历史且有财务资源支持,则通常表明以持续经营为基础编制财务报表是合理的。
财务报表列报新旧准则对比为了适应社会主义市场经济发展需要,提高企业财务报表列报质量和会计信息透明度,根据《企业会计准则——基本准则》,财政部于2014年1月26日修订并印发了《企业会计准则第30号——财务报表列报》(财会[2014]7号),并规定自2014年7月1日起在所有执行企业会计准则的企业范围内施行,鼓励在境外上市的企业提前执行,对应原准则(财会[2006]3号)同时废止。
解读财务报表列报新准则一、新准则的最大亮点在于修订了“综合收益”的有关内容1、利润表新增“其他综合收益各项目分别扣除所得税影响后的净额”和“综合收益总额”。
综合收益总额等于净利润与其他综合收益扣除所得税影响后的净额的合计金额,反应了企业当期经营总业绩,既包括计入损益的业绩(净利润),也包括未计入损益的业绩(所有者权益),如可供出售金融资产公允价值变动形成的损益;2、将其他综合收益划分为“以后会计期间不能重分类进损益的其他综合收益项目”和“以后会计期间在满足规定条件时将重分类进损益的其他综合收益项目”两类并分别列报;3、所有者权益变动表中“综合收益总额”取代“净利润”和“直接计入所有者权益的利得和损失项目及其总额”;4、在报表附注中新增关于其他综合收益各项目的信息。
二、借鉴国际会计准则,整合原指南和讲解,对财务报表列报准则做了完善性的修订1、企业管理层需评价企业自报告期末起至少12个月的持续经营能力,并指出评价时需考虑的因素;2、提出判断重要性时需考虑的项目性质和金额的要素;3、解释了正常营业周期的概念;4、资产负债表列报项目增加了“被划分为持有待售的非流动资产及被划分为持有待售的处置组中的资产”;5、规定企业应当在附注中披露费用按照性质分类的利润表补充资料,将费用分为耗用的原材料、职工薪酬费用、折旧费用、摊销费用等;6、新增终止经营的披露要求。
企业会计准则第30号——财务报表列报(财会2014年07号)文号:财会[2014]07号《财政部关于印发修订《企业会计准则第30号——财务报表列报》的通知》国务院有关部委、有关直属机构,各省、自治区、直辖市、计划单列市财政厅(局),新疆生产建设兵团财务局,财政部驻各省、自治区、直辖市、计划单列市财政监察专员办事处,有关中央管理企业:为了适应社会主义市场经济发展需要,提高企业财务报表列报质量和会计信息透明度,根据《企业会计准则--基本准则》,我部对《企业会计准则第30号--财务报表列报》进行了修订,现予印发,自2014年7月1日起在所有执行企业会计准则的企业范围内施行,鼓励在境外上市的企业提前执行。
我部于2006年2月25日发布的《财政部关于印发〈企业会计准则第1号--存货〉等38项具体准则的通知》(财会[2006]3号)中的《企业会计准则第30号--财务报表列报》同时废止。
执行中有何问题,请及时反馈我部。
2014-1-26第一章总则第一条为了规范财务报表的列报,保证同一企业不同期间和同一期间不同企业的财务报表相互可比,根据《企业会计准则——基本准则》,制定本准则。
第二条财务报表是对企业财务状况、经营成果和现金流量的结构性表述。
财务报表至少应当包括下列组成部分:(一)、资产负债表;(二)、利润表;(三)、现金流量表;(四)、所有者权益(或股东权益,下同)变动表;(五)、附注。
财务报表上述组成部分具有同等的重要程度。
第三条本准则适用于个别财务报表和合并财务报表,以及年度财务报表和中期财务报表,《企业会计准则第32号——中期财务报告》另有规定的除外。
合并财务报表的编制和列报,还应遵循《企业会计准则第33号——合并财务报表》;现金流量表的编制和列报,还应遵循《企业会计准则第31号——现金流量表》;其他会计准则的特殊列报要求,适用其他相关会计准则。
第二章基本要求第四条企业应当以持续经营为基础,根据实际发生的交易和事项,按照《企业会计准则——基本准则》和其他各项会计准则的规定进行确认和计量,在此基础上编制财务报表。
2014年新修订(颁布)企业会计准则变化及要点归纳自2014年初以来,财政部陆续发布了《企业会计准则第39号——公允价值计量》、《企业会计准则第30号——财务报表列报》、《企业会计准则第9号——职工薪酬》、《企业会计准则第33号——合并财务报表》、《企业会计准则第40号——合营安排》、《企业会计准则第2号——长期股权投资》、《企业会计准则第41号——在其他主体中权益的披露》共七个会计准则,自2014年7月1日起在所有执行企业会计准则的企业范围内施行,鼓励在境外上市的企业提前执行。
其中新修订了CAS2、CAS9、CAS30和CAS33四个准则,新颁布了CAS39、CAS40、CAS41三个准则,通过对比原准则及对新颁布准则的梳理,其变化及要求归纳如下:一、《企业会计准则第2号——长期股权投资》主要变化(一)适用范围变化明确规范权益性投资,即投资方对被投资单位实施控制、重大影响的权益性投资,以及对其合营企业的权益性投资。
不具有控制、共同控制和重大影响的其他投资,适用《企业会计准则第22号——金融工具确认和计量》,不再适用长期股权投资准则的相关规定。
同时明确适用《企业会计准则第22号——金融工具确认和计量》准则的权益投资:1、风险投资机构、共同基金以及类似主体持有的、在初始确认时按照《企业会计准则第22 号——金融工具确认和计量》的规定以公允价值计量且其变动计入当期损益的金融资产;2、投资性主体对不纳入合并财务报表的子公司的权益性投资;3、《企业会计准则第2号——长期股权投资》未予规范的其他权益性投资,即原长期股权投资准则规范的企业持有的不具有控制、共同控制和重大影响的其他投资。
(二)基本概念修订后的合并财务报表准则,以及新发布的合营安排准则,对“控制”、“共同控制”和“合营企业”的定义进行了重新修订,因此,明确在判断“控制”、“共同控制”和“合营企业”时,应按照《企业会计准则第33号——合并财务报表》和《企业会计准则第40号——合营安排》进行判断,《企业会计准则第2号——长期股权投资》仅对“重大影响”的判断进行了规范。
中国工商银行股份有限公司财务报表分析制作人:进击的樱桃荚日期:2014-6-30一、公司概况中国工商银行成立于1984年,是中国最大的商业银行。
通过近年来的改革发展,工商银行已步入质量效益和规模协调发展的轨道。
2005年10月25日,中国工商银行股份有限公司成立。
股份公司由财政部、中央汇金投资有限责任公司发起设立。
业务范围:办理人民币存款、贷款;同业拆借业务;国内外结算;办理票据承兑、贴现、转贴现;各类汇兑业务;代理资金清算;提供信用证服务及担保;代理销售业务;代理发行、代理承销、代理兑付政府债券;代收代付业务;代理证券资金清算业务(银证转账);代理保险业务;代理政策性银行、外国政府和国际金融机构贷款业务;保管箱服务;发行金融债券;买卖政府债券、金融债券;证券投资基金、企业年金托管业务;企业年金受托管理服务、年金账户管理服务;开放式基金的注册登记、认购、申购和赎回业务;资信调查、咨询、见证业务;贷款承诺;企业、个人财务顾问服务;组织或参加银团贷款;外汇存款;外汇贷款;外币兑换;出口托收及进口代收;外汇票据承兑和贴现;外汇借款;外汇担保;发行、代理发行、买卖或代理买卖股票以外的外币有价证券;自营、代客外汇买卖;外汇金融衍生业务;银行卡业务;电话银行、网上银行、手机银行业务;办理结汇、售汇业务;经国务院银行业监督管理机构核准的其他业务。
二、财务报表分析(一)利润表水平分析图1 利润表水平分析从2013年和2012年的利润表中可以看出,2013年的营业利润相比上一年的增长率为9.62%,净利润比前一年增长了10.17%,增长了242.74亿元。
从利润构成上来看,工商银行的盈利能力比前一年提高了。
而2013年工商银行净利润相比上一年增加了10.17%,从分析来看,主要是由于利润总额比上一年增加了9.67%,也就是298.5亿元所引起的。
营业收入5,896.37亿元,增长9.8%,其中利息净收入4,433.35亿元,比上年增加255.07亿元,增长6.1%,占营业收入的75.2%。
2014年新修订(颁布)企业会计准则变化及要点归纳自2014年初以来,财政部陆续发布了《企业会计准则第39号——公允价值计量》、《企业会计准则第30号——财务报表列报》、《企业会计准则第9号——职工薪酬》、《企业会计准则第33号——合并财务报表》、《企业会计准则第40号——合营安排》、《企业会计准则第2号——长期股权投资》、《企业会计准则第41号——在其他主体中权益的披露》共七个会计准则,自2014年7月1日起在所有执行企业会计准则的企业范围内施行,鼓励在境外上市的企业提前执行。
其中新修订了CAS2、CAS9、CAS30和CAS33四个准则,新颁布了CAS39、CAS40、CAS41三个准则,通过对比原准则及对新颁布准则的梳理,其变化及要求归纳如下:一、《企业会计准则第2号——长期股权投资》主要变化(一)适用范围变化明确规范权益性投资,即投资方对被投资单位实施控制、重大影响的权益性投资,以及对其合营企业的权益性投资。
不具有控制、共同控制和重大影响的其他投资,适用《企业会计准则第22号——金融工具确认和计量》,不再适用长期股权投资准则的相关规定。
同时明确适用《企业会计准则第22号——金融工具确认和计量》准则的权益投资:1、风险投资机构、共同基金以及类似主体持有的、在初始确认时按照《企业会计准则第22 号——金融工具确认和计量》的规定以公允价值计量且其变动计入当期损益的金融资产;2、投资性主体对不纳入合并财务报表的子公司的权益性投资;3、《企业会计准则第2号——长期股权投资》未予规范的其他权益性投资,即原长期股权投资准则规范的企业持有的不具有控制、共同控制和重大影响的其他投资。
(二)基本概念修订后的合并财务报表准则,以及新发布的合营安排准则,对“控制”、“共同控制”和“合营企业”的定义进行了重新修订,因此,明确在判断“控制”、“共同控制”和“合营企业”时,应按照《企业会计准则第33号——合并财务报表》和《企业会计准则第40号——合营安排》进行判断,《企业会计准则第2号——长期股权投资》仅对“重大影响”的判断进行了规范。