Getdata使用教程全
- 格式:ppt
- 大小:2.27 MB
- 文档页数:22


getdataids方法getdataids方法详解简介getdataids方法是一种常用的数据获取方法,用于获取特定数据的身份标识。
本文将详细介绍该方法的各种用法。
语法getdataids方法的基本语法如下:getdataids(data, condition)其中,data表示待处理的数据集合,condition表示筛选条件。
基本用法1.获取全部数据的身份标识:getdataids(data, True)这样可以获取data中所有数据的身份标识。
2.获取满足条件的数据的身份标识:getdataids(data, condition)此时,condition可以是一个表达式,也可以是一个函数。
只有满足condition的数据才会被返回其身份标识。
匿名函数用法可以使用匿名函数来灵活定义筛选条件。
例如,筛选data中年龄大于30的数据:getdataids(data, lambda x: x['age'] > 30)这里的lambda函数定义了一个只有一个参数x的函数,其返回值为x[‘age’]是否大于30。
逻辑运算符用法可以使用逻辑运算符来组合筛选条件。
例如,筛选data中年龄大于30且性别为女性的数据:getdataids(data, lambda x: x['age'] > 30 and x['gen der'] == 'female')这里使用了and运算符将两个筛选条件进行了组合。
总结getdataids方法是一种灵活且常用的数据获取方法,可以根据特定的条件获取数据的身份标识。
通过匿名函数和逻辑运算符的运用,可以实现更加复杂的筛选条件。
以上就是关于getdataids方法的详细介绍,希望能对您在创作过程中有所帮助!getdataids方法的高级应用筛选多个条件除了使用逻辑运算符组合多个筛选条件外,还可以使用列表推导式来筛选满足多个条件的数据。

如何使用GetData Digitizer 提取数据
1.打开软件GetDate Graph Digitizer
2.22
2.点击文件选取提取数据的图片,如下(图1)
图1
3.点击“operations-set the scale”或直接点击“图标(图2)”
图2 图标
4.点击后依次点击X轴,设置最小值为0,设置最大值为0,击y轴,设置最小值为0,设置最大值为图上的最大值(图3注意选点,图四已完成坐标轴选定)。
如果中间点错了,需重新设置。
图3 图4 (设置好后的图)
注:以右下角小图为具体点
5.点击“operations-point capture mode”或者点击图标(图5),点击相应的点就会出现数据,如图(6)。
图5 图标
图6 看数据
6. 注意:若不小心删除数据表或图,点击“view-information pane”或“view-magnifier”即可再次出现。


GetData Graph Digitizer用法GetData Graph Digitizer 2.22 Quick Start Step 1 Step 2 Open image file (File=>Open Image). Set the scale by setting four points Xmin, Xmax, Ymin and Ymax, and by assigning logical coordinates to these points ("Xmin value", etc.). To set the scale use Operations=>Set the scale menu or context menu (right mouse button). Picture below illustrates how Xmin, Xmax, etc., can be set in the case of sample graph. Xmin and Xmax are assigned values 20 and 80 respectively, Ymin and Ymax are assigned values 1e+14 and 1e+15. The scale is logarithmic along Y axis, this can be set in "Adjust scale" window under Operations=>Adjust scale menu. Step 3 Digitize graph. Automatically digitize, using one of the two methods. 1) Operations=>Auto trace lines. Choose starting point by clicking left mouse button, or right mouse button to additionally choose direction for line tracing. The same can be done through context menu ("Auto trace lines" item). 2) Operations=>Digitize area. First you will be asked to set grid type, distance between grid lines, and other options. Then choose the area to digitize by holding left mouse button and dragging the grid (in case of rectangular grid hold down Shift to rotate the grid). You can move the grid by holding down Ctrl. Manually digitize, using point capture mode (Operations=>Point capture mode). In this mode data points can be also moved; to move a point first select it with right mouse button, and then set it at a new location by left button. Data points can be also set by double clicking left mouse button in Magnifier window, or Shift + clicking in main window or in Magnifier window. To remove points it is convenient to use eraser tool (Operations=>Data points eraser). Step 4 Copy obtained data to the clipboard (File=>Copy data to buffer or Ctrl+Alt+C) or export to one of the following formats: TXT, XLS, XML, DXF or EPS (File=>Export data). Data can also be copied to buffer directly from Information window (Ctrl+C or Ctrl+INS). Settings for export to the buffer and for export to the text file can be changed in the "Options" window under Settings=>Options menu.GetData 图数字化仪2.22 快速启动步骤1 步骤2 打开图像文件(文件= > 打开图像)。


文章标题:掌握Excel中Get Data按钮的使用技巧在我们日常工作中,Excel是一个必不可少的工具。
它可以帮助我们处理数据、制作图表、进行计算等等。
而Excel中的Get Data按钮更是一个强大的工具,可以帮助我们从外部数据源获取数据并进行分析和处理。
在本文中,我将深入探讨Excel中Get Data按钮的用法,带你一步步领略其强大之处。
1. Get Data按钮的基本介绍让我们来了解一下Get Data按钮的基本概念。
在Excel中,Get Data 按钮位于“数据”选项卡上,它允许我们从各种外部数据源中导入数据,如数据库、文本文件、Web页面等。
使用Get Data按钮,我们可以轻松地获取所需的数据,而无需手动复制粘贴或手动输入,极大地提高了工作效率。
2. Get Data按钮的使用步骤接下来,让我们来了解一下如何使用Get Data按钮。
点击“数据”选项卡上的Get Data按钮,然后选择想要导入的数据源类型,如数据库、文本文件、Web数据等。
在选择数据源类型后,根据实际情况进行各项设置,例如数据库连接信息、文本文件格式、Web页面信息等。
确认设置无误后,即可轻松获取所需的数据。
3. Get Data按钮的高级用法除了基本的数据导入功能外,Get Data按钮还具有一些高级的用法。
通过Get Data按钮可以进行数据清洗、数据转换、数据透视表的创建等操作,帮助我们更好地分析和处理数据。
Get Data按钮还支持数据源的刷新和更新,使得我们能够及时获取最新的数据。
4. 个人观点和理解作为一名资深的Excel使用者,我深刻理解Get Data按钮的重要性和强大之处。
它不仅简化了数据导入的流程,还为我们提供了丰富的数据处理和分析功能,极大地提升了工作效率。
我个人推荐大家在使用Excel时充分利用Get Data按钮,从而更好地管理和利用数据资源。
总结通过本文的介绍,相信大家对Excel中Get Data按钮的用法有了更深入的理解。

维伦的宏指令recipegetdata的使用方法2. 定义变量:在宏指令的开头,声明必要的变量。
使用“Dim” 关键字创建以下变量:```Dim conn As ObjectDim rs As ObjectDim strSQL As StringDim recipeID As Integer```3. 设置数据库连接:接下来,使用以下代码来设置与数据库的连接。
这里假设你使用的是 Microsoft Access 数据库:```Set conn = CreateObject("ADODB.Connection")conn.ConnectionString ="Provider=Microsoft.ACE.OLEDB.12.0;Data Source=[数据库路径];Persist Security Info=False;"conn.Open```注意:你需要将代码中的[数据库路径]替换为实际的数据库路径。
4. 输入食谱ID:使用以下代码来提示用户输入指定的食谱ID,并将其存储在变量 recipeID 中:```recipeID = InputBox("请输入食谱ID")```5.构建SQL查询语句:使用以下代码来根据食谱ID构建SQL查询语句:```strSQL = "SELECT * FROM [食谱表名称] WHERE [食谱ID字段名称] = " & recipeID```注意:你需要将代码中的[食谱表名称]和[食谱ID字段名称]替换为实际的表名和字段名。
6. 执行 SQL 查询:使用以下代码来执行 SQL 查询,并将结果存储在记录集(Recordset)对象 rs 中:```Set rs = conn.Execute(strSQL)```7. 处理查询结果:根据实际需要,可以使用以下代码从记录集 rs 中获取和处理食谱数据:```If Not rs.EOF Then'如果记录集不为空'获取食谱名称Dim recipeName As StringrecipeName = rs("食谱名称字段名称").Value'获取食谱描述Dim recipeDescription As StringrecipeDescription = rs("食谱描述字段名称").Value'获取食谱步骤Dim recipeSteps As StringrecipeSteps = rs("食谱步骤字段名称").Value'...继续获取其他需要的字段'显示食谱数据MsgBox "食谱名称:" & recipeName & vbCrLf & "食谱描述:" & recipeDescription & vbCrLf & "食谱步骤:" & recipeSteps Else'如果记录集为空MsgBox "未找到指定的食谱ID"End If```注意:你需要将代码中的[食谱名称字段名称]、[食谱描述字段名称]、[食谱步骤字段名称]替换为实际的字段名。


一、示例
1、打开Getdata
2、导入图片文件(可导入的图片格式有:.jpg、.tif、.bmp、.pcx)【file】——【Open image】打开下图对话框,选中要打开的图片。
3、设置坐标轴范围
【operation】——【set the scale】
4、确定Xmin、Xmax、Ymin、Ymax的值。
【operation】——【Adjust the scale】可调节Xmin、Xmax、Ymin、Ymax的范围。
5、捕捉数据点
5.1Point capture mode——适用于点折线
【operation】——【point capture mode】
捕捉到的数据点会在右上角显示
5.2 Auto trace lines——适用于连续函数图像【operation】——【auto trace lines】
5.3Digitize area——适用于提取部分函数图像自动捕捉【operation】——【digitize area】拖动网格,选中线条。
6、导出数据
【file】——【Export data】
可导出为下列格式:txt、xlx、xml、eps、dxf
二、工具栏
1、File
2、Operation
Add line:增加一列数据,捕捉另一条线上的数据点。
Set background:设置图片背景颜色。
下拉列表可切换不同线的数据点。
3、View。
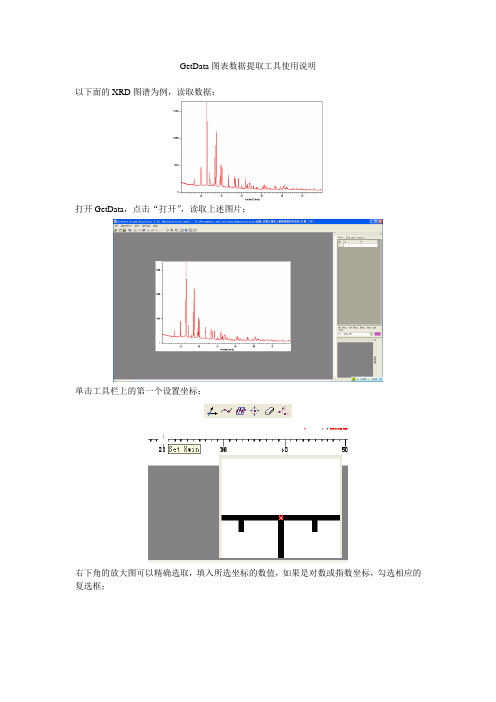
GetData图表数据提取工具使用说明
以下面的XRD图谱为例,读取数据:
打开GetData,点击“打开”,读取上述图片;
单击工具栏上的第一个设置坐标:
右下角的放大图可以精确选取,填入所选坐标的数值,如果是对数或指数坐标,勾选相应的复选框;
单击第三个图标,分别以X轴和Y轴扫描,可以根据需要选取扫面de步长:
扫面后图形如上图所示,单击打开、export data,导出数据,保存为Excel格式
打开刚保存的Excel文件,数据按照X轴排序:
依次数据在Origin中作图,至此图片数字化:
10
20
30
40
50
60
70
80
90
02000
40006000800010000
12000140001600018000B
A
最后,比较一下这两张图片:
A。
GetData Graph Digitizer用法GetData Graph Digitizer 2.22 Quick Start Step 1 Step 2 Open image file (File=>Open Image). Set the scale by setting four points Xmin, Xmax, Ymin and Ymax, and by assigning logical coordinates to these points ("Xmin value", etc.). To set the scale use Operations=>Set the scale menu or context menu (right mouse button). Picture below illustrates how Xmin, Xmax, etc., can be set in the case of sample graph. Xmin and Xmax are assigned values 20 and 80 respectively, Ymin and Ymax are assigned values 1e+14 and 1e+15. The scale is logarithmic along Y axis, this can be set in "Adjust scale" window under Operations=>Adjust scale menu. Step 3 Digitize graph. Automatically digitize, using one of the two methods. 1) Operations=>Auto trace lines. Choose starting point by clicking left mouse button, or right mouse button to additionally choose direction for line tracing. The same can be done through context menu ("Auto trace lines" item). 2) Operations=>Digitize area. First you will be asked to set grid type, distance between grid lines, and other options. Then choose the area to digitize by holding left mouse button and dragging the grid (in case of rectangular grid hold down Shift to rotate the grid). You can move the grid by holding down Ctrl. Manually digitize, using point capture mode (Operations=>Point capture mode). In this mode data points can be also moved; to move a point first select it with right mouse button, and then set it at a new location by left button. Data points can be also set by double clicking left mouse button in Magnifier window, or Shift + clicking in main window or in Magnifier window. To remove points it is convenient to use eraser tool (Operations=>Data points eraser). Step 4 Copy obtained data to the clipboard (File=>Copy data to buffer or Ctrl+Alt+C) or export to one of the following formats: TXT, XLS, XML, DXF or EPS (File=>Export data). Data can also be copied to buffer directly from Information window (Ctrl+C or Ctrl+INS). Settings for export to the buffer and for export to the text file can be changed in the "Options" window under Settings=>Options menu.GetData 图数字化仪2.22 快速启动步骤1 步骤2 打开图像文件(文件= > 打开图像)。

Getdata Dragh Digitizer 图片数据提取软件的使用方法Getdata Dragh Digitizer的使用背景•在科技论文写作过程中,需要将自己的数据和前人成果进行对比。
为了从别人的论文中得到原始数据,往往需要从曲线图中自主提取数据,这就需要用到今天介绍的GetData Graph Digitizer这一款软件。
•我们可以通过设置坐标轴以及刻度大小提取图片上的坐标点,以获取我们所需要的数据。
下面将对该软件的下载及使用流程进行介绍。
Getdata Dragh Digitizer的使用简介•Getdata Dragh Digitizer主要是用来数字化图表、地图等图像类文件,从而得到图像上的点数据,并可以输出成需要的格式。
•支持的图像格式TIFF、JPEG 、PCX 、BMP•输出的数据格式TXT (text file)XLS (Excel)DXF (AutoCAD)EPS (PostScript)XML•简要使用步骤:图像生成与导入坐标选定与调整获取数据输出数据步骤一:图像的生成与导入图像生成1. 扫描纸张上的曲线图,可以直接扫描成Getdata支持的图片2. 截图软件(针对文献里面的曲线图)使用截图软件截图,保存成Getdata支持的图片格式使用Ctrl+ Print Screen,但是这个截出来的是整个桌面上的图片,不是很方便使用QQ截图3. 建议使用QQ截图,使用快捷键Alt+Ctrl+A,用鼠标右键还可以进行简单的编辑步骤二:选定坐标一、缺省选定:set default axes 二、自己设定:set the scale1.Set Xmin 位置Set Xmin 大小2.Set Xmax 位置Set Xmax 大小3.Set Ymin 位置Set Ymin 大小4.Set Ymax 位置Set Ymax 大小三、调整坐标界限Adjust the scale 重新设置X 和Y 的范围步骤一:图像的生成与导入步骤二:选定坐标Set the scale步骤二:选定坐标Set Xmin位置步骤二:选定坐标Set Xmin大小步骤二:选定坐标Set Xmax 位置步骤二:选定坐标Set Xmax大小步骤二:选定坐标Set Ymin位置步骤二:选定坐标Set Ymin大小步骤二:选定坐标Set Ymax位置步骤二:选定坐标Set Ymax大小步骤二:选定坐标调整坐标界限步骤三:获取数据获取数据的三种方法◆Point capture mode◆Auto trace lines◆Digitizer area步骤三:获取数据Point capture mode步骤三:获取数据Point capture mode步骤三:获取数据Auto trace lines 步骤三:获取数据Auto trace lines步骤三:获取数据Auto trace lines右键选取部分数据步骤三:获取数据Auto trace lines右键选取部分数据步骤四:数据的输出与保存数据输出的格式:◆TXT (text file)◆XLS (Excel)◆DXF (AutoCAD)◆EPS (PostScript)◆XML数据的保存:保存为:workspaceGetdata Dragh Digitizer的使用方法谢谢!。