考研英语二图表作文范文及核心词汇(新)
- 格式:doc
- 大小:726.50 KB
- 文档页数:6
考研外语二作文万能模板一、图表作文。
开头段,描述图表内容,引出主题。
According to the chart/table, we can see that…。
As is shown in the diagram…。
The chart/table provides some interesting data/statistics about…。
The diagram illustrates the changes in…over the period from…to…。
The table shows the comparison between…in terms of…。
主体段1,分析数据变化原因。
There are several reasons accounting for this phenomenon. First and foremost,…。
Another contributing factor is that…。
Moreover, the rapid development of…also plays a significant role in…。
In addition, the change in…can be attributed to…。
主体段2,进一步分析数据变化原因。
Furthermore, it should be noted that…。
In addition, the improvement in…is another factor that leads to…。
Besides, the increase/decrease in…can be explained by the fact that…。
结尾段,总结图表内容,提出建议或展望未来。
In conclusion, from the above analysis, we can draw the conclusion that…。
审题三事项:英文指令、数字信息、文字说明1.图表数据本质透析图表归类:折线图——curve/line graph本质变化:趋势柱状图——bar chart/column chart饼图——pie chart表格——table本质排序:对比组合图对比+趋势透析:固定时间段内,相同事物写变化;固定时间点,不同事物写对比或排序2.变化类词汇与句式1.数量单位Dozen/hundred/thousand/million/billion/trillion300——three hundred——hundreds of2.时间点/段In 1990/from 1990 to 1992/since 1990(has been)/after 1992/between 1990 and 1998/during the period from...to.../ten years=a decade3.上升:动词increase,rise(rose),climb,jump,go up,grow,ascend快速上升:surge,shoot(shot)up,boom,soar,leap上升:名词an increase to/by...,a rise,a growth,a jump,a surge,a boom,an upward trend inFrom 1977 to 1980,there was an upward trend in the number of birds.from120 million to the highest point/peak at approximately/about/some 127million.4.下降V.decrease,decline,descend,go down,fall,be reduced,drop,sink(sank),dip,shrink,diminish逐渐变小:dwindle剧烈下降:slump,plungen.a decrease,a decline,a fall,a drop,a slump in,a reduction in,a downward trend in变化程度:原则:形容词修饰名词副词修饰动词、形容词、副词、句子表快速剧烈/明显:sharp/sharply,rapidly,dramatically,drastic/drastically,considerably,remarkably,extremely,strikingly,substantially,enormously,exponentially,significantly,greatly,steeply。
2022年英语二图表作文英文回答:In the diagram, the percentages of vehicles sold in three major categories (A, B, and C) in a particular country are depicted for the years 2018 and 2022. It is evident that while category A sales experienced a significant decline, category B and C sales witnessed a surge in their market shares.In 2018, category A vehicles held the largest market share, accounting for approximately 45%. However, by 2022, this share had plummeted to a mere 20%, indicating a notable drop of 25 percentage points. Conversely, category B witnessed a substantial increase from 30% to 45%, representing a 15 percentage point gain. Category C, which initially held the smallest market share at 25%, saw a remarkable boost to 35% in 2022, marking a 10 percentage point increase.Several factors could potentially explain these shifts in market shares. Changing consumer preferences and advancements in technology may have influenced the decline in category A sales. Meanwhile, the growing demand for eco-friendly and fuel-efficient vehicles could have contributed to the rise in popularity of category B and C vehicles. Furthermore, changing economic conditions and government incentives may also have played a role in shaping these trends.中文回答:该图表描绘了一个特定国家在 2018 年和 2022 年三个主要类别(A、B 和 C)的汽车销量百分比。
考研图表英文作文1. What does the chart show?The chart illustrates the percentage of people who own smartphones in different age groups. It is divided into five age categories, ranging from 18 to 65 years old.2. What is the general trend in smartphone ownership?The general trend in smartphone ownership is that the younger the age group, the higher the percentage of people who own smartphones. For example, the 18-24 age group has the highest percentage of smartphone ownership at 95%, while the 55-65 age group has the lowest at 61%.3. Are there any exceptions to the trend?Yes, there are some exceptions to the trend. In the 45-54 age group, the percentage of smartphone ownership is higher than in the 35-44 age group. This could be due to avariety of factors, such as increased access to technologyor changes in work and social habits.4. What do you think are the reasons for the trend?There are several reasons for the trend of higher smartphone ownership in younger age groups. One reason is that younger people are more likely to be early adopters of new technology. Additionally, smartphones are often seen as a status symbol among young people, and they may be more likely to prioritize purchasing one over other expenses. Finally, younger people tend to be more tech-savvy and may be more likely to use their smartphones for a variety of purposes, such as social media and entertainment.5. Do you think the trend will continue in the future?It is likely that the trend of higher smartphone ownership in younger age groups will continue in the future. As technology continues to advance and become moreintegrated into daily life, younger people will likely continue to be early adopters and prioritize technology intheir spending. However, it is also possible that as older generations become more comfortable with technology, the gap between age groups may begin to narrow.。
考研英语二图画作文The first picture shows a group of people standing in line outside a store, eagerly waiting to buy the latest smartphone. Some are chatting excitedly, while others are checking their phones or looking around impatiently. It seems like everyone is desperate to get their hands on the new gadget.In the second picture, a man is sitting alone in a park, surrounded by nature. He has a relaxed expression on his face as he reads a book, completely immersed in the story. The peaceful atmosphere and the beauty of the surroundings seem to have brought him a sense of calm and contentment.The contrast between these two pictures is striking. On one hand, we see the hustle and bustle of modern life,where people are constantly chasing after the newest and most advanced technology. On the other hand, we have the simplicity and tranquility of a moment spent in nature, away from the distractions of the digital world.It's interesting to think about the different ways in which people seek happiness and fulfillment. Some believe that they can find it in material possessions and thethrill of being the first to own something new. Others find joy in the quiet moments, in connecting with nature and disconnecting from the constant noise of the digital age.Perhaps there's no right or wrong way to pursue happiness. Each person has their own unique path, and what brings joy to one may not necessarily do the same for another. It's a reminder that we all have the freedom to choose our own sources of happiness, whether it's in the latest technology or in the simple pleasures of life.。
2024考研英二作文万能模板一、图表作文。
Nowadays, with the rapid development of economy, the issue of X has aroused wide concern in the public. According to the chart/ graph/ table, it can be observed that X has been on the rise/ decline in recent years. Specifically, in 20XX, the number/ percentage of X reached the highest/ lowest point, which was X. However, in the following years, there was a sharp increase/ decrease, leading to a new figure of X. The reasons for this phenomenon can be explained as follows.To begin with, the primary cause of X is that X. For example, X. In addition, X. Furthermore, X. As a result, X. What's more, X. Last but not least, X. Therefore, X. Consequently, X.In conclusion, based on the above analysis, we can draw a conclusion that X. Therefore, it is of great importance to take effective measures to solve this problem. Only in this way can we X. As far as I am concerned, I believe that X. In this case, X. Only by doing so can we X.二、观点对比类作文。
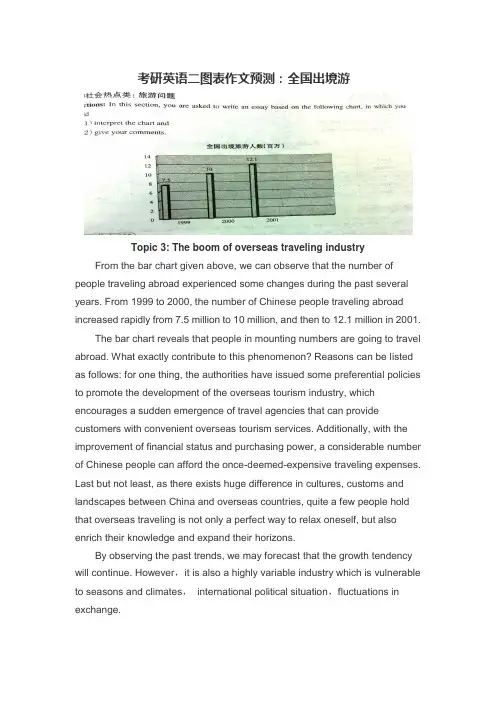
考研英语二图表作文预测:全国出境游Topic 3: The boom of overseas traveling industry From the bar chart given above, we can observe that the number of people traveling abroad experienced some changes during the past several years. From 1999 to 2000, the number of Chinese people traveling abroad increased rapidly from 7.5 million to 10 million, and then to 12.1 million in 2001.The bar chart reveals that people in mounting numbers are going to travel abroad. What exactly contribute to this phenomenon? Reasons can be listed as follows: for one thing, the authorities have issued some preferential policies to promote the development of the overseas tourism industry, which encourages a sudden emergence of travel agencies that can provide customers with convenient overseas tourism services. Additionally, with the improvement of financial status and purchasing power, a considerable number of Chinese people can afford the once-deemed-expensive traveling expenses. Last but not least, as there exists huge difference in cultures, customs and landscapes between China and overseas countries, quite a few people hold that overseas traveling is not only a perfect way to relax oneself, but also enrich their knowledge and expand their horizons.By observing the past trends, we may forecast that the growth tendency will continue. However,it is also a highly variable industry which is vulnerable to seasons and climates,international political situation,fluctuations in exchange.考研英语二图表作文预测:电子商务成交额Global E-commerce turnoverFrom the curve chart given above, we can observe that the turnover of global E-commerce experienced some change during the past several years. From 1997 to 2005, it rose dramatically from 20 billion to 900 billion.The curve chart reveals that the global E-commerce industry enjoys an explosive growth. Quite a few reasons can be listed to account for this phenomenon, and the followings might be the most critical ones: for one thing, the authorities of different countries have issued some preferential policies to protect and encourage the development of E-commerce, thus quite a few online-transaction websites emerge overnight. Moreover, theone-click-payment consumption mode has been widely accepted by the public thanks to the widespread availability of the Internet. Last but not least, people’s decision to purchase on-line can also be put down to the power of so-called “group-dynamics”: when our friends are shopping at network, we will be influenced by them and imitate their behaviors unconsciously.The rapid development of E-commerce signals that new business models contribute largely to the sustainable development of the global economy. However, when enjoying the fruits offered by modern technology, we should also keep an eye on the underlying threat of it. In a world features open boundary, deception and fraud sometime abound. (209 words )考研英语二图表作文预测:职业选择Different job inclination between boys and girls From the bar chart given above, we can find that it reflects the statistics of profession inclination between girls and boys. Most obviously, 40% of boys intend to be a manager, with only 15% of girls choosing this job. When it comes to the profession of teacher, we can observe that 45% of girls prefer to take this job, while the proportion of boys only account for 5%, 40% lower than that of girls.The bar chart informs us of the phenomenon that there exists some difference in profession inclination between boys and girls. What exactly contribute to this phenomenon ? reasons can be listed as follow: for one thing, quite a few boys regard being a manager as a symbol of success. As this profession stands for promising futures, fat pay and competence. Moreover, boys’ decision to be a manager can also be attributed to the power of so-called “group dynamics”: when members of their social network prefer to be a manager after graduation, they are easily influenced and imitate others’ behavior unconsciously or consciously. When it comes to girls, the are more inclined to be a teacher. As this profession features stability and respect. Takesocial and biological factors into account, we know that it is reasonable for girl to choose teacher as their ideal profession goals.Both girls and boys have rights to choose their profession. However, one thing we should bear in mind is that there exists no better or worse, superior or inferior jobs, but suitable and satisfactory ones. (254words)考研英语二作文范文:中国职业的变化The changes of Chinese professionsFrom the pie chart given above, we can observe that the professions structure of Chinese people experienced some changes during the past several years. From 1980 to 1999, the percentage of agricultural professions decreased by 30% from 68% to 38%. During the same period, however, service sectors increased rapidly from 5% to 22%. When it comes to the manufacturing professions, its percentage rose markedly from 27% in 1980 to 40% in 1999.The pie chart reveals the phenomenon that there exists some difference in the development tendency among different professions in China. What exactly contribute to this phenomenon ? reasons can be listed as follows: for one thing, with the rapid process of urbanization, people in mounting numbers, especially youngster, have left their village homes ,moved into big cities and thus been out of agricultural industries. Moreover, quite a few people, especially college graduates hold that it is comparatively easy for them to make more money inthe service industry. When it comes to the manufacturing industry, its transformation might be attributed to the adjustment of industrial structure: the authorities have issued some preferential policies to promote the rapid extension of manufacturing industry, thus, more workforces are required.By observing the change over the past several years, we may forecast that the proportion of professions of service and manufacture will continue to rise. However, a high value should be placed on the development of agricultural industry by the public and the authorities. Otherwise, with the number of people who are engaged in agriculture diminishing, we will one day have nothing to eat! (262words)考研英语二作文范文:快餐和坐下来餐厅发展趋势The development tendency of fast food and sit down restaurantFrom the curve chart given above, we can observe that the number meals of fast food and sitdown restaurant experienced some changes during the past several years. The number of meals of fast food increased slowly from 20 in 1970 to nearly 30 in 1980. From 1980 to 2000, it ascended rapidly from 30 to approximately 90. On the contrary, when observing the statistics of sitdown restaurant meals, we can find that it increased slowly from 20 in 1970 to roughly 50 in 2000.The curve chart informs us of the phenomenon that there exists some difference in the development tendency between fast food and sitdown restaurants. What exactly contribute to this phenomenon? Reasons can be listed as follows: for one thing, with the pace of modern life quickening, people barely have much time to waste in lining up for restaurant meals, on the contrary, fast food meals can do help busy people save a great deal of time. Additionally, the authorities have issued some preferential policies to protect and encourage the rapid extension of fast food industry , thus the public can buy fast food at shops scattering around the city. On the contrary , people in diminishing numbers are willing to eat at sitdown restaurant. They think that eating at restaurant is always time-consuming and inconvenient. Besides, food at restaurant is comparatively expensive than fast food.by observing the trend of the past, we may forecast that the number of fast food meals will continue to rise in the years to come. However, we should also take the detrimental impact of fast food into consideration. Do remember that fast food is one of the main causing factors of diseases such as heart attack, obesity and diabetes.英语二赠送以下资料考研英语作文模板(英语一)大作文考研英语大作文一般是看图写作,从一幅图分析含义及意义,所以只需要几个好的模板,根据题目套上去就行了。
考研英语(二)图表作文经典模板
来源:文都图书
考研英语(二)的大作文图表作文相对考研英语(一)来说是比较简单的,它有一些固定的用语和格式是考生们在考前可以进行速记和运用的。
在此给大家推荐全国知名考研英语辅导老师谭剑波的《考研英语(二)写作考前冲刺万用魔板》,相信会对大家有很大的帮助。
1.Crucial a.关键的;重要的
【单词记忆】词根cruc-来自cross(元音互换,c=s发音相同),-ial 形容词后缀。
Cross本意为“穿过”,也可表示“十字路口”,十字路口是一个很重要的转折点,因此用cross创造出crucial表示“重要”。
【同义替换】critical
【写作例句】doing sth. is crucial to doing sth.如Reading more books is crucial to accumulating knowledge.多读书对知识积累很重要。
2.Significant a.重要的
【单词记忆】sign“记号”,i无意,词根-fic“作”,-ant形容词后缀。
我们在读书的时候,总在重要的地方做记号,因此“做记号”表示“重要的”。
【同义替换】important
【写作例句】sth. is significant 或sth. is of great significance /importance某事想当重要
这本书针对图表作文进行了概述、题型讲解、万用魔板、范文点评和命题预测等五大方面的详细叙述,帮助考生一举拿下图表作文,除此之外,为了在短时间内提高大家的知识储备量,书中还附有图表作文高频核心100词、低端词汇的高端替换和图表作文的常用表达等,非常有用。
最后预祝大家考研顺利,加油!。

2024英语二考研大作文话题预测(必背10篇+选背2篇)目录大作文话题预测第一节必背10篇01图表:高铁发展02图表:燃油车与新能源汽车销量变化03图表:我国老年人口比例04图表:居民日常出行选择05图表:年轻人就餐选择06图表:图书获取渠道07图表:课余时间使用情况08图表:阅读偏好09图画:科技改变习惯(新大纲)10材料作文:奖励式教育(新大纲)第二节选背2篇01图表:中学生近视率02材料作文:课堂上使用手机(新大纲)附录:考研英语(二)写作大纲样题解析大作文话题预测第一节必背10篇Topic01图表:高铁发展Directions:Write an essay based on the chart below.In your writing,you should1)interpret the chart,and2)give your comments.You should write about150words on the ANSWER SHEET.(15points)参考范文范文中加粗的部分为功能句,在其他图表作文中也适用。
This is a line graph that clearly illustrates the significant changes in the high-speed rail mileage and the number of passengers in China from2012to2021.During this period,the mileage ascended dramatically from less than10thousand kilometers to over40thousand kilometers. Meanwhile,the number of passengers also showed a sharp growth,especially from2016to2021, reaching approximately3billion in2021.Such statistics can naturally be associated with the fast development of high-speed trains in China.For one thing,in recent years,China has been characterized by its economic boom and prosperity,which enabled the government to possess an additional budget to invest in constructing infrastructures,including high-speed trains and related facilities.For another,compared with other means of transportation,high-speeds train are faster,more comfortable and safer.Thus,an increasing number of people choose to travel by high-speed trains.To my understanding,it is of great necessity for our government to continue to fund the construction of high-speed railways and other infrastructures,which will bring citizens convenience,arouse their enthusiasm for traveling,and help them create a better life.I believe that if our government does its utmost,the prospects for China will be promising.参考译文这是一个折线图,清晰地展示了2012年至2021年间中国高铁里程和旅客人数的巨大变化。
考研英语二作文模板一、图表作文模板。
Recently, there has been a growing concern over the issue of _______________ (话题). According to the chart/ graph/ table, _______________ (图表内容简述). From the data presented, we can see that _______________ (数据分析).This phenomenon can be attributed to a number of factors. Firstly,_______________ (原因一). In addition, _______________ (原因二). Last but not least, _______________ (原因三).In my opinion, it is high time that we took some effective measures to tackle this problem. For one thing, _______________ (建议一). For another, _______________ (建议二). Only in this way can we _______________ (解决问题的期望结果).In conclusion, _______________ (总结观点). Therefore, we should_______________ (呼吁行动).二、观点对比作文模板。
Nowadays, there is a heated debate on the topic of _______________ (话题). Some people believe that _______________ (观点一). On the other hand, others argue that_______________ (观点二).Those who support the former opinion maintain that _______________ (理由一). Moreover, they claim that _______________ (理由二). However, those who side with the latter opinion hold that _______________ (理由一). What's more, they point out that _______________ (理由二).As far as I am concerned, I am in favor of the latter opinion. This is because_______________ (支持观点二的原因一). Furthermore, _______________ (支持观点二的原因二).In conclusion, _______________ (总结观点). Therefore, we should_______________ (呼吁行动).三、议论文模板。

2025考研英语二核心词汇The year 2025 marks a pivotal moment for postgraduate entrance examination aspirants, as the English II core vocabulary list undergoes a significant update. This new compilation is tailored to meet the evolving demands of the academic landscape.In this edition, the focus is on enhancing thecandidates' ability to comprehend complex academic texts, which is evident in the inclusion of high-level terminology from diverse fields such as economics, technology, and environmental studies.Candidates are advised to familiarize themselves with the nuanced meanings of these core words, as they are often tested in the context of multiple-choice questions, reading comprehension, and essay writing sections.Moreover, the integration of idiomatic expressions and phrasal verbs is a key feature of the 2025 list, aiming to equip test-takers with the linguistic tools necessary for effective communication in academic settings.To excel in the upcoming exams, students are encouraged to engage in regular practice with the new vocabulary, incorporating it into their daily study routines and mock tests.Lastly, the updated list emphasizes the importance of active learning strategies, such as creating flashcards, using mnemonic devices, and participating in group discussions to reinforce memory retention and application.。
The [table \ pie \bar \line chart] above clearly reflects the statistics of [job happiness index of the staff in a certain company] {the market share [of mobile-phone in the developed countries \taken by Japanese car brands]} [several reasons for]:__.as is shown, it is universally acknowledged that [sb have little respect for sth \], [sth still failed to arouse concerns of sb] \{ [sth is becoming more and more vital \sth play a key role] in daily life, commercial activity, network industry, the advertising field ] } \[sth becomes larger year by year] \ {people vary in their purposes \ [reasons for blogging] with age} [the estimated world illiteracy rates differ a lot by gender \region \age \period in the past two \ few years.]The figures of [] has been a [slight \ steady\ dramatic] [rise \ fluctuation \ fall] in the past N years, and the increase of percentage gets greater and greater, obviously. Specifically speaking,所占比率The largest part of [] that accounts for 50%. B be second to A, which makes up 35%. C in third spot, is 7%. It is followed by _ _ _with 9%、4%、and 3%respectively.对应比例During the same period, [] be in proportion to [], and went up rapidly from [] to [][people ranging from 41 to 50 are least pleased with their current situation], accounting for approximately64 percent, comprising the maximum\minimum part in the whole proportion, people over 50 are most pleased with it, at about 40%, meanwhile, the proportions of the personnel feeling hard to say are the same between those who are under 40 and over 50, making up 50%.Female students are more likely to get depressed than male ones, which is twice as much as that of male.Students aged from 25to 29 years having mental diseases are 1.8%apparently higher\ lower than those who are below 25 years old, in addition, they almost have the same possibility to get depressed.占据首末The number of [] that resulted from [ ] [increased \ decreased] sharply 10 percents to 608, which is highlighted on the first row of the table.The lowest rates are in developed countries, with about 1%for males and 2%for females \With a 15 percent rise \ fall.比率变动Among 5.8 billion people round the world, there are 1.1 billion smokers, only accounted for 8%in 2008, while in 2011 it increased significantly to 13%.增减迅猛[] related with [] enjoyed the greatest [soar \ drop], as compared to [_in_] \ as against that of [last year\2004], the figure \ percentage has nearly [one point one times \ one and a half times \ doubled \ tripled \%\20 per thousand.[] decreased dramatically by 10%from 25%in 2008 to 35%in 2009.保持不变As a sharp contrast, that there was only a slow increase in [] during the same period, from_to_.In addition, the rates was almost the same in 2008 and 2009 \there was a small [ rise \ fall] by 5%.波峰波谷Sth fluctuated in the past few years, in 1995, it reached the peak. However, three years later, it dropped to its nadir, reducing \ increasing to__in 1998.第二段By analyzing these data displayed in the table, It is no difficult job for us to come up with the following two reasons for the variation.1. For one thing, the financial \mental or learning pressure from work and family might lead to the decrease of job happiness index foremployees especially \except under the age of50. For another thing, the reason why those who are over 50 have the highest job happiness index is that they have more \less experience \lower capacity to deal with pressure.]2. For one thing, the general improvement of ordinary people’s living standard in the developing countries has made it possible for people to have mobile-phones. For another thing, the market share in the developed country has nearly occupied the whole.3. For one thing, the increasingly fast pace of people’s life today brings dramatic change to the traditional Chinese diet. For another thing, since people spend most of their time engaging in daily office work instead of physical exercise, their physical conditions get worse.The relatively higher rates of females result from complicated factors, such as social, political, economic and conventional factors of the region.The grandmother would like to pay more attention to ihtt than her grandson in the aspect of food.第三段As has been mentioned above, I hold it self-evident that {certain [disturbing \ exciting] changes have taken place in the field, this tendency, in my personal sense, will be going on in a [depressive \ positive] direction.} \ [it is difficult for everyone to be content with their jobs.] \[will become more and more prominent][] by its outstanding advantages, such as stronger interactivity, no limitation of time and place, well-targeted, higher economic character, and more objective, compared with the traditional ones, all of the good sides cause the continuous growth of [its marker scale]. Conversely Speaking, the [merchants \company] should spare no pains to ensure its [reliability \ comfort level \right to education \opportunity to learn], which is the basis of a sound [internet \working] environment.By that time, people will suffer from their own shortsighted behavior. Thus it is essential that countermeasures should be taken immediately so as to halt and reverse the grim situation. First and foremost, [Local] governments at all levels are expected to [tighten relevant laws and regulations of food to severely punish those who [violate traffic rules openly, be they _or_] \[build more facilities \ gymnasiums for citizens to exercise \relax]. Additionally,a widespread education campaign should be launched to inform citizens that [the proper attitude of living\rules are fundamental for them \]. Third and last, [they should try to seek help from the professional in or out of school]\[international organizations must work together to develop a series of plans to protect ocean resources]. It is in those effective approaches that we may obtain some improvements as expectancy.重点词汇:positions complicated political depressive tendency prominent interactivity merchants reliability immediately regulations facilities gymnasium campaign fundamental professional international organizations resources expectancy violate。
2024年考研英语2作文English: In 2024, as we approach the post-pandemic era, the topic of mental health will become increasingly prominent, particularly among graduate students preparing for entrance exams. The pressures of academic competition, combined with the lingering effects of the global health crisis, will result in heightened levels of anxiety and stress. It is crucial for both individuals and institutions to prioritize mental well-being, through initiatives such as counseling services, stress management workshops, and promoting a healthy work-life balance. As future leaders and scholars, graduate students must learn to prioritize their mental health in order to achieve academic success and contribute positively to society.中文翻译: 到了2024年,当我们接近后疫情时代,心理健康这一话题将变得越来越突出,尤其是在备战考研的研究生群体当中。
学术竞争的压力,再加上全球卫生危机的持续影响,将导致焦虑和压力水平加剧。
考研英语二大作文模板柱状图(有规律表格(table))What is illustrated in the bar chart shows clearly that dramatic changes has occurred in respect of 标题。
In the xx years spanning from A through B, the figure of 上升gained from about XX to about XX. As a sharp contrast, the number of 下降shrank slightly/rapidly. From the bar chart, we can also see that the figure of 平稳remained steady.// compared with 小年份,the number is nearly XX times ,as much as that of 大年份. Isolated as the figure seem to be, as a matter of fact, they are connected to one others closely.饼状图What is illustrated in the pie chart shows clearly that dramatic changes has occurred in respect of 标题。
In 2019 ,the total number is divided into 4 parts, with A,B,C and D, making up X%,X%,X% and X% respectively. A has/have the maximum proportion, which is up to 数据. B has/have the minimum proportion, accounting to 数据.// A has/have the maximum proportion,which is up to 数额,while B closely following it. Isolated as the figure seem to be, as a matter of fact, they areconnected to one others closely.双饼图第一个饼的分布,其中项目的增长,降低,不变。
英语作文图表分析范文(汇总30篇)(经典版)编制人:__________________审核人:__________________审批人:__________________编制单位:__________________编制时间:____年____月____日序言下载提示:该文档是本店铺精心编制而成的,希望大家下载后,能够帮助大家解决实际问题。
文档下载后可定制修改,请根据实际需要进行调整和使用,谢谢!并且,本店铺为大家提供各种类型的经典范文,如工作总结、工作计划、合同协议、条据文书、策划方案、句子大全、作文大全、诗词歌赋、教案资料、其他范文等等,想了解不同范文格式和写法,敬请关注!Download tips: This document is carefully compiled by this editor. I hope that after you download it, it can help you solve practical problems. The document can be customized and modified after downloading, please adjust and use it according to actual needs, thank you!Moreover, our store provides various types of classic sample essays for everyone, such as work summaries, work plans, contract agreements, doctrinal documents, planning plans, complete sentences, complete compositions, poems, songs, teaching materials, and other sample essays. If you want to learn about different sample formats and writing methods, please stay tuned!英语作文图表分析范文(汇总30篇)英语作文图表分析范文第1篇图表类写作模版(1)模版1According to the chart / graph / diagram / table, we clearly learn that _________.As early as _________,___________.Then,_________.Last,__________.In contrast, by _________,__________.There are many reasons accounting for _________.Firstly, _________.Secondly,__________.Finally,_________.As a result,_________.As far as I am concerned,_________.For one thing,__________.For another,________.In brief, I hold that__________.(2)模版2What is shown in the chart / graph / diagram / table above indicates that in recent years, more and more people payattention to _________.The number of those who _________has increased ________,and furthermore,____________.There are two factors responsible for the changes.In the first place,_________.Moreover,__________.Yet, it is noticeable that __________.From the analysis, we can safely draw the conclusion that__________.It is possible that in the future,the tendency will__________.(3)模版3As is shown in the chart / graph / diagram / table above,__________has charged drastically in the past _________.While ___________,now the percentage of__________is __________.Meanwhile,the number of _________has soared up to ________.There are mainly two possible reasons contributing to the rapid changes.The first is that _________.Secondly,__________.In my point of view, the changes have a great influence on _________.At the same time,_______.To sum up ,_________.英语作文图表分析范文第2篇1、图形种类及概述法:泛指一份数据图表: a data graph/chart/diagram/illustration/table饼图:pie chart直方图或柱形图:bar chart / histogram趋势曲线图:line chart / curve diagram表格图:table流程图或过程图:flow chart / sequence diagram程序图:processing/procedures diagram2、常用的描述用法The table/chart diagram/graph shows (that)According to the table/chart diagram/graphAs (is)shown in the table/chart diagram/graphAs can be seen from the table/chart/diagram/graph/figures,figures/statistics shows (that)……It can be seen from the figures/statisticsWe can see from the figures/statisticsIt is clear from the figures/statisticsIt is apparent from the figures/statisticstable/chart/diagram/graph figures (that)……table/chart/diagram/graph shows/describes/illustrates how……3、图表中的数据(Data)具体表达法数据(Data)在某一个时间段固定不变:fiXed in time在一系列的时间段中转变:changes over time持续变化的data在不同情况下:增加:increase / raise / rise / go up ……减少:decrease / grow down / drop / fall ……波动:fluctuate / rebound / undulate / wave ……稳定:remain stable / stabilize / level off ……最常用的两种表达法:动词+副词形式(Verb+Adverb form)形容词+名词形式(Adjective+Noun form)英语作文图表分析范文第3篇雅思考试学术类图表作文分析考试学术类图表作文要求考生观察一幅图表并用自己的语言呈现出图表中的信息。
◆条形图表Test 15Directions:In this part, you are to write a composition with Health Improvements in Developing Countries based on the following chart with an analysis of possible reasons for the changes with a length of 150 words or so. Please remember to write clearly.【参考范文】Health Improvements in Developing Countries It can be seen from the graph that in the past three decades, developing countries have made great progress in improving people’s life expectancy and reducing infant mortality.Such an improvement can be clearly seen in the chart which says that the life expectancy in 1960 in developing countries was only 40 years old, but it reached about 60 years old in 1990 and the infant mortality dropped from 20 percent to 10 percent.Obviously, there are at least two factors contributing to such an exciting improvement. To begin with, people’s living conditions have become much better than before since the reform and opening. Nutritious food, better clothes and spacious rooms has ensured longer life. Moreover, the advanced medical technology provides better medical care to both the aged and the newly born either at home or in hospital. Now, many fatal diseases before can be treated.With further development of society, we will have better living conditions and more advanced medical technology in the future. At that time, a much longer life expectancy and a lower rate of infant mortality can be expected.【范文解析】图表显示的是1960年和1990年发展中国家人们的平均寿命和婴儿的死亡率。
考研英语二图表作文预测:全国出境游Topic 3: The boom of overseas traveling industry From the bar chart given above, we can observe that the number of people traveling abroad experienced some changes during the past several years. From 1999 to 2000, the number of Chinese people traveling abroad increased rapidly from 7.5 million to 10 million, and then to 12.1 million in 2001.The bar chart reveals that people in mounting numbers are going to travel abroad. What exactly contribute to this phenomenon? Reasons can be listed as follows: for one thing, the authorities have issued some preferential policies to promote the development of the overseas tourism industry, which encourages a sudden emergence of travel agencies that can provide customers with convenient overseas tourism services. Additionally, with the improvement of financial status and purchasing power, a considerable number of Chinese people can afford the once-deemed-expensive traveling expenses. Last but not least, as there exists huge difference in cultures, customs and landscapes between China and overseas countries, quite a few people hold that overseas traveling is not only a perfect way to relax oneself, but also enrich their knowledge and expand their horizons.By observing the past trends, we may forecast that the growth tendency will continue. However,it is also a highly variable industry which is vulnerable to seasons and climates,international political situation,fluctuations in exchange.考研英语二图表作文预测:电子商务成交额Global E-commerce turnoverFrom the curve chart given above, we can observe that the turnover of global E-commerce experienced some change during the past several years. From 1997 to 2005, it rose dramatically from 20 billion to 900 billion.The curve chart reveals that the global E-commerce industry enjoys an explosive growth. Quite a few reasons can be listed to account for this phenomenon, and the followings might be the most critical ones: for one thing, the authorities of different countries have issued some preferential policies to protect and encourage the development of E-commerce, thus quite a few online-transaction websites emerge overnight. Moreover, theone-click-payment consumption mode has been widely accepted by the public thanks to the widespread availability of the Internet. Last but not least, people’s decision to purchase on-line can also be put down to the power of so-called “group-dynamics”: when our friends are shopping at network, we will be influenced by them and imitate their behaviors unconsciously.The rapid development of E-commerce signals that new business models contribute largely to the sustainable development of the global economy. However, when enjoying the fruits offered by modern technology, we should also keep an eye on the underlying threat of it. In a world features open boundary, deception and fraud sometime abound. (209 words )考研英语二图表作文预测:职业选择Different job inclination between boys and girls From the bar chart given above, we can find that it reflects the statistics of profession inclination between girls and boys. Most obviously, 40% of boys intend to be a manager, with only 15% of girls choosing this job. When it comes to the profession of teacher, we can observe that 45% of girls prefer to take this job, while the proportion of boys only account for 5%, 40% lower than that of girls.The bar chart informs us of the phenomenon that there exists some difference in profession inclination between boys and girls. What exactly contribute to this phenomenon ? reasons can be listed as follow: for one thing, quite a few boys regard being a manager as a symbol of success. As this profession stands for promising futures, fat pay and competence. Moreover, boys’ decision to be a manager can also be attributed to the power of so-called “group dynamics”: when members of their social network prefer to be a manager after graduation, they are easily influenced and imitate others’ behavior unconsciously or consciously. When it comes to girls, the are more inclined to be a teacher. As this profession features stability and respect. Takesocial and biological factors into account, we know that it is reasonable for girl to choose teacher as their ideal profession goals.Both girls and boys have rights to choose their profession. However, one thing we should bear in mind is that there exists no better or worse, superior or inferior jobs, but suitable and satisfactory ones. (254words)考研英语二作文范文:中国职业的变化The changes of Chinese professionsFrom the pie chart given above, we can observe that the professions structure of Chinese people experienced some changes during the past several years. From 1980 to 1999, the percentage of agricultural professions decreased by 30% from 68% to 38%. During the same period, however, service sectors increased rapidly from 5% to 22%. When it comes to the manufacturing professions, its percentage rose markedly from 27% in 1980 to 40% in 1999.The pie chart reveals the phenomenon that there exists some difference in the development tendency among different professions in China. What exactly contribute to this phenomenon ? reasons can be listed as follows: for one thing, with the rapid process of urbanization, people in mounting numbers, especially youngster, have left their village homes ,moved into big cities and thus been out of agricultural industries. Moreover, quite a few people, especially college graduates hold that it is comparatively easy for them to make more money inthe service industry. When it comes to the manufacturing industry, its transformation might be attributed to the adjustment of industrial structure: the authorities have issued some preferential policies to promote the rapid extension of manufacturing industry, thus, more workforces are required.By observing the change over the past several years, we may forecast that the proportion of professions of service and manufacture will continue to rise. However, a high value should be placed on the development of agricultural industry by the public and the authorities. Otherwise, with the number of people who are engaged in agriculture diminishing, we will one day have nothing to eat! (262words)考研英语二作文范文:快餐和坐下来餐厅发展趋势The development tendency of fast food and sit down restaurantFrom the curve chart given above, we can observe that the number meals of fast food and sitdown restaurant experienced some changes during the past several years. The number of meals of fast food increased slowly from 20 in 1970 to nearly 30 in 1980. From 1980 to 2000, it ascended rapidly from 30 to approximately 90. On the contrary, when observing the statistics of sitdown restaurant meals, we can find that it increased slowly from 20 in 1970 to roughly 50 in 2000.The curve chart informs us of the phenomenon that there exists some difference in the development tendency between fast food and sitdown restaurants. What exactly contribute to this phenomenon? Reasons can be listed as follows: for one thing, with the pace of modern life quickening, people barely have much time to waste in lining up for restaurant meals, on the contrary, fast food meals can do help busy people save a great deal of time. Additionally, the authorities have issued some preferential policies to protect and encourage the rapid extension of fast food industry , thus the public can buy fast food at shops scattering around the city. On the contrary , people in diminishing numbers are willing to eat at sitdown restaurant. They think that eating at restaurant is always time-consuming and inconvenient. Besides, food at restaurant is comparatively expensive than fast food.by observing the trend of the past, we may forecast that the number of fast food meals will continue to rise in the years to come. However, we should also take the detrimental impact of fast food into consideration. Do remember that fast food is one of the main causing factors of diseases such as heart attack, obesity and diabetes.英语二。