考研英语二图表作文范文及核心词汇
- 格式:doc
- 大小:723.00 KB
- 文档页数:6
英语二图表作文When tasked with writing an English composition based on a chart, it's essential to follow a structured approach to ensure clarity and coherence. Here's a step-by-step guide to help you craft a well-organized essay:1. Understand the Chart: Begin by thoroughly examining the chart. Identify the type of chart (bar, line, pie, etc.) and the data it represents. Look for trends, comparisons, or contrasts that the chart is designed to highlight.2. Outline the Main Points: Before you start writing, create an outline of the key points you want to cover. This should include an introduction to the chart, a body that discusses the main findings, and a conclusion that summarizes the data.3. Introduction: Start your composition by introducing the chart. Mention what it is about and the source of the data if it's relevant. For example, "The line chart illustrates the fluctuations in the global temperature over the past century, as recorded by the World Meteorological Organization."4. Body Paragraphs: In the body of your essay, discuss the data presented in the chart. Break down the information into paragraphs, each focusing on a specific aspect or trend. Use comparative and superlative language to describe the data accurately. For instance, "The most significant increase in temperature occurred in the 1990s, with an average rise of0.5 degrees Celsius."5. Use Clear and Accurate Language: When describing the chart, use precise language. Avoid vague terms like "a lot" or "some." Instead, use specific numbers and percentages to convey the information. For example, "In 1980, thetemperature was 15.2°C, which rose to 16.1°C by 2010."6. Discuss Trends and Patterns: Analyze any trends orpatterns that emerge from the data. Are there any cycles, steady increases, or sudden drops? Discuss these in relationto the overall data presented.7. Conclusion: Summarize the main points of the chart in your conclusion. Restate the most important findings and, if appropriate, provide a brief analysis of what these might imply. For example, "In conclusion, the chart clearly demonstrates a worrying trend of increasing global temperatures, which underscores the urgency of climate change mitigation strategies."8. Review and Edit: After writing your composition, review it for clarity, coherence, and accuracy. Ensure that your descriptions accurately reflect the data in the chart andthat your language is precise and appropriate for an academic essay.Remember, the goal of an English composition based on a chart is not only to describe the data but also to analyze it and provide insights. Practice makes perfect, so the more youwrite, the better you'll become at interpreting and articulating the information presented in charts.。
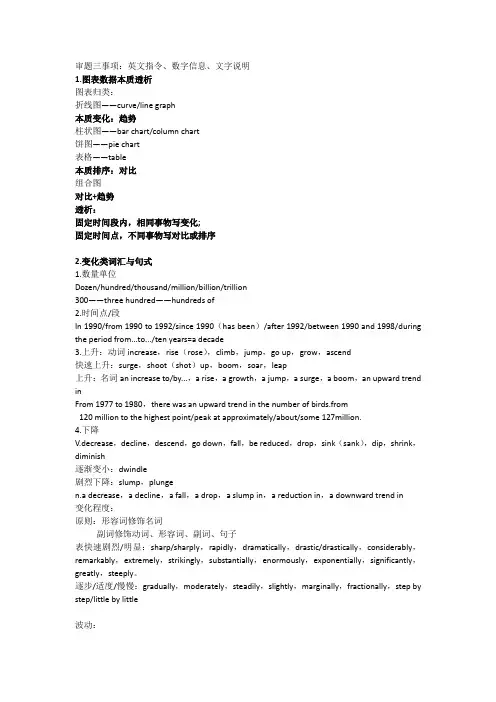
审题三事项:英文指令、数字信息、文字说明1.图表数据本质透析图表归类:折线图——curve/line graph本质变化:趋势柱状图——bar chart/column chart饼图——pie chart表格——table本质排序:对比组合图对比+趋势透析:固定时间段内,相同事物写变化;固定时间点,不同事物写对比或排序2.变化类词汇与句式1.数量单位Dozen/hundred/thousand/million/billion/trillion300——three hundred——hundreds of2.时间点/段In 1990/from 1990 to 1992/since 1990(has been)/after 1992/between 1990 and 1998/during the period from...to.../ten years=a decade3.上升:动词increase,rise(rose),climb,jump,go up,grow,ascend快速上升:surge,shoot(shot)up,boom,soar,leap上升:名词an increase to/by...,a rise,a growth,a jump,a surge,a boom,an upward trend inFrom 1977 to 1980,there was an upward trend in the number of birds.from120 million to the highest point/peak at approximately/about/some 127million.4.下降V.decrease,decline,descend,go down,fall,be reduced,drop,sink(sank),dip,shrink,diminish逐渐变小:dwindle剧烈下降:slump,plungen.a decrease,a decline,a fall,a drop,a slump in,a reduction in,a downward trend in变化程度:原则:形容词修饰名词副词修饰动词、形容词、副词、句子表快速剧烈/明显:sharp/sharply,rapidly,dramatically,drastic/drastically,considerably,remarkably,extremely,strikingly,substantially,enormously,exponentially,significantly,greatly,steeply。
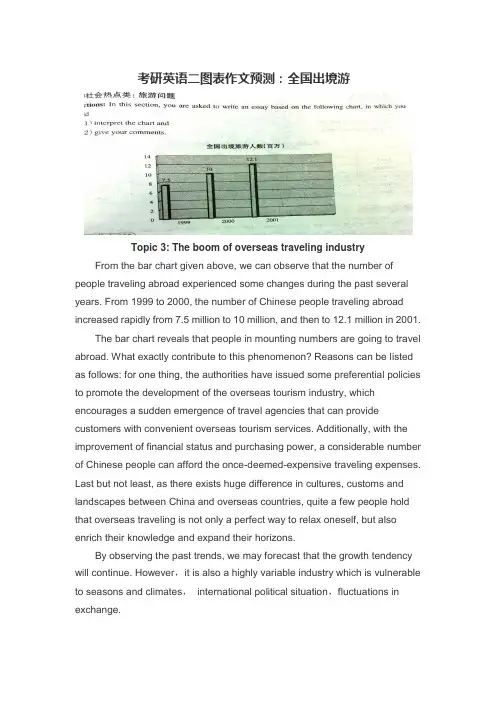
考研英语二图表作文预测:全国出境游Topic 3: The boom of overseas traveling industry From the bar chart given above, we can observe that the number of people traveling abroad experienced some changes during the past several years. From 1999 to 2000, the number of Chinese people traveling abroad increased rapidly from 7.5 million to 10 million, and then to 12.1 million in 2001.The bar chart reveals that people in mounting numbers are going to travel abroad. What exactly contribute to this phenomenon? Reasons can be listed as follows: for one thing, the authorities have issued some preferential policies to promote the development of the overseas tourism industry, which encourages a sudden emergence of travel agencies that can provide customers with convenient overseas tourism services. Additionally, with the improvement of financial status and purchasing power, a considerable number of Chinese people can afford the once-deemed-expensive traveling expenses. Last but not least, as there exists huge difference in cultures, customs and landscapes between China and overseas countries, quite a few people hold that overseas traveling is not only a perfect way to relax oneself, but also enrich their knowledge and expand their horizons.By observing the past trends, we may forecast that the growth tendency will continue. However,it is also a highly variable industry which is vulnerable to seasons and climates,international political situation,fluctuations in exchange.考研英语二图表作文预测:电子商务成交额Global E-commerce turnoverFrom the curve chart given above, we can observe that the turnover of global E-commerce experienced some change during the past several years. From 1997 to 2005, it rose dramatically from 20 billion to 900 billion.The curve chart reveals that the global E-commerce industry enjoys an explosive growth. Quite a few reasons can be listed to account for this phenomenon, and the followings might be the most critical ones: for one thing, the authorities of different countries have issued some preferential policies to protect and encourage the development of E-commerce, thus quite a few online-transaction websites emerge overnight. Moreover, theone-click-payment consumption mode has been widely accepted by the public thanks to the widespread availability of the Internet. Last but not least, people’s decision to purchase on-line can also be put down to the power of so-called “group-dynamics”: when our friends are shopping at network, we will be influenced by them and imitate their behaviors unconsciously.The rapid development of E-commerce signals that new business models contribute largely to the sustainable development of the global economy. However, when enjoying the fruits offered by modern technology, we should also keep an eye on the underlying threat of it. In a world features open boundary, deception and fraud sometime abound. (209 words )考研英语二图表作文预测:职业选择Different job inclination between boys and girls From the bar chart given above, we can find that it reflects the statistics of profession inclination between girls and boys. Most obviously, 40% of boys intend to be a manager, with only 15% of girls choosing this job. When it comes to the profession of teacher, we can observe that 45% of girls prefer to take this job, while the proportion of boys only account for 5%, 40% lower than that of girls.The bar chart informs us of the phenomenon that there exists some difference in profession inclination between boys and girls. What exactly contribute to this phenomenon ? reasons can be listed as follow: for one thing, quite a few boys regard being a manager as a symbol of success. As this profession stands for promising futures, fat pay and competence. Moreover, boys’ decision to be a manager can also be attributed to the power of so-called “group dynamics”: when members of their social network prefer to be a manager after graduation, they are easily influenced and imitate others’ behavior unconsciously or consciously. When it comes to girls, the are more inclined to be a teacher. As this profession features stability and respect. Takesocial and biological factors into account, we know that it is reasonable for girl to choose teacher as their ideal profession goals.Both girls and boys have rights to choose their profession. However, one thing we should bear in mind is that there exists no better or worse, superior or inferior jobs, but suitable and satisfactory ones. (254words)考研英语二作文范文:中国职业的变化The changes of Chinese professionsFrom the pie chart given above, we can observe that the professions structure of Chinese people experienced some changes during the past several years. From 1980 to 1999, the percentage of agricultural professions decreased by 30% from 68% to 38%. During the same period, however, service sectors increased rapidly from 5% to 22%. When it comes to the manufacturing professions, its percentage rose markedly from 27% in 1980 to 40% in 1999.The pie chart reveals the phenomenon that there exists some difference in the development tendency among different professions in China. What exactly contribute to this phenomenon ? reasons can be listed as follows: for one thing, with the rapid process of urbanization, people in mounting numbers, especially youngster, have left their village homes ,moved into big cities and thus been out of agricultural industries. Moreover, quite a few people, especially college graduates hold that it is comparatively easy for them to make more money inthe service industry. When it comes to the manufacturing industry, its transformation might be attributed to the adjustment of industrial structure: the authorities have issued some preferential policies to promote the rapid extension of manufacturing industry, thus, more workforces are required.By observing the change over the past several years, we may forecast that the proportion of professions of service and manufacture will continue to rise. However, a high value should be placed on the development of agricultural industry by the public and the authorities. Otherwise, with the number of people who are engaged in agriculture diminishing, we will one day have nothing to eat! (262words)考研英语二作文范文:快餐和坐下来餐厅发展趋势The development tendency of fast food and sit down restaurantFrom the curve chart given above, we can observe that the number meals of fast food and sitdown restaurant experienced some changes during the past several years. The number of meals of fast food increased slowly from 20 in 1970 to nearly 30 in 1980. From 1980 to 2000, it ascended rapidly from 30 to approximately 90. On the contrary, when observing the statistics of sitdown restaurant meals, we can find that it increased slowly from 20 in 1970 to roughly 50 in 2000.The curve chart informs us of the phenomenon that there exists some difference in the development tendency between fast food and sitdown restaurants. What exactly contribute to this phenomenon? Reasons can be listed as follows: for one thing, with the pace of modern life quickening, people barely have much time to waste in lining up for restaurant meals, on the contrary, fast food meals can do help busy people save a great deal of time. Additionally, the authorities have issued some preferential policies to protect and encourage the rapid extension of fast food industry , thus the public can buy fast food at shops scattering around the city. On the contrary , people in diminishing numbers are willing to eat at sitdown restaurant. They think that eating at restaurant is always time-consuming and inconvenient. Besides, food at restaurant is comparatively expensive than fast food.by observing the trend of the past, we may forecast that the number of fast food meals will continue to rise in the years to come. However, we should also take the detrimental impact of fast food into consideration. Do remember that fast food is one of the main causing factors of diseases such as heart attack, obesity and diabetes.英语二赠送以下资料考研英语作文模板(英语一)大作文考研英语大作文一般是看图写作,从一幅图分析含义及意义,所以只需要几个好的模板,根据题目套上去就行了。
考研英语(二)图表作文经典模板
来源:文都图书
考研英语(二)的大作文图表作文相对考研英语(一)来说是比较简单的,它有一些固定的用语和格式是考生们在考前可以进行速记和运用的。
在此给大家推荐全国知名考研英语辅导老师谭剑波的《考研英语(二)写作考前冲刺万用魔板》,相信会对大家有很大的帮助。
1.Crucial a.关键的;重要的
【单词记忆】词根cruc-来自cross(元音互换,c=s发音相同),-ial 形容词后缀。
Cross本意为“穿过”,也可表示“十字路口”,十字路口是一个很重要的转折点,因此用cross创造出crucial表示“重要”。
【同义替换】critical
【写作例句】doing sth. is crucial to doing sth.如Reading more books is crucial to accumulating knowledge.多读书对知识积累很重要。
2.Significant a.重要的
【单词记忆】sign“记号”,i无意,词根-fic“作”,-ant形容词后缀。
我们在读书的时候,总在重要的地方做记号,因此“做记号”表示“重要的”。
【同义替换】important
【写作例句】sth. is significant 或sth. is of great significance /importance某事想当重要
这本书针对图表作文进行了概述、题型讲解、万用魔板、范文点评和命题预测等五大方面的详细叙述,帮助考生一举拿下图表作文,除此之外,为了在短时间内提高大家的知识储备量,书中还附有图表作文高频核心100词、低端词汇的高端替换和图表作文的常用表达等,非常有用。
最后预祝大家考研顺利,加油!。
图表作文的篇章结构:写图表作文时,常采用三段式的谋篇方式。
文章的第一段往往分析图表中的数据变化反映什么问题或趋势,概述图表所揭示的信息。
第二段分析造成这一问题或趋势的原因。
第三段则展望未来的情况或提出解决问题的办法或建议。
中间段1. It’s an urgent task for us to change this unfavorable situation: ______________.2. The picture can reminds you of some strange, yet familiar phenomena existing in our society.3. Confronted with AAA, we should take a serious of effective measures to cope with the situation.16. It is high time that something was done about it. For example, ______________. In addition, ______________. All these measures will certainly ______________.22. There are, I think, two main reasons for ______________. In the first place, ______________. In the second place, ______________. Therefore, ______________.30. However, just like everything has both its good and bad sides, ______________ also has its own disadvantages, such as, ______________. besides, ______________.33. There are many reasons responsible for this instance, and the following are the typical ones. For one thing, ______________,in addition, ______________. The main reason is that ______________.36. One of the reasons that is given for ______________ is that ______________.结尾句1. The most effective means to solve this problem is that ______________. In that case, ______________.2. Everything has its own two sides, no exception with AAA. For one thing, ______________. for another, ______________.4. On the whole, it is high time that we recognized the significance of ______________.6. Judging by the figures, we can draw a conclusion that ______________.7. In a word, the whole society should pay close attention to the problem of ______________. Only in this way can ______________ in the future.8. In my opinion, we should place much emphasis on the importance of ______________.12. As a popular saying goes, ______________. In my opinion what really counts is not ______________, but ______________. I believe that as long as ______________, we will ______________. So I am for theopinion that ______________.16. People are coming to realize the importance of ______________. They have begun to try their bestto ______________. We believe that ______________.17. All in all, we cannot live without ______________ . But at the same time we must try to find out new ways to cope with problems that would arise.18. Whatever you do, please remember the saying-______________. If you understand it and apply it to your study or work, you’ll definitely benefit alot from it.21. It is essential that effective actions should be taken to end the situation.24. From what has been discussed above, we may reasonably arrive at the conclusion that ______________.38. If we can’t take useful means, we may not control this trend, and some undesirable result may comeout unexpectedly, so what we should do is ______________.53. In my opinion, to solve this problem there might be two ways. One way to tackle this question is______________. Another way that is worth adopting is ______________.考研英语二图表作文模板第一段(一升一降一不变,一缓慢)What a thought-provoking and illuminating chart it is! As is apparently depicted in the chart, it is obvious that(内容)soared from(数据)in(年份)to(数据)in(年份), While, as a sharp contrast, (内容)decreased from(数据)in(年份)to(数据)in(年份).In addition ,(内容)was almost the same in(年份)and(年份)./(there was only a slow increase from(数据)in(年份)to(数据)in(年份))第二段(解释具体原因)Why does this phenomenon revealed in the chart above appear? Several reasons accounting for the situation can be what follows. To begin with ,I am strongly convinced that this is partly duo to the fact that(原因一), In addition, this is partly because ,(原因二), Last but not least,this is partly because(原因三). Maybe there are some other reasons bring about this phenomenon. But it is generally believed that the above mentioned reasons are commonly acceptable.第三段(发表个人观点)From the analyses made above , we may come to the conclusion that(结论). I am sure my opinion is both sound and well-grounded.对于英语(二)的考生来说,大作文备考的重点是图表作文,因为大纲样题中给出的是表格,而且两年真题考的是柱状图,都属于图表范畴。
考研英语二作文第一篇:考研英语二作文考研英语二图表作文模板第一段(一升一降一不变,一缓慢)What a thought-provoking and illuminating chart it is!As is apparently depicted in the chart, it is obvious that(内容)soared from(数据)in(年份)to(数据)in(年份), While, as a sharp contrast,(内容)decreased from(数据)in(年份)to(数据)in (年份).In addition ,(内容)was almost the same in(年份)and (年份)./(there was only a slow increase from(数据)in(年份)to(数据)in(年份))第二段(解释具体原因)Why does this phenomenon revealed in the chart above appear? Several reasons accounting for the situation can be what follows.T o begin with ,I am strongly convinced that this is partly duo to the fact that(原因一), In addition, this is partly because,(原因二), Last but not least,this is partly because(原因三).Maybe there are some other reasons bring about this phenomenon.But it is generally believed that the above mentioned reasons are commonly acceptable.第三段(发表个人观点)From the analyses made above , we may come to the conclusion that(结论).I am sure my opinion is both sound and well-grounded.邀请信例一Dear________,There will a________________(内容)at/in________________(地点)on___________(时间).We would be honored to have you there with us.The occasion will start at___________(具体时间).This will be followed by a_______(进一步的安排).At around______(时间),____________________________(另一个安排).I really hope you can make it.RSVP before____________(通知你的最后期限).Yours sincerely Li Ming例二Dear_____________,①_____________(开门见山提出事件/活动、地点、时间).②It would be pleasant/honored to have you here.③Duringthepa rty/conference,wewillhavelotsofactivitiesyou willbeinterestedin.④First,____________(要举行的活动内容一).⑤Second,__________(要举行的活动内容二).⑥I know/believe that you will be very interested in_____________.⑦First/For one thing,_____________(受邀请人参加的理由一).⑧Second/For another,_____________(受邀请人参加的理由二).⑨The conference/party would not be complete without you!⑩The party/conference will begin at时间and we do hope you can come.Yours sincerelyLi Ming考研英语小作文模板之请求信例一Dear___________,I am writing to formally request to___________(请求的内容)There a son for______________ is that______________________________(给出原因).I________ ,so I___________________________________(给出细节)I would also like to request________________________(提出进一步的要求).I am sorry for any in convenience I have caused.Thankyouforyourattentiontotheserequests.Ifyouhaveany questions,donothesitatetocontactmeat____________(电话号码).I look forward to a favorable reply.YourssincerelyLiMing例二Dear_____________,①Iam_____________(介绍自己的身份).②Iwill/am_____________(与请求有关的自身现状).③I''dliketo_____________(阐明自己的请求).④Iwillappreciateyour_____________(有关该请求的详细信息).⑤I''mgoingto_____________(对方如能帮助实现请求,自己将要做些什么).⑥Herearethereasonswhy_____________(承上启下,开始解释原因)⑦Foronething,_____________(请求的原因一);Foranother,_____________(原因二).⑧Therefore,_____________(总结写信的目的).⑨Ishallbemuchobligedtoyouifyou_____________(对收信人的期望).⑩ThanksforyourkingconsiderationandIlookforwardtoreceivi ngyourearliestreply.YourssincerelyLiMing考研英语小作文模板之投诉信Dear_______,Iam_______________________.(自我介绍)IfeelbadtotroubleyoubutIamafraidthatIhavetomakeacomplainta bout_______.Thereasonformydissatisfactionis______________(总体介绍).Inthefirstplace,_________________________(抱怨的第一个方面).Inaddition,____________________________(抱怨的第二个方面).Underthesecircumstances,Ifindit___(感觉)to____________________________(抱怨的方面给你带来的后果).Iappreciateitverymuchifyoucould_______________________(提出建议和请求),preferably__________(进一步的要求),andIwouldliketohavethismattersettledby______(设定解决事情最后期限).ThankyouforyourconsiderationandIwillbelookingforwardto yourreply.YourssincerelyLiMing考研英语作文指之感谢信范文Directions:Whileyourfamilywasonvacation,yourfriend,Cathyl ookedafteryourdog,smart.Nowyoucameback,writealettertoherto showyourgratitude.Yourlettershouldbenolessthan100words.You don'tneedtowritetheaddress.Don'tsignyourownnameattheendof theletter,useEmilyinstead.DearCathy,Iamwritingtoexpressourheartfeltthanksfortakinggoodcareofsma rtwhilewewereonholiday.Hewassuchahappydogwhenwegothom e;weknewhemusthavehadlotsoflovingattention.Whenweusedtop ickupfromthekennelhewouldwhimperandcarryonforhours.Youno tonlysavedussomemoney,youalsosparedustheworryofhowhewas doingwhilewewereaway.Yourkindhelpisverymuchappreciated,no tonlybysmart,butalsobyourwholefamilyaswell.Yourstruly,Emily 译文我写信是要谢谢在我们度假期间你帮助我们照顾小狗。

2024英语二考研大作文话题预测(必背10篇+选背2篇)目录大作文话题预测第一节必背10篇01图表:高铁发展02图表:燃油车与新能源汽车销量变化03图表:我国老年人口比例04图表:居民日常出行选择05图表:年轻人就餐选择06图表:图书获取渠道07图表:课余时间使用情况08图表:阅读偏好09图画:科技改变习惯(新大纲)10材料作文:奖励式教育(新大纲)第二节选背2篇01图表:中学生近视率02材料作文:课堂上使用手机(新大纲)附录:考研英语(二)写作大纲样题解析大作文话题预测第一节必背10篇Topic01图表:高铁发展Directions:Write an essay based on the chart below.In your writing,you should1)interpret the chart,and2)give your comments.You should write about150words on the ANSWER SHEET.(15points)参考范文范文中加粗的部分为功能句,在其他图表作文中也适用。
This is a line graph that clearly illustrates the significant changes in the high-speed rail mileage and the number of passengers in China from2012to2021.During this period,the mileage ascended dramatically from less than10thousand kilometers to over40thousand kilometers. Meanwhile,the number of passengers also showed a sharp growth,especially from2016to2021, reaching approximately3billion in2021.Such statistics can naturally be associated with the fast development of high-speed trains in China.For one thing,in recent years,China has been characterized by its economic boom and prosperity,which enabled the government to possess an additional budget to invest in constructing infrastructures,including high-speed trains and related facilities.For another,compared with other means of transportation,high-speeds train are faster,more comfortable and safer.Thus,an increasing number of people choose to travel by high-speed trains.To my understanding,it is of great necessity for our government to continue to fund the construction of high-speed railways and other infrastructures,which will bring citizens convenience,arouse their enthusiasm for traveling,and help them create a better life.I believe that if our government does its utmost,the prospects for China will be promising.参考译文这是一个折线图,清晰地展示了2012年至2021年间中国高铁里程和旅客人数的巨大变化。
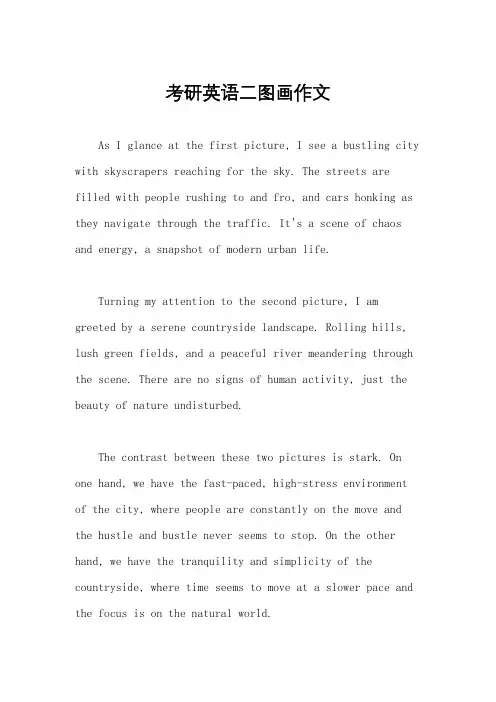
考研英语二图画作文As I glance at the first picture, I see a bustling city with skyscrapers reaching for the sky. The streets arefilled with people rushing to and fro, and cars honking as they navigate through the traffic. It's a scene of chaos and energy, a snapshot of modern urban life.Turning my attention to the second picture, I am greeted by a serene countryside landscape. Rolling hills, lush green fields, and a peaceful river meandering through the scene. There are no signs of human activity, just the beauty of nature undisturbed.The contrast between these two pictures is stark. On one hand, we have the fast-paced, high-stress environment of the city, where people are constantly on the move and the hustle and bustle never seems to stop. On the other hand, we have the tranquility and simplicity of the countryside, where time seems to move at a slower pace and the focus is on the natural world.In the city, there is a sense of ambition and opportunity, with people striving to make a name for themselves and achieve success in their careers. The countryside, on the other hand, offers a sense of peace and connection to the land, with a focus on a simpler way of life and a closer relationship with nature.Both environments have their own unique appeal, and each offers something different to those who inhabit them. While the city may offer excitement and opportunity, the countryside provides a sense of calm and connection to the natural world. It's a reminder that there is beauty and value to be found in both the chaos of the city and the peace of the countryside.。
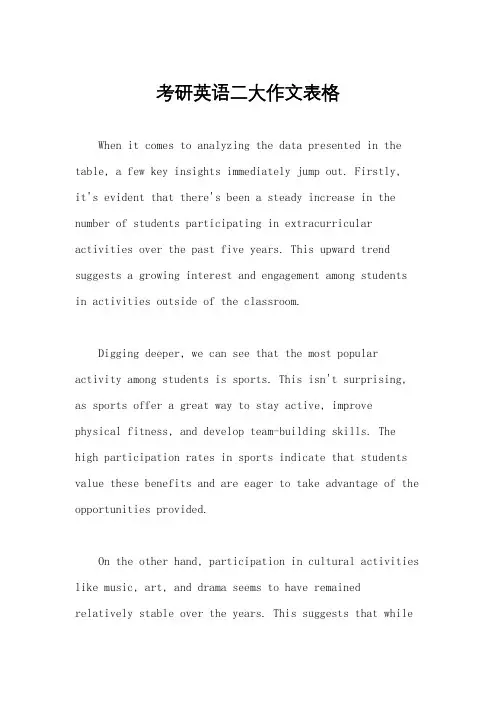
考研英语二大作文表格When it comes to analyzing the data presented in the table, a few key insights immediately jump out. Firstly,it's evident that there's been a steady increase in the number of students participating in extracurricular activities over the past five years. This upward trend suggests a growing interest and engagement among studentsin activities outside of the classroom.Digging deeper, we can see that the most popularactivity among students is sports. This isn't surprising, as sports offer a great way to stay active, improve physical fitness, and develop team-building skills. The high participation rates in sports indicate that students value these benefits and are eager to take advantage of the opportunities provided.On the other hand, participation in cultural activities like music, art, and drama seems to have remainedrelatively stable over the years. This suggests that whilethese activities may not be as popular as sports, they still hold a significant place in the lives of many students. Cultural activities offer a platform for creativity and expression, and their continued presence indicates that students appreciate these aspects of their education。
图表作文(一)第一节图表作文的类型图表作文可分为两大类:表作文和图作文。
表作文表格(Table)可以使大量数据系统化,便于阅读、比较。
表格常由标题(Title)、表头(Boxhead)(表格的第一行)、侧目(Stub)(表格左边的第一列)和主体(Body)部分(表格的其余部分)等部分组成。
如下表:用表格表达的信息具体准确,而且表格中的各项均按一定规律排列。
阅读表格时要注意找出表格中各个项目的相互关系,表格中各个项目的变化规律。
例如,上面的表格中的数字说明,和1978年相比,1983年大学入学的人数在增加,而小学的入学人数在减少。
搞清楚这些变化规律也就读懂了表格的内容。
图作文图作文又可分为三种:圆形图作文、曲线图作文和条状图作文。
(1) 圆形图作文圆形图(Pie chart)也称为饼状图或圆面分割图。
圆形图因为比较形象和直观,各部分空间大小差别容易分辨,所以常用来表示总量和各分量之间的百分比关系。
整个圆表示总量,楔形块表示分量。
有时圆形图还有数值表,两者结合可把各分量表示得更准确、清楚。
例如:This is a pie chart of the average weekly expenditure of a family in Great Britain. As can be see from the chart, the main expenditure of an average British family is spent on food, which accounts for 25% of its total expenditure. The next two significant expending items are transport and housing, which are 15% and 12% respectively. If we take into account clothing and footwear, which makes up 10%, the four essentials of life, that is, food, transport, housing, and clothing and footwear, amount to 62% of the total expenditure.(2) 曲线图作文曲线图(Line graph)也称为线性图或坐标图。
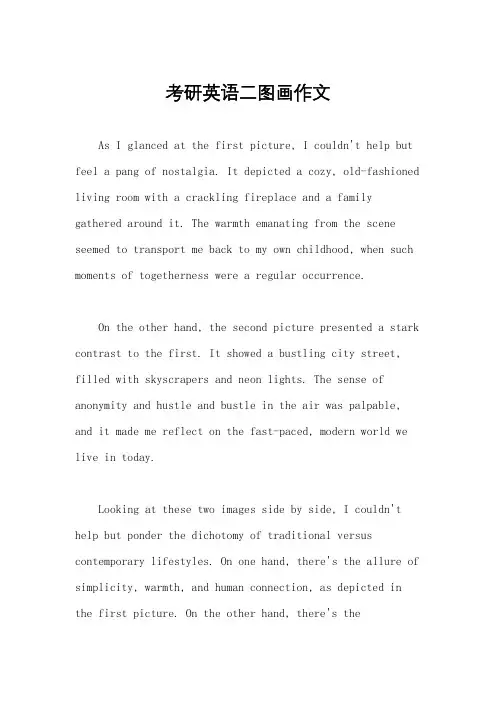
考研英语二图画作文As I glanced at the first picture, I couldn't help but feel a pang of nostalgia. It depicted a cozy, old-fashioned living room with a crackling fireplace and a family gathered around it. The warmth emanating from the scene seemed to transport me back to my own childhood, when such moments of togetherness were a regular occurrence.On the other hand, the second picture presented a stark contrast to the first. It showed a bustling city street, filled with skyscrapers and neon lights. The sense of anonymity and hustle and bustle in the air was palpable, and it made me reflect on the fast-paced, modern world we live in today.Looking at these two images side by side, I couldn't help but ponder the dichotomy of traditional versus contemporary lifestyles. On one hand, there's the allure of simplicity, warmth, and human connection, as depicted in the first picture. On the other hand, there's theexcitement, opportunity, and innovation of urban life, as portrayed in the second picture.In a way, these two images serve as a reminder of the choices we face in our own lives. Do we prioritize the comforts of tradition and family, or do we embrace the dynamism and potential of the modern world? It's a question that each of us must grapple with, and there's no one-size-fits-all answer.Ultimately, these two pictures are a reflection of the rich tapestry of human experience. They remind us that there's beauty and value in both the old and the new, and that our individual paths are shaped by the interplay of these contrasting forces.。
考研英语二图表类作文大学生活的主要考点The main focus of the postgraduate entrance examination English language section is the ability to analyze and interpret data presented in various forms, such as tables, charts, and graphs. One common type of question in this section is the data comparison question, where students are asked to compare and contrast information presented in different forms of data.In the context of university life, the data presented in the charts or tables can cover a wide range of topics, including student enrollment numbers, academic performance, extracurricular activities, and student satisfaction levels. Here are some key points to keep in mind when analyzing and writing about data related to university life:1. Understanding the data: Before you can analyze the data presented in the charts or tables, you need to first understand what the data is showing. Pay attention to the title of the chart or table, as well as the labels on the axes or rows and columns. This will help you to identify the main trends or patterns in the data.2. Comparing data: Look for similarities and differences in the data presented in different charts or tables. For example, you could compare student enrollment numbers in differentdepartments, or compare academic performance across different years. Be sure to use appropriate language to make comparisons, such as "higher than," "lower than," or "similar to."3. Interpreting trends: Identify any trends or patterns in the data, such as increases or decreases over time, or differences between different groups of students. Try to explain why these trends might be occurring, and use evidence from the data to support your interpretations.4. Making predictions: Based on the data presented, you may be asked to make predictions about future trends or outcomes. For example, you could predict how student enrollment numbers in a particular department might change in the future, or how academic performance might be affected by changes in curriculum or teaching methods.5. Drawing conclusions: Finally, you should draw conclusions based on the analysis of the data. Summarize the main findings of your analysis, and consider any implications for university policy or practices.In conclusion, the ability to analyze and interpret data presented in charts and tables is a key skill that students need to demonstrate in the postgraduate entrance examination English language section. By focusing on the main points outlined above,students can improve their performance on questions related to university life and other topics covered in the exam.。
英语图表作文必背图表作文必背词汇众所周知,考研英语二中的作文有两篇,其中一篇是应用文,这个比较简单,只要好好准备,基本大家都可以拿到6、7分。
第二种就是相对难一些的图表作文了。
在这部分,最新大纲要求考生根据所规定的情景或给出的提纲,写出一篇150字左右的英语说明文或议论文。
提供情景的形式为图画、图表或文字。
对于图表类作文,大家需要掌握大量的专业类的词汇,面对词汇量庞大的要求,大家需要夯实词汇基础,本期小编与大家分享的是考研英语二图表类作文:必背词汇,供大家参考学习。
一 :单词和词组1、增加、上升,提高动词:increase, grow , rise, climb,expand, ascend, escalate, gain名词:increase, rise ,growth, expansion, pickup, gain, upturn, escalation词组:go/ pick up, post/ register/ manage a moderate/ small gain, gain a momentum, continue its upward trend, on the rise/ increase/ ascendance, mount up.2、猛增动词: leap, jump, soar, rocket, skyrocket, surge, proliferate, explode名词: leap, jump, surge, proliferation, explosion词组:shoot up3、减少,下降动词:decrease, decline, fall, reduce, descend, diminish, drop, dip, slide, dwindle, shrink, lessen, sink 名词:decrease, decline, diminution, slowdown, shrinkage, dip ,drop, fall ,slide, reduction, downturn词组:go down, drop/ fall off, take a dip, continue its downward trend, on the decline/ decrease, slow down4、暴跌动词:slump, nosedive, plummet, plunge, collapse, dive名词:slump, nosedive, plunge ,collapse, dive5、剧烈地,显著地副词:dramatically,sharply, considerably, rapidly, greatly, alarmingly, significantly, enormously, steeply, massively, hugely, substantially, tremendously, drastically, precipitously, markedly词组:at an alarming rate, by/ in leaps and bounds. Bya wide./ significant margin6、缓慢地,逐渐地副词:gradually, steadily, slightly, gently, marginally ,slowly, moderately, modestly词组:in a moderate way, by a narrow margin7、波动:动词:fluctuate, vary, wave名词:fluctuation, variation词组:go up and down, ups and downs8、稳定在一个水平上动词:remain, keep, stay ,maintain, stabilize, stagnate形容词:stable, steady, constant, unchanged名词:stagnation, stability, steadiness, plateau词组:level of at ,leave out at , hove at .stabilize at , reach a plateau at9、达到最高点动词:peak, top名词:peak ,top, summit, zenith词组:peak at, reach the highest point at, reach a peakof , reach its zenith, be at its zenith10、达到最低点动词:bottom,名词:bottom, trough词组:bottom out at, reach the bottom at ,reach the lowest point at ,hit a trough11、达到多少数量动词:reach,hit,register词组:arrive at, stand at, amount to12、组成整体包含部分:comprise, consist of , be made up of , be composed of部分组成整体:constitute ,make up, form, occupy, account for, represent13、对将来数字预测的及物动词及物动词:expect, predict, project, forecast使用举例:A is expected/ predicted/ projected/ forecast to reach14、分别的副词副词: respectively15、大约(放在数字之前的)副词:about, around, approximately, roughly, nearly, almost (放在数字之前的)词组:just over, just under, close to, in the region of, in teh vicinity of , in the neighborhood of(放在数字之后的)词组:or so, or thereabouts16、描绘,描述,显示,表明动词:show, depict, describe, illustrate, outline, represent, reveal, delineate二 :长难句1、the chart describes the changes in full time employment rates across a wide range of age groups in Europe between 1969 and 1999.2、the data indicate changes in spending habits during the past forty years in UK.3、the chart describes the world population growth spanning two centuries.4、the chart outlines energy consumption in the UK over a twelve month period.5、the data presented in the chart represent the amount and types of books sold in the US during the period 1980 to 2010.6、the data show a comparison between the amount of red wine that is consumed and the rates of heart disease in certain European cities.7、a glance at the graph provided reveals some striking similarities between the Chinese and U.S.birth rates during the period from 1920 to 2000.8、given is a figure concerning criminality in Britain.9、the graph illustrates changes in the amounts of beef, lamb, chicken and fish consumed in a particular European country between 1979 and 2004.10、according to the chart,……11、As is shown in the table,……12、it is clear obvious/ apparent from the chart that ……13、in comparison with A, B is ……14、the number of ……has increased seven fold from ……to ……in 2000.15、it is interesting to note that there is a certain correlation between ……and ……16、A is three times as much as B17、the number sharply we nt up to……18、the graph shows a threefold increase in number of ……————— / END / —————。
考研英语二大作文图表模版应用与范文【模版】模板在160字左右,再加上自己写的主题词和图表描述句,这样字数就更多了。
建议大家根据自己的情况删减一些句子,把总的字数控制在200以内。
What is remarkedly presented in the above 图表类型is that dramatic changes have taken place in 主题词1 from 年份1 to 年份2. During the period, there was a marked jump from 数字1 to 数字2 in 事物1, while that of 事物2 declined significantly/climbed slightly from 数字3 to 数字4. (若有第三个事物,则再简单介绍第三个事物的情况)When it comes to specific reason that accounts for the development of the phenomenon that 图表所示的内容(and I believe there are several fundamental factors to account for the above-mentioned changes). Primarily, with the rapid development of modern society which led by economy, 快速发展的事物has turned out to be a trend that anyone cannot evade. Moreover, with the quickening pace of modern life and the fierce competition of society, (1)(suffering from the reduplicated pressure from work and living,)(2) people’s values have changed gradually, more and more people chose to do something in order to do something. Finally, 快速发展的事物is closely related to the reforming policy of our country.Given all above arguments, it admits of no doubt that this tendency of 主题词2 will continue in the forthcoming years. The government and individuals should collaborate as much as possible to improve sth and make the current social system more reasonable. Only with joint efforts, can these changes be made most use of .以下是我自己的写作练习和老师范文。
考研英语图表作文范文2010英语(2)大纲样题48. Directions: In this section, you are asked to write an essay based on the following table, inwhich you should 1) describe the table and 2) state your opinions drawn from it.You should write at least 150 English words.Accidents in a Chinese City (2005)Main accident causesNumber of accidentsin 2005 Percentage rise (+) or fall(-)over 20041. drivers turning left without duecare608 +10%2. drivers traveling too close toother vehicles411 +9%3. pedestrians crossing roadscarelessly201 +12%4. drivers driving under theinfluence of alcohol281 +15%5. drivers failing to give a signal 264 -5%高分作文The above is a table showing the vehicle-related traffic accidents in the year 2005, as is contrasted with those of the corresponding classes or categories in the previous year. There are 5 classes of vehicle-related accidents in the table, divided in accordance with the causes of the accidents. Of all the 5 classes of accidents, 4 have gone up, and only one goes down slightly, showing a worsening situation.Of the classes of accidents that have gone up, the largest in scale of increase (15%) comes in the accidents caused by drivers who have drunk alcohol. Under the influence of alcohol, drivers are liable to lose their control or even consciousness, thus causing disasters. The total banning of alcohol from the drivers who are about to drive is in nature an action to save lives. Unfortunately, over four hundred pedestrians have become victims of traffic accidents due to their owncarelessness. A conclusion can be easily drawn that strict observance of traffic laws and regulations, both drivers and pedestrians, is the precondition and a necessity of avoiding traffic accidents. Wheeled vehicles have been invented and produced as a help to human life, rather than a killer of human lives.2011 (2)Part B48. Directions:Write an essay based on the following chart. In your writing, you should:1) interpret the chart and2) give your comments.You should write at least 150 words.Write your essay on ANSWER SHEET2. (15points)2008、2009年国内轿车市场部分品牌份额示意图What is shown in the column chart above indicates that dramatic changes have taken place in the market share of certain brands in domestic car markets from 2008 to 2009. During the period, there was a marked jump of 8% from 25% to 33% in the market portion of Chinese brands, while that of Japanese brands declined significantly by 10% from 35% to 25%. At the same time, the percentage of American brands remained steady.There are at least two fundamental causes accounting for these changes. On the one hand, advancements in science and technology have offered a technical foundation for the rapid development of Chinese automobile industry by providing material basis and technical means. Meanwhile,it won’t be difficult to notice these days that national automobile companies inmounting numbers turn to price promotions to boost sales. On the other hand, the dishonest words and behaviors of Japanese automobile corporations such as Toyota in recent years cheapens their image and finally ruin their reputation.To sum up, brands are insubstantial treasure. They are akin to a product’s or a company’s reputations. Obviously,if Chinese automobile industry wants to make continuous profits, what they need is to try promotions that reinforce Chin ese brands’ image.(新东方王江涛)2010 (2)48. Directions:In this section, you are asked to write an essay based on the following chart. In your writing, you should1) interpret the chart and2) give your comments.You should write at least 150 words.Write your essay on ANSWER SHEET 2. (15 points)As is shown in the chart, mobile phone subscriptions grow rapidly from 2000 to 2008. We can also find out that developing countries are the driving force for such a rapid growth. According to the chart, mobile-phone subscription number increased to 8 times from 2000 to 2008, that is from around 0.5 billion to 4 billion, while subscription number only increased twice from around 0.5 billion to 1 billion.I think there are two main reasons for such a great contrast.First of all, developing countries have much larger population than developed countries. For example, China and India nearly have half of the total population of the world. China has the most mobile-phone users right now, which increased greatly from 2000 to 2008. It is the same in India and other developing countries.Secondly, developing countries have been enjoying strong economic growth in recent years. As a result, people in most developing countries are richer and richer, especially in China. So they can afford to buy such necessities, including mobile-phone, as the prices continued to drop greatly in the past years.Thus, we can conclude that as economy grows strongly in developing countries, people in these countries can buy more products. (Total: 15; Score: 14)1999★From these graphs, we can draw a conclusion that, with the growth of human population, the number of species has decreased rapidly in America, and some species have been vanished from our planet.Why does this phenomenon appear? I think there are several possible reasons for this. First, with a rapid growth of population, more and more people came to live where some wild species have been living. Then these species have to move to other places. Some of them probably cannot adapt to the new environment and die. Second, although many people look on the wildlife as their friends, some people may not think so. They catch a lot of wild animals and sell them in order to get more money. Third, with the development of the industry, the natural balance and the ecologic environment are destroyed. The deforestation has become more and more serious. So some of the wildlives become homeless and extinct.In order to protect the wildlife, I have some suggestions. First, the governments should make laws to prevent them being caught and killed. Second, the governments should educate people to love the nature and protect it. Third, as for ourselves, we should take practical actions to protect our living environment. (Total: 15; Score: 14)★As is shown by the two graphs, the U.S. population soared from 2 million to 250 million from 1800 to 1990. In contrast, the number of wildlife species no longer existing shot up, adding up to 70 over the same period of time. It is obvious that the extinction of wildlife resulted from the population explosion.We may cite a variety of reasons for this situation. First of all, the destruction of ecological balance plays a pushing role. Due to population problem, pollution and desertification are becoming increasingly serious. Furthermore, a great number of species were killed for food, formoney and even for fun. Even worse, with the rapid growth of human population inhabitable areas were expanding so fast that few areas were for wild animals.To sum up, it is imperative for us to take effective measures to protect wildlife. Firstly, the U.S. government should pour more investment into wildlife protection in a bid to create a better environment. Secondly, the birth rate in the U.S. must be put under control as the dramatically expanding population gives rise to serious environmental problems.★As is shown by the two graphs, it is obvious that with the rapid growth of US population from 1800 to 1900, the number of its wildlife species no longer existing soared during the same period. Naturally, we can draw the conclusion that the sharp decline of wildlife species resulted from the population growth.We may cite a variety of reasons from this situation. To begin with, as the population grows, people consume much more natural resources, which often leads to excessive hunting. Furthermore, with the increase of human activities, modern people take up more and more space, which has a great impact on other species. Finally, the problem of pollution becomes more and more serious with the development of modern industry. More and more animals have to adapt themselves to the decaying environment or move to a totally different place, but not all of them are fortunate enough to survive the changes.Solving this problem calls for, above all, the government’s efforts to control population growth, to decrease industrial pollution and to enhance the laws to forbid wildlife hunting. Moreover, common citizens should be aware of this ecological crisis and take on the responsibility of wildlife protection. In a word, only when the government and the common people make joint efforts can we hope to find a satisfactory solution to this problem.1997As is shown in the bar chart, the total production f tobacco in the world shrank from 14.364 billion pounds in 1994 to 14.2 billion pounds in 1995. According to the figures given in the pie chart, tobacco consumers account for 20%of the world population. This causes great harm to us. Financially, it results in a yearly loss of 200 billion US dollars spent on cigarettes. Physically, about 3 billion people on the globe die from smoking related disease every year.Faced with such a threat, people from all walks of life have tried various measures for a total tobacco ban. For one thing, health experts try hard to warn the public of the dangers involved. For another, the authorities passed laws to limit tobacco production and consumption, raise tobacco taxes and prohibit smoking in public places. More importantly, the public launch campaign to cut smoking.On the basis of the analyses above, we can predict the future tendency confidently. With thefurther growth in economy and more changes in life style, the tendency of tobacco consumption indicated in the table will definitely decrease in the years to come.★We meet people everywhere: in the streets, on college campuses and in shops. There are 5.8 billion people in the world, and the smokers are about 1.1 billion, which makes up 20 percent of the world’s total population.Smoking is very harmful. I think there are two main aspects to the damage. First, smoking consumes a great deal of money. As is shown in the pictorial graph, smoking wastes 200 billion dollars each year in the world. Second, smoking does harm to the health of smokers, and it is the main cause of lung cancer. About 3 million people die because of the relevant diseases derived from smoking every year.Because more and more people are aware of the great harm of smoking to humans, the amount of tobacco consumption is on the decrease. From the following figures we can clearly see the tendency. The total amount of world tobacco production added up to 14.364 billion pounds in 1994, but it dropped to 4.2 billion pounds in 1995. At the same time, many countries call on people to give up smoking. So it is certain that the number of smoking is to decrease. (Total: 15; Score 14)★As is shown in the bar chart,the total production of tobacco in the world shrank from 14.364 billion pounds in 1994 to 14.2 billion pounds in 1995. According to the figures given in the pie chart, tobacco consumers accounts for 20% of the world population. Financially, it results in a yearly loss of 200 billion US dollars spent on cigarettes. Physically, about 3 million people on the globe die from smoking-related diseases every year.Fortunately, the world tobacco production witnessed a decrease in recent years. According to this change, I confidently believe that there will be less and less tobacco consumption in the future, generally for two reasons. On the one hand, being aware of the harm of smoking, more and more people join in the fight against it. They either try their best to give up smoking or advise others not to smoke any longer. On the other hand,many governments have attached more attention to this social hazard and take various measures to put an end to it. Therefore, I have every reason to believe that the fight against smoking will be won by human beings at last.作文模板模版1As is shown in the pictures, with the development of modern science and technology, . In one picture, . The caption reads, . On the contrary, . We are informed that .The purpose of the pictures is to show us that due attention has to be paid to . If we let this situation go as it is, we do not knowwill be in the near future. By that time, will suffer a great destruction.Therefore, it is imperative for us to take drastic measures. For one thing, we should appeal to the authorities to make strict laws to control . For another, we should enhance the awareness of people that is vital to us. Only in this way can we . Also I believe that we humans can overcome this difficulty, and we will have a brighter future.模版2The set of drawings above vividly depicts . As is shown in the first picture, . The caption reads, . In the second picture, . We are informed that .We can deduce from the table that due attention has to be paid to . The fact indicates that .In my opinion, it is imperative to take steps to reverse the disturbing trend illustrated in the pictures. One measure would be . But more importantly, . Although the drive to fight against it is a long-standing and tremendous one, our joint efforts will eventually pay off. I believe that a happy and bright future is awaiting us if we make every effort to .模版3What is shown in the table (chart/graph) above indicates/ shows that drastic changes have taken place in . The statistics of rise and fall seem to exist in isolation but closely related to one another.With the rapid advances in the living standard of the Chinese people in recent years, it has become common for people in many walks of life to . As an example of , we should remember that .To crack this hard nut, people have worked out many effective measures. To begin with, . In addition, . More importantly, . Only in this way can . 模版4The cartoon describes a very common phenomenon in our society that .Why does this phenomenon appear/ take place/ arise? I think/ I’m convinced that there are several possible reasons for this. The first is that . Another major reason is . And studies show that another primary cause is . There is no denying that .Having considered both sides of the argument, I have come to the conclusion that the advantages of outweigh the disadvantages. On the one hand, . On the other hand, . From this we can conclude that .模版5Through the pictures the author tries to warn us of the serious problem of.The main reason for my tendency to A is that 就理由进行解释. For instance, . Another reason can be seen by every one is that 就理由进行解释. For example, . The argument I support in the first paragraph is also in a position of advantage because .Taking into account the factors above, we can safely draw a conclusion that. Although I agree that there may be a couple of advantages of B, I feel that the disadvantages are more obvious, such as . In a word, . So it is sagacious to support the statement that it is better to A. 模版6The cartoon ridicules/ criticizes some producers and companies that often . The picture reveals various problems in .Depending on personal experience, personality type and emotional concern, we find that some people hold the idea of . Meanwhile, others prefer to . From my point of view, it is more advisable to choose rather than . My arguments for this point are listed as follows.When the factors are examined, its advantages and disadvantages weighted, and biased opinions cast away, it is not difficult to draw the conclusion that .模版7The pictures indicate that there have been significant changes in in the last years. It can be seen in the picture that .There is no denying that is the indication of civilization,progress and development; nevertheless, it causes the serious problem of . Scientists have warned that unless effective measures are taken, the problem of will eventually get out of hand. Actually, people are showing a real concern over the problem. For example, so as to prevent it from . Only in this way can we really solve the problem of caused by .Indeed, the earth is our home and we have the duty to take care of it for ourselves and our descendants. In my opinion, we should work out concrete solutions to the problem of . For instance, . Only in this way can we really solve the problem of .模版8As is shown/ illustrated/ can be seen/ depicted/ described in the pictures, a number of . At the upper part of the picture there are some Chinese characters, which read “”.We can deduce from this picture that the drawer is trying to attract our attention to the tragedy of , which is part of the threat to . He seems to be saying that . In my opinion, is a symbol of , including humans, and, like , we also will be left homeless if we allow the destruction of the environment to continue.This simple picture is a wake-up call for the whole of the human race. If this vivid image of the grim future of our planet is not to become a reality, we must take positive steps right now to put an end to the plundering of the earth’s natural resources. It is clear that the drawer of the picture is urging us to start with a campaign to save , which is something all of us can join by urging our local authorities to take positive measures to protect .模版9As is shown in the picture/ table/ chart/ graph, .As the saying goes, every rose has its thorn, and this issue is no exception. The majority of people would agree that . To judge this issue, we should look at three aspects.From the analyses made above, we may come to the conclusion that . With the further growth in economy and more changes in life style, the tendency indicated in the table will continue in the better direction. Therefore, I’m convinced that will definitely decrease in the years to come.。
考研英语二图表类作文大学生活的主要考点全文共3篇示例,供读者参考篇1Title: Main Points of Postgraduate English II Chart Essays on College LifeAs a common topic in the Postgraduate English II exam, the chart essay about college life requires a comprehensive analysis of various data and figures related to the daily life of college students. In order to excel in this type of essay, candidates should pay attention to the following key points:1. Overview of the chart: The first step is to provide an overview of the chart, including the title, source, and a brief description of the content. It is important to analyze the main topics covered in the chart and identify any trends or patterns that can be observed.2. Describing trends and changes: Candidates should focus on describing any trends or changes that can be observed in the data presented in the chart. This may include changes in the number of students participating in extracurricular activities, thedistribution of study time among different subjects, or the preferences for social activities among college students.3. Making comparisons: Another important aspect of the chart essay is to make comparisons between different categories or groups presented in the chart. For example, candidates may compare the study habits of male and female students, or the preferences for sports activities among students from different majors.4. Providing explanations: In addition to describing trends and making comparisons, candidates should also provide explanations for the data presented in the chart. This may involve discussing the reasons behind certain trends, such as the impact of academic pressure on extracurricular participation, or the influence of social media on students' social activities.5. Drawing conclusions: Finally, candidates should draw conclusions based on the analysis of the chart data. This may involve making predictions about future trends, suggesting ways to improve the college experience for students, or highlighting the key findings of the chart.In conclusion, the ability to analyze and interpret chart data related to college life is essential for success in the Postgraduate English II exam. By paying attention to the key points outlinedabove, candidates can effectively demonstrate their analytical skills and critical thinking abilities in their chart essays on college life.篇2The topic of “College Life” is a popular choice for the writing task of the English section in graduate entrance exams, as it allows candidates to demonstrate their skills in interpreting and analyzing data in the form of charts or graphs. In this article, we will discuss the main points that can be covered in a “College Life” themed chart or graph, which are commonly seen in the English II section of the entrance exams.1. Academic Performance: One of the key aspects of college life is academic performance. Charts or graphs can be used to illustrate the distribution of grades among students, trends in GPA over the years, or comparison of different majors in terms of academic achievement. Candidates can analyze the data to draw conclusions about the factors that affect academic performance, such as study habits, class attendance, or extracurricular activities.2. Social Activities: College life is not just about studying; it also involves a lot of social interactions and activities. Candidatescan analyze charts or graphs that depict the participation rates in different extracurricular clubs or events, trends in the popularity of different social activities, or the impact of social activities on students’ overall well-being. This can provide insights into the importance of social connections and personal development in college.3. Part-time Jobs: Many college students take on part-time jobs to support themselves financially or gain work experience. Charts or graphs can be used to show the distribution of students in different types of part-time jobs, trends in job satisfaction or income level, or comparisons of part-time job opportunities in different majors. Candidates can analyze the data to discuss the benefits and challenges of balancing work and study in college.4. Mental Health: College students often experience stress and anxiety due to academic pressure, relationship issues, or financial difficulties. Charts or graphs can be used to visualize the prevalence of mental health issues among students, trends in the utilization of counseling services, or comparisons of mental health outcomes between different demographics. This can shed light on the importance of mental health support and resources on college campuses.5. Future Plans: As college is a time of transition from student life to professional life, many students have plans for their future careers or further education. Candidates can analyze charts or graphs that depict the distribution of students in different post-graduation pathways, trends in career preferences or graduate school applications, or comparisons of employment opportunities in different fields. This can provide insights into the factors that influence students’ decisions about their future.In conclusion, “College Life” is a versatile topic th at can be explored from multiple perspectives using charts or graphs. By analyzing data related to academic performance, social activities, part-time jobs, mental health, and future plans, candidates can demonstrate their ability to interpret and present information effectively in the English II section of the entrance exams. It is essential to practice analyzing different types of charts or graphs to prepare for this task and showcase one’s analytical skills and critical thinking abilities.篇3The main points of the postgraduate entrance examination English II chart writing on college lifeWith the increasing number of students pursuing higher education, the topic of college life has become a popular subject for study and discussion. In the postgraduate entrance examination English II chart writing, candidates may encounter questions related to college life, including various aspects such as academic performance, extracurricular activities, social relationships, and personal growth.One of the main points to consider when writing about college life in the postgraduate entrance examination English II chart writing is academic performance. This may include information such as grades, class rankings, study habits, and academic achievements. Candidates may be asked to analyze and interpret data related to their academic performance, such as comparing their grades with other students or identifying trends in their study habits over time.Another important aspect of college life that candidates may be asked to write about in the postgraduate entrance examination English II chart writing is extracurricular activities. This could include participation in sports, clubs, volunteer work, internships, or other activities outside of the classroom. Candidates may be required to present data on their involvement in extracurricular activities, such as the number ofhours spent on each activity, the impact it has had on their personal development, or the skills they have gained from their experiences.In addition to academic performance and extracurricular activities, social relationships are also a key consideration when discussing college life in the postgraduate entrance examination English II chart writing. Candidates may need to provide information on their relationships with peers, professors, and members of the community, as well as their ability to collaborate and communicate effectively in a variety of social settings.Personal growth is another important aspect of college life that candidates may be asked to write about in the postgraduate entrance examination English II chart writing. This could include information such as personal goals, values, beliefs, and aspirations, as well as how these have evolved throughout their college experience. Candidates may be required to reflect on their personal growth and development, discussing the challenges they have faced, the lessons they have learned, and the ways in which they have grown as individuals.Overall, when writing about college life in the postgraduate entrance examination English II chart writing, candidates should consider a range of factors, including academic performance,extracurricular activities, social relationships, and personal growth. By providing detailed and insightful analysis of these aspects of college life, candidates can demonstrate their ability to think critically, communicate effectively, and engage with complex ideas in a meaningful way.。
考研英语二图表作文预测:全国出境游Topic 3: The boom of overseas traveling industry From the bar chart given above, we can observe that the number of people traveling abroad experienced some changes during the past several years. From 1999 to 2000, the number of Chinese people traveling abroad increased rapidly from 7.5 million to 10 million, and then to 12.1 million in 2001.The bar chart reveals that people in mounting numbers are going to travel abroad. What exactly contribute to this phenomenon? Reasons can be listed as follows: for one thing, the authorities have issued some preferential policies to promote the development of the overseas tourism industry, which encourages a sudden emergence of travel agencies that can provide customers with convenient overseas tourism services. Additionally, with the improvement of financial status and purchasing power, a considerable number of Chinese people can afford the once-deemed-expensive traveling expenses. Last but not least, as there exists huge difference in cultures, customs and landscapes between China and overseas countries, quite a few people hold that overseas traveling is not only a perfect way to relax oneself, but also enrich their knowledge and expand their horizons.By observing the past trends, we may forecast that the growth tendency will continue. However,it is also a highly variable industry which is vulnerable to seasons and climates,international political situation,fluctuations in exchange.考研英语二图表作文预测:电子商务成交额Global E-commerce turnoverFrom the curve chart given above, we can observe that the turnover of global E-commerce experienced some change during the past several years. From 1997 to 2005, it rose dramatically from 20 billion to 900 billion.The curve chart reveals that the global E-commerce industry enjoys an explosive growth. Quite a few reasons can be listed to account for this phenomenon, and the followings might be the most critical ones: for one thing, the authorities of different countries have issued some preferential policies to protect and encourage the development of E-commerce, thus quite a few online-transaction websites emerge overnight. Moreover, theone-click-payment consumption mode has been widely accepted by the public thanks to the widespread availability of the Internet. Last but not least, people’s decision to purchase on-line can also be put down to the power of so-called “group-dynamics”: when our friends are shopping at network, we will be influenced by them and imitate their behaviors unconsciously.The rapid development of E-commerce signals that new business models contribute largely to the sustainable development of the global economy. However, when enjoying the fruits offered by modern technology, we should also keep an eye on the underlying threat of it. In a world features open boundary, deception and fraud sometime abound. (209 words )考研英语二图表作文预测:职业选择Different job inclination between boys and girls From the bar chart given above, we can find that it reflects the statistics of profession inclination between girls and boys. Most obviously, 40% of boys intend to be a manager, with only 15% of girls choosing this job. When it comes to the profession of teacher, we can observe that 45% of girls prefer to take this job, while the proportion of boys only account for 5%, 40% lower than that of girls.The bar chart informs us of the phenomenon that there exists some difference in profession inclination between boys and girls. What exactly contribute to this phenomenon ? reasons can be listed as follow: for one thing, quite a few boys regard being a manager as a symbol of success. As this profession stands for promising futures, fat pay and competence. Moreover, boys’ decision to be a manager can also be attributed to the power of so-called “group dynamics”: when members of their social network prefer to be a manager after graduation, they are easily influenced and imitate others’ behavior unconsciously or consciously. When it comes to girls, the are more inclined to be a teacher. As this profession features stability and respect. Takesocial and biological factors into account, we know that it is reasonable for girl to choose teacher as their ideal profession goals.Both girls and boys have rights to choose their profession. However, one thing we should bear in mind is that there exists no better or worse, superior or inferior jobs, but suitable and satisfactory ones. (254words)考研英语二作文范文:中国职业的变化The changes of Chinese professionsFrom the pie chart given above, we can observe that the professions structure of Chinese people experienced some changes during the past several years. From 1980 to 1999, the percentage of agricultural professions decreased by 30% from 68% to 38%. During the same period, however, service sectors increased rapidly from 5% to 22%. When it comes to the manufacturing professions, its percentage rose markedly from 27% in 1980 to 40% in 1999.The pie chart reveals the phenomenon that there exists some difference in the development tendency among different professions in China. What exactly contribute to this phenomenon ? reasons can be listed as follows: for one thing, with the rapid process of urbanization, people in mounting numbers, especially youngster, have left their village homes ,moved into big cities and thus been out of agricultural industries. Moreover, quite a few people, especially college graduates hold that it is comparatively easy for them to make more money inthe service industry. When it comes to the manufacturing industry, its transformation might be attributed to the adjustment of industrial structure: the authorities have issued some preferential policies to promote the rapid extension of manufacturing industry, thus, more workforces are required.By observing the change over the past several years, we may forecast that the proportion of professions of service and manufacture will continue to rise. However, a high value should be placed on the development of agricultural industry by the public and the authorities. Otherwise, with the number of people who are engaged in agriculture diminishing, we will one day have nothing to eat! (262words)考研英语二作文范文:快餐和坐下来餐厅发展趋势The development tendency of fast food and sit down restaurantFrom the curve chart given above, we can observe that the number meals of fast food and sitdown restaurant experienced some changes during the past several years. The number of meals of fast food increased slowly from 20 in 1970 to nearly 30 in 1980. From 1980 to 2000, it ascended rapidly from 30 to approximately 90. On the contrary, when observing the statistics of sitdown restaurant meals, we can find that it increased slowly from 20 in 1970 to roughly 50 in 2000.The curve chart informs us of the phenomenon that there exists some difference in the development tendency between fast food and sitdown restaurants. What exactly contribute to this phenomenon? Reasons can be listed as follows: for one thing, with the pace of modern life quickening, people barely have much time to waste in lining up for restaurant meals, on the contrary, fast food meals can do help busy people save a great deal of time. Additionally, the authorities have issued some preferential policies to protect and encourage the rapid extension of fast food industry , thus the public can buy fast food at shops scattering around the city. On the contrary , people in diminishing numbers are willing to eat at sitdown restaurant. They think that eating at restaurant is always time-consuming and inconvenient. Besides, food at restaurant is comparatively expensive than fast food.by observing the trend of the past, we may forecast that the number of fast food meals will continue to rise in the years to come. However, we should also take the detrimental impact of fast food into consideration. Do remember that fast food is one of the main causing factors of diseases such as heart attack, obesity and diabetes.英语二。