Effects of holding temperature and time on semi-solid isothermal heat-treated microstructure of
- 格式:pdf
- 大小:1.01 MB
- 文档页数:7

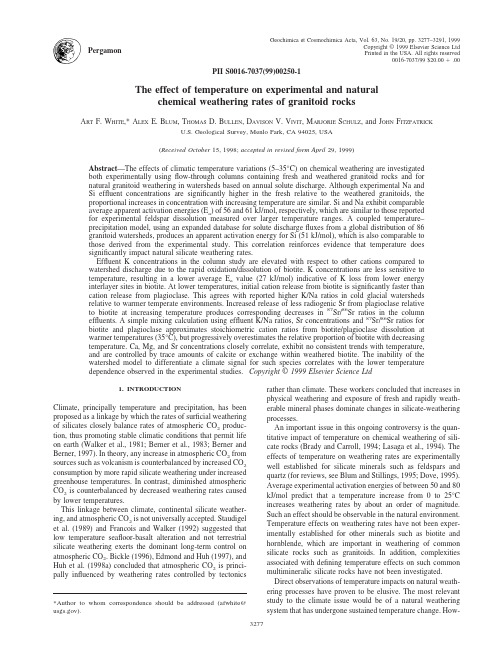
PII S0016-7037(99)00250-1The effect of temperature on experimental and naturalchemical weathering rates of granitoid rocksA RT F.W HITE ,*A LEX E.B LUM ,T HOMAS D.B ULLEN ,D AVISON V.V IVIT ,M ARJORIE S CHULZ ,and J OHN F ITZPATRICKU.S.Geological Survey,Menlo Park,CA 94025,USA(Received October 15,1998;accepted in revised form April 29,1999)Abstract —The effects of climatic temperature variations (5–35°C)on chemical weathering are investigated both experimentally using flow-through columns containing fresh and weathered granitoid rocks and for natural granitoid weathering in watersheds based on annual solute discharge.Although experimental Na and Si effluent concentrations are significantly higher in the fresh relative to the weathered granitoids,the proportional increases in concentration with increasing temperature are similar.Si and Na exhibit comparable average apparent activation energies (E a )of 56and 61kJ/mol,respectively,which are similar to those reported for experimental feldspar dissolution measured over larger temperature ranges.A coupled temperature–precipitation model,using an expanded database for solute discharge fluxes from a global distribution of 86granitoid watersheds,produces an apparent activation energy for Si (51kJ/mol),which is also comparable to those derived from the experimental study.This correlation reinforces evidence that temperature does significantly impact natural silicate weathering rates.Effluent K concentrations in the column study are elevated with respect to other cations compared to watershed discharge due to the rapid oxidation/dissolution of biotite.K concentrations are less sensitive to temperature,resulting in a lower average E a value (27kJ/mol)indicative of K loss from lower energy interlayer sites in biotite.At lower temperatures,initial cation release from biotite is significantly faster than cation release from plagioclase.This agrees with reported higher K/Na ratios in cold glacial watersheds relative to warmer temperate environments.Increased release of less radiogenic Sr from plagioclase relative to biotite at increasing temperature produces corresponding decreases in 87Sr/86Sr ratios in the column effluents.A simple mixing calculation using effluent K/Na ratios,Sr concentrations and 87Sr/86Sr ratios for biotite and plagioclase approximates stoichiometric cation ratios from biotite/plagioclase dissolution at warmer temperatures (35°C),but progressively overestimates the relative proportion of biotite with decreasing temperature.Ca,Mg,and Sr concentrations closely correlate,exhibit no consistent trends with temperature,and are controlled by trace amounts of calcite or exchange within weathered biotite.The inability of the watershed model to differentiate a climate signal for such species correlates with the lower temperature dependence observed in the experimental studies.Copyright ©1999Elsevier Science Ltd1.INTRODUCTIONClimate,principally temperature and precipitation,has been proposed as a linkage by which the rates of surficial weathering of silicates closely balance rates of atmospheric CO 2produc-tion,thus promoting stable climatic conditions that permit life on earth (Walker et al.,1981;Berner et al.,1983;Berner and Berner,1997).In theory,any increase in atmospheric CO 2from sources such as volcanism is counterbalanced by increased CO 2consumption by more rapid silicate weathering under increased greenhouse temperatures.In contrast,diminished atmospheric CO 2is counterbalanced by decreased weathering rates caused by lower temperatures.This linkage between climate,continental silicate weather-ing,and atmospheric CO 2is not universally accepted.Staudigel et al.(1989)and Francois and Walker (1992)suggested that low temperature seafloor-basalt alteration and not terrestrial silicate weathering exerts the dominant long-term control on atmospheric CO 2.Bickle (1996),Edmond and Huh (1997),and Huh et al.(1998a)concluded that atmospheric CO 2is princi-pally influenced by weathering rates controlled by tectonicsrather than climate.These workers concluded that increases in physical weathering and exposure of fresh and rapidly weath-erable mineral phases dominate changes in silicate-weathering processes.An important issue in this ongoing controversy is the quan-titative impact of temperature on chemical weathering of sili-cate rocks (Brady and Carroll,1994;Lasaga et al.,1994).The effects of temperature on weathering rates are experimentally well established for silicate minerals such as feldspars and quartz (for reviews,see Blum and Stillings,1995;Dove,1995).Average experimental activation energies of between 50and 80kJ/mol predict that a temperature increase from 0to 25°C increases weathering rates by about an order of magnitude.Such an effect should be observable in the natural environment.Temperature effects on weathering rates have not been exper-imentally established for other minerals such as biotite and hornblende,which are important in weathering of common silicate rocks such as granitoids.In addition,complexities associated with defining temperature effects on such common multimineralic silicate rocks have not been investigated.Direct observations of temperature impacts on natural weath-ering processes have proven to be elusive.The most relevant study to the climate issue would be of a natural weathering system that has undergone sustained temperature change.How-*Author to whom correspondence should be addressed (afwhite@).PergamonGeochimica et Cosmochimica Acta,Vol.63,No.19/20,pp.3277–3291,1999Copyright ©1999Elsevier Science Ltd Printed in the USA.All rights reserved0016-7037/99$20.00ϩ.003277ever,long-term data required for such a study are not available, and surrogate weathering studies comparing spatially separated climatic regimes are used.The utility of such comparisons depends on the ability to isolate the effect of temperature from other variables influencing chemical weathering including pre-cipitation,geomorphology,vegetation,and lithology.This abil-ity decreases as the scale of the weathering process increases. This explains why comparison of solute concentrations andfluxes in large-scale river systems most often fail to detect a temperature effect(Edmond et al.,1995;Huh et al.,1998b).Although limited in number,comparison of smaller scale weathering environments have been more successful in docu-menting temperature impacts due to an increased ability to separate out other nonweathering variables.Velbel(1993)es-timated elevation-dependent temperature differences in the Coweeta watershed in North Carolina(10.6–11.7°C)and cal-culated an activation energy of77kJ/mol for plagioclase weathering.Dorn and Brady(1995)used plagioclase porosity formed by etch pitting in Hawaiian basaltflows at different elevations and temperatures(12.5–23.3°C)to calculate an ac-tivation energy of109kJ/mol.Recently,Louvat(1997)calcu-lated activation energies ranging between38and43kJ/mol for Si and Na released from basalt weathering based on tempera-ture differences(5–30°C)in small river basins on the islands of Iceland,Reunion,Sao Miguel,and Java.In an investigation of the climate effects on small water-sheds,White and Blum(1995)tabulated chemicalflux data from a global distribution of68watersheds underlain by gran-itoid rocks.These workers delineated the impact of mean annual air temperature(0–22°C)on weathering rates.A rein-forcing effect of high precipitation and temperature was pro-posed to explain rapid weathering rates such as in tropical mountainous regions.On the basis of this coupled model, White and Blum(1995)calculated average apparent activation energies of59and62kJ/mol,respectively,for Si and Nafluxes, values that are very similar to experimental values for plagio-clase(Blum and Stillings,1995).This calculation was heavily dependent on the extreme weathering rates observed for the Rio Icacos watershed in Puerto Rico(White et al.,1998)with a meager amount of published collaborative data for other upland tropical watersheds.The present paper further investigates the temperature effects on granitoid weathering undertaken by the study of White and Blum(1995).The study investigates long-term experimental dissolution of granitoid rock samples from several of the wa-tersheds included in the original study over an environmentally relevant temperature range(5–35°C).Issues related to temper-ature effects on multimineralic rocks are addressed.Experi-mental activation energies are compared to watershed activa-tion energies based on the coupled temperature–precipitation model,which contains an expanded watershed database includ-ing additional tropical watersheds.These results further support the linkage between climate and silicate weathering on the earth’s surface.2.METHODSPairs of fresh and weathered grantoid rock samples were obtained from two alpine watersheds;the upper Merced River in Yosemite National Park,California,and the Loch Vale watershed in Rocky Mountain National Park,California.Additional samples were collected from the subtropical Panola Mountain Research Watershed near At-lanta,Georgia,and the tropical Rio Icacos watershed in the Luquillo Mountains of Puerto Rico.Fresh granitoids were sampled from newly exposed outcrops,road cuts,and from drill core.Weathered samples were taken from natural surface exposures and from fractures in drill core.White et al.(1999)previously reported details on geology,min-eralogy,and chemistry of these granitoids and associated watershed characteristics.The four granitoid rocks will be referred to by their geographic names,that is,the Yosemite granodiorite,the Loch Vale granite,the Panola granodiorite,and the Rio Icacos quartz diorite (Table1).White et al.(1999)described sample preparation and the initial experimental setup.Fresh and weathered rock samples were processed through a jaw crusher and a disc mill and size-separated into a0.25–0.85mm grain size fraction.This fraction approximates the size ranges of mineral grains within the granitoids and decreases the effects of extensive grinding.Samples(750g)were packed into2.4cm ID Pyrex columns.Distilled/deionized water,saturated with a5%CO2/95%air gas mixture,was introduced through fritted supports at the column bases.Flow rates were controlled by gravityflow through capillary tubes.The effluent discharge from the top of each column(ϳ10mL/hr) passed through a0.45mfilter and into5L collection bottles,which were sampled at weekly intervals.Although the apparatus was not sterilized,minimum biological activity was observed in the column over long periods.Experiments at ambient laboratory temperature22Ϯ1°C were conducted for maximum times of1.0ϫ104–1.6ϫ104hr(1.2–1.7yr). Long-term reactions at afixed temperature produced relatively steady-state effluent compositions that served as baselines in assessing subse-quent temperature changes.For nonambient conditions,the columns were jacketed with coiled plastic tubing and plastic foam insulation and the temperatures regulated with circulating water baths.The columnTable1.Chemical composition of fresh and weathered granitoid rocks.SiO2 (wt%)Al2O3(wt%)CaO(wt%)Na2O(wt%)MgO(wt%)K2O(wt%)Calcite(ppm)aYosemite granodioriteFresh71.014.1 3.00 3.32 1.44 2.53670 Weathered69.515.2 2.45 3.930.75 2.7068 Loch Vale graniteFresh72.713.90.78 2.560.28 6.461000 Weathered73.214.30.94 2.850.33 5.5768 Panola granodioriteFresh68.214.8 1.93 3.290.99 4.433320 Weathered69.414.7 1.61 1.49 1.30 5.7768 Rio Icacos Qtz dioriteFresh59.017.87.11 3.19 2.43 1.07320 Weathered58.817.5 6.82 3.04 2.590.8291 a Determined by gas chromatography.3278 A.F.White et al.temperatures were first decreased to a temperature range of 5Ϯ1°C for Ϸ2500hr,subsequently increased to 17Ϯ1°C for Ϸ2500hr,and finally increased to 35Ϯ1°C for Ϸ1500hr.The range of experimental temperatures used for the columns is less than that previously em-ployed in most temperature investigations of silicate dissolution and more accurately simulates natural weathering temperatures.Cation concentrations in the experimental effluents and mineral separates were determined by inductively coupled plasma–mass spec-trometry using a Perkin-Elmer Elan 6000.Analytical methods are similar to those described in Bullen et al.(1997).Alkalinity and pH were measured on collected effluents.87Sr/86Sr ratios were determined by thermal ionization using a Finnigan-MAT 261mass spectrometer and are precise to better than 0.00004at the 95%confidence level.3.EXPERIMENTAL RESULTS3.1.Mineralogy and Rock ChemistryBulk compositions for the fresh and weathered granitoid samples are summarized in Table 1(White et al.,1999).Se-lected mineral abundances,Na,K,and Sr concentrations,and 87Sr/86Sr isotopic ratios as summarized in Table 2(Bullen et al.1998).The plagioclase compositions of the Yosemite granodi-orite (An 0.33),Loch Vale granite (An 0.21),and Panola grano-diorite (An 0.25),correspond to Na-rich oligioclase,whereas plagioclase in the Rio Icacos quartz diorite (An 0.50)is a more calcic andesine.All the granitoids contain biotite.The Panola granodiorite also contains muscovite.The low K contents of the Rio Icacos quartz diorite is reflected in a lack of significant K-feldspar.The higher Mg contents of the Yosemite granodi-orite and Rio Icacos quartz diorite correlate with abundant hornblende,which is a minor component in the Panola grano-diorite and is absent in the Loch Vale granite.Variations in composition between the fresh and weathered granitoid pairs (Table 1)are attributable to natural variations in rock samples,which were collected from different locations.The lack of any consistent losses in major cations in the weathered element compositions relative to their fresh coun-terparts indicates that these rocks have been exposed to only the initial phases of natural weathering and have not undergone significant loss of primary minerals (except calcite)or major element mobilization.3.2.Effluent Compositions and Temperature Effects The total reaction times,effluent volumes,and concentra-tions at the end of successive temperature runs are tabulated in Table plete effluent Si,Na,K,Ca,and Mg data from the fresh and weathered Yosemite granodiorites are plotted in Fig.1.These plots are representative of time and temperature sequences in all the experiments.The horizontal scale refers to the time elapsed since the initiation of the column experimentswith only the effluent data from the last four months of ambient temperature experiments (22°C)included.The plots show con-centration responses to subsequent temperature adjustments to 5°,17°,and 35°C.Effluent concentrations of Si,Na,K,Ca,and Mg derived from the weathered granitoids are significantly lower relative to their fresh counterparts.This implies that crushing of weathered samples to a size fraction comparable to mineral grains within the granitoids did not produce significant fresh reactive surfaces.After thermal reequilibrium to a different column tempera-ture,relatively short times (Ͻ500hr)were required to reestab-lish steady-state effluent Si,Na,and K concentrations.This delayed temperature response,shown in more detail for Na concentrations after the initial temperature decrease from 22°to 5°C (Fig.2),partly reflects hydrodynamic dispersion,in which a finite time is required to flush out pore water that had reacted at the previous temperature.After this initial flushing,Na concentrations approach steady-state conditions as described by mean average effluent concentrations (Fig.2,dashed lines).Similar relatively rapid temperature adjustments are observed for K and Si (Fig.1A).In contrast,Ca,Mg,and Sr require much longer equilibration times in response to experimental temperature changes.In some cases,as shown by the example of effluent Mg after adjustment from 22°to 5°C,steady-state conditions are never acheived.Arrhenius-type plots (Figs.3–5)are used to characterize the effects of column temperature on steady state Si,Na,and K effluent compositions.Effluent concentrations in log units from fresh and weathered granitoids are plotted against the recipro-cal of absolute temperature (1000/°K)on the bottom axis and the equivalent temperature in degree Celsius on the top axis of each figure.Data,which reflect residual effects during temper-ature transitions,are excluded from the plots.In most cases,these excluded data correspond to the first one to three effluent samples collected after the change in column temperature.The dependencies of the effluent Si,Na,and K concentra-tions (C;in micromoles per liter)on column temperature are determined by least square fits to a semi-log linear regression relationship of the formLog C ϭa o ϩa 1/T(°K),(1)where a o is the intercept and a 1is the slope defined in terms of the inverse of absolute temperature °K.Effluent data and re-gression fits are plotted as functions of temperature in Figs.3–5for the fresh (solid lines)and weathered (dashed lines)grani-toids.Fitting parameters are tabulated in Table 4.The temper-ature sensitivity of effluent concentrations is inversely depen-dent on the slope a 1in Eqn.1,which is greater for Si and NaTable 2.Mineral abundances (wt%),Sr,Na,and K concentrations (mg/kg)and Sr isotopic ratios for minerals in fresh granitoid rocks.PlagioclaseK-feldsparBiotiteHornblendewt%Sr Na 87Sr/86Srwt%Sr 87Sr/86Srwt%Sr K 87Sr/86Srwt%Sr 87Sr/86SrYosemite 361100556000.7065157500.7075811376000.87535750.7069Loch Vale 20175653000.7422451900.86624841200 4.83390na na Panola 35750638000.7081206000.7160101179000 1.27302550.7098Rio Icacos55560408000.70410nana 1017752000.782714800.7042na,not available.3279Effect of temperature on chemical weathering rates of granitoid rocksthan for K(Table4).Releases of Si and Na from the granitoids are,therefore,more temperature dependent than is K.Correlation coefficients(r2)in all but four experiments exceeded0.80for Eqn. 1,indicating that the effluent concentrations increase exponen-tially with temperature.Fits for Si effluents from the weathered Yosemite granodiorite did not include data at5°C,which were at or below detection limits(Fig.3A).In contrast to Si,Na,and K,the Ca,Mg,and Sr concentrations from the fresh granitoid rocks generally exhibit negative correla-tions with temperature as is shown for the Yosemite granodiorite and Rio Icacos quartz diorite(Fig.6).Effluent Ca,Mg,and Sr concentrations from the weathered samples are significantly lower than for their fresh counterparts(Table3)and do not show consistent concentration trends with temperature.3.3.Effect of Natural Weathering on TemperatureSensitivityThe temperature trends for effluent Si,Na,and K,defined bythe slope a1in Eqn.1,are parallel to subparallel for fresh andweathered paired granitoids(Figs.3–5).Therefore,the sensi-tivities of effluent concentrations to temperature changes aresimilar whether or not the granitoids have undergone naturalweathering.This is an important observation because it impliesthat the intrinsic nature of the weathering reactions is alsocomparable.At any given temperature,however,the effluentconcentrations from the weathered rocks are lower than fromthe fresh rocks.Natural weathering has decreased Si,Na,and Kconcentrations by a factor of approximatelyfive for the Yo-semite and Panola granitoids(Figs.3–5)and a factor of ap-proximately two for the Loch Vale and Rio Icacos granitoids.These ratios between fresh and weathered effluents are rela-tively consistent over the entire temperature range.No systematic differences in bulk chemistries are apparentbetween any of the fresh and weathered granitoid pairs(Table1).Therefore,the significant temperature-independent de-creases in effluent Si,Na,and K in the weathered granitoidscannot be explained by decreases in primary mineral contents.There is some physical evidence,based on greater friability and Table3.Experimental conditions and effluent compositions at the end of successive temperature runs(M).Sample no.Timeh(102)aVol(L)bT(°C)pH Alk Na Mg Si K Ca Sr86Sr/87SrYosemite FreshCA5414615122 6.337.5 2.59 3.1924.511.47.880.01290.71998 CA641711715 6.231.00.62 3.24 5.4 5.287.520.01210.72301 CA7319118716 6.229.0 1.21 2.2611.8 6.67 6.370.01030.72151 CA7919619734 6.431.07.60 1.3548.77.60 4.320.00990.71582 Yosemite WeatheredCE5013313522 5.9 5.50.400.189.0 1.230.450.00230.71180 CE611561606 5.77.00.120.11 3.10.48Ͻ0.200.00050.71550 CE7218018716 5.6 5.00.220.13 4.50.57Ͻ0.300.00110.71140 CE821952635 5.6 6.5 1.000.2813.3 1.330.610.00440.70932 Loch Vale FreshCC5414615122 6.022.5 2.290.9612.5 1.847.910.00400.84125 CC641701806 5.67.50.380.05 2.30.63 3.850.00320.84919 CC7319120616 5.6 6.50.820.27 6.7 1.03 3.290.00280.85409 CC7920122234 5.811.0 5.750.3625.9 2.47 2.510.00220.83821 Loch Vale WeatheredCG5013313322 5.7 4.0 1.330.1111.6 1.010.500.00130.82610 CG611561596 5.78.50.240.07 3.00.30Ͻ0.200.00020.89300 CG7218017816 5.7 3.50.840.11 6.10.760.280.00090.85950 CG8220219534 5.77.57.190.2833.2 1.990.770.00220.79483 Panola FreshCD5414615222 6.457.5 1.76 1.2324.3 5.2033.70.01980.72766 CD641701776 6.227.50.370.34 5.8 3.0012.40.00870.73062 CD7319019916 6.221.00.680.7712.0 2.7113.70.00930.73095 CD7920321335 6.430.5 4.93 1.2240.7 3.9119.30.02040.71991 Panola WeatheredCF5013314622 5.69.5Ͻ0.200.09 6.80.860.300.00110.73210 CF611561706 5.711.0Ͻ0.100.07 3.50.37 1.010.00050.73700 CF7218019516 5.6 6.00.130.12 5.00.690.490.00080.73030 CF8220221734 5.7 5.5 1.250.3318.0 1.36 1.070.00450.71830 Rio Icacos FreshCB5414616522 6.440.0 3.69 2.2129.311.511.00.01230.70655 CB641711845 6.431.5 1.46 1.9111.9 6.979.570.00900.70691 CB7319119816 6.431.0 2.26 1.5224.48.347.770.00900.70680 CB7920320734 6.633.59.000.9071.814.2 6.550.01010.70660 Rio Icacos WeatheredCK3810510922 6.280.0 2.97 1.6927.511.4 6.050.02100.70564 CK491281386 6.123.00.700.817.1 4.79 5.550.01470.70638 CK6015216816 6.026.0 1.47 1.0313.7 6.38 4.450.01280.70615 CK7017419734 6.037.0 5.96 1.5945.49.998.000.02560.70554a Total elapsed time since initiation of experiment.b Cumulative effluent output.3280 A.F.White et al.more extensive Fe staining,that the Yosemite and Panola samples have been subjected to more natural weathering than the Loch Vale and Rio Icacos samples.The specific surface areas of the minerals tend to increase during alteration by development of internal porosity,favoring increased overall rates (White et al.,1996).Thus,the observed decreases in reaction rates as a result of this initial weathering must correlate with properties of the mineral surfaces,such as decreases in the reactivity or density of high energy sites or reduced surface free energies (White et al.,1996).3.4.Temperature Effects on87Sr/86Sr RatiosSr isotopes are particularly useful for mineral weathering studies because different granitoid minerals typically have sig-nificantly and systematically different 87Sr/86Sr ratios that are not modified during mineral dissolution and subsequent cation exchange reactions (Bullen et al.,1997).The 87Sr/86Sr ratio provides an additional constraint on defining the effects of temperature on granitoid weathering.The Sr concentrations and 87Sr/86Sr ratios for mineral phases contained in the fresh gran-itoid rocks used for this study are given in Table 2.Plagioclase typically has the highest Sr concentrations and the lowest 87Sr/86Sr ratios,whereas biotite has the lowest Sr concentra-tions and the highest 87Sr/86Sr ratios.Sr concentrations and 87Sr/86Sr ratios of column effluents at the end of each temperature experiment run are given in Table 3.As shown in Fig.7,87Sr/86Sr ratios of both fresh and weathered granitoid column effluents are typically highest for the low temperature runs and lowest for the high temperature runs.As indicated by the slopes of the linear regression lines in Fig.7,87Sr/86Sr ratios from the weathered granitoids exhibit a slightly stronger retrograde temperature dependency thandoFig.1.Concentrations of Si and major cations in effluents from (A)fresh and (B)weathered Yosemite granodiorite plotted as a function of time.Vertical dashed lines correspond to changes in temperature.Silica concentrations for 35°C experiments are plotted on separate higher concentrationscale.Fig.2.Changes in Na and Mg effluent concentrations in fresh granitoids after temperature reequilibration from 22°to 5°C.Dashed lines correspond to linear regression fits for Na data after initial temperature equilibration.3281Effect of temperature on chemical weathering rates of granitoid rocksthe fresh granitoid effluents.Qualitatively,the data are consis-tent with a greater contribution of Sr from biotite at low temperatures and a greater contribution from plagioclase (and hornblende,when present)at high temperatures.4.DISCUSSION4.1.Activation EnergiesThe temperature effect on weathering is commonly charac-terized by the Arrhenius relationship,which describes the change in the ratio of reaction rates r and r o (in moles per meter per second)over a temperature range T to T o (°K)such that (Brady and Carroll,1994)r 0ϭexp ͫE a ͩ10Ϫ1ͪͬ(2)E a is the activation energy (in kilojoule per mole)and R is themolar gas constant (in kilojoule per mole per degree Kelvin).The ratios of steady-state effluent concentrations C and C o (in micromoles)characterized by Eqn.1in the present study are equivalent to the ratio of reaction rate ratios in Eqn.2(i.e.,r /r o ϭC/C o )if the mineral surface areas (in square meters)and fluid flow rates (in liters per second)are assumed constant.However,the resulting values for E a ,determined for a multi-component rock,do not necessarily define the temperature-dependent rate constants for unique phases or reactions as required by the Arrhenius expression.In addition,recent stud-ies have found that experimental activation energies for silicate dissolution are dependent on solution composition,in particular pH and Al concentrations (Brady and Walter,1992;Casey and Sposito,1992;Chen and Brantley,1996).The effects of such variables are not considered in the present study.Consequently,temperature dependencies in the present work are discussed in terms of apparent activation energies.Apparent activation energies calculated from Eqn.2are tabulated in Table 4.The mean average activation energiesforFig.3.Arrhenius plots of the log Si effluent concentrations from fresh and weathered granitoid rocks.Lower horizontal scale corresponds to the inverse of absolute temperature and upper nonlinear scale to the temperature increase in °C.Solid and dashed lines correspond to linear fits to the effluents from fresh and weathered granitoids (see text,Eqn.1).3282 A.F.White et al.Si release from the fresh and weathered granitoids are,respec-tively 53Ϯ5kJ/mol and 57Ϯ5kJ/mol (Table 4).Average activation energies for Na are only slightly higher for the fresh and weathered granitoids (57Ϯ15kJ/mol and 65Ϯ8kJ/mol).The magnitude of experimental activation energies has been traditionally related to the nature of the reaction mechanisms.E a values on the order of 50–80kJ/mol have been commonly ascribed to enthalpies for metal cation detachment from silicate surfaces (Lasaga,1984).The average respective E a values for K release from the fresh and weathered granitoids columns are 22Ϯ9kJ/mol and 32Ϯ11kJ/mol.These values are signifi-cantly lower than expected for dissolution of structural cations but are higher than E a values determined for reactions con-trolled by solute diffusion during relatively rapid dissolution processes (10–20kJ/mol;Lasaga,1984).4.2.Experimental Temperature Effects for GranitoidWeatheringExperimental weathering of a multimineralic rock,such as a granitoid,adds complexities to any thermodynamic interpreta-tion of activation energies.The effect of temperature on ele-mental release,such as monitored by effluent concentrations in the present study,reflect the stoichiometries,masses,and re-action rates of various primary minerals present,as well as the precipitation of any secondary phases.4.2.1.Si and Na releaseIf an element in a granitoid is unique to a single dissolving mineral,the resulting temperature dependency may be com-pared to the activation energy for that phase (Eqn.2).Such is the case for Na,which in granitoids is contained predominantly in plagioclase,and is not incorporated to any extent into sec-ondary phases.Activation energies must be interpreted within the context of variable plagioclase stoichiometry,which in the present study ranges from between An 0.21for the Loch Vale granite to An 0.50for the Rio Icacos quartz diorite.Experimental E a values for plagioclases over a comparable composition range are not strongly composition dependent,averaging 60kJ/mol (Blum and Stillings,1995).This activation energyforFig.4.Arrhenius plots of the log Na effluent concentrations from fresh and weathered granitoid rocks.Lower horizontal scale corresponds to the inverse of absolute temperature and upper nonlinear scale to the temperature increase in °C.Solid and dashed lines correspond to linear fits to the effluents from fresh and weathered granitoids (see text,Eqn.1).3283Effect of temperature on chemical weathering rates of granitoid rocks。

温度变高英文作文英文:As the temperature rises, it can have a major impact on our daily lives. For example, during the summer months, we often experience heat waves that can make it difficult to sleep, concentrate, or even go outside. In addition, high temperatures can lead to dehydration, heat exhaustion, and heat stroke, which can be dangerous or even deadly.To cope with rising temperatures, there are several things we can do. First, we can stay hydrated by drinking plenty of water and other fluids. Second, we can wear light, breathable clothing and avoid being outside during the hottest parts of the day. Third, we can use fans, air conditioning, or other cooling devices to keep our homesand workplaces comfortable.However, it's important to remember that rising temperatures are not just a personal inconvenience, butalso a global issue. Climate change is causing temperatures to increase at an alarming rate, which can have devastating effects on the environment, wildlife, and human populations. It's up to all of us to take action to reduce our carbon footprint and slow the pace of climate change.中文:随着温度的升高,它会对我们的日常生活产生重大影响。

The Effect of Temperature on ProteinConformationProteins are essential components of living organisms and are responsible for carrying out various cellular functions. They are composed of long chains of amino acids that are folded into intricate 3-dimensional structures. The specific shape of a protein, or its conformation, plays a critical role in its function. Temperature is one of the key factors that can influence protein conformation. In this article, we will explore the effect of temperature on protein conformation and how it impacts their function.Temperature-induced protein denaturationProtein denaturation is a process in which the protein loses its native conformation and unfolds into a linear or random coil structure. This process can be triggered by several factors, including pH, salts, mechanical stress, and temperature. Among these, temperature is the most commonly studied factor that can induce protein denaturation.When proteins are exposed to high temperatures, the thermal energy causes the bonds that hold the protein structure together to break. Hydrogen bonds, which are weaker than covalent bonds, are the first to be broken. As the temperature continues to rise, the more significant covalent bonds that hold the protein together begin to break, further destabilizing the structure. Ultimately, the protein loses its native conformation, and its function is impaired.The effect of temperature on protein stabilityThe stability of a protein refers to its ability to maintain its native conformation in the face of various environmental conditions, including temperature. The stability of a protein is influenced by several factors, including the amino acid sequence, solvent conditions, and the presence of ligands or cofactors. Temperature can disrupt the stability of a protein by altering its structure and causing it to denature.Proteins have a range of thermal stability that depends on their amino acid sequence and their specific structure. Generally, proteins that are stable at higher temperatures have a higher content of hydrophobic amino acids, which can help to stabilize the structure through hydrophobic interactions. In contrast, proteins that are stable at lower temperatures tend to have more polar amino acids and a lower content of hydrophobic amino acids.The temperature at which a protein denatures is known as its melting temperature or Tm. The Tm of a protein is influenced by its intrinsic stability as well as the specific conditions under which it is studied. For example, the pH, salt concentration, and presence of other molecules can all affect the Tm of a protein.The effect of temperature on protein functionThe specific conformation of a protein plays a critical role in its function. Therefore, changes in protein conformation due to temperature can have a significant impact on their function. The effect of temperature on protein function can vary depending on the specific protein and the conditions under which it is studied.Some proteins are more sensitive to changes in temperature than others. For example, enzymes, which catalyze chemical reactions in the cell, have a specific optimal temperature range at which they function best. Outside of this range, the reaction rate can slow down or even stop altogether due to changes in protein conformation.Other proteins, such as transporters and receptors, are also sensitive to changes in temperature. Changes in protein conformation due to temperature can affect the ability of these proteins to bind to their ligands and carry out their function.ConclusionIn conclusion, temperature has a significant impact on protein conformation. High temperatures can cause proteins to denature, while changes in temperature can alter their stability and affect their function. Understanding the effect of temperature on protein conformation and function is essential for designing experiments and developing new drugs and therapies that target specific proteins.。
温度对半导体影响的书英文回答:The effect of temperature on semiconductors is acrucial aspect to consider in the field of electronics. As temperature changes, it can have both positive and negative impacts on the performance and reliability of semiconductor devices.One of the main effects of temperature on semiconductors is the change in electrical conductivity. Generally, as temperature increases, the conductivity of a semiconductor also increases. This is due to the increased thermal energy, which allows more charge carriers to move freely within the material. As a result, the resistance of the semiconductor decreases, and it becomes more conductive.However, this positive effect of temperature on conductivity can also have negative consequences. For instance, if the temperature rises too high, it can lead tothermal runaway, where the increased conductivity causes excessive heating and further increases the temperature. This can ultimately result in the device failing or even burning out.Another important effect of temperature on semiconductors is the impact on bandgap energy. The bandgap energy is the energy difference between the valence band and the conduction band in a semiconductor. At higher temperatures, the bandgap energy decreases, which meansthat the semiconductor becomes more conductive and allows more charge carriers to move across the bandgap. This can affect the performance of devices such as diodes and transistors, as it can lead to increased leakage currents and reduced efficiency.Furthermore, temperature can also affect the mobility of charge carriers in semiconductors. Mobility refers to the ease with which charge carriers can move through the material. At higher temperatures, the mobility of both electrons and holes in a semiconductor generally increases. This can lead to improved device performance, as the chargecarriers can move more freely and quickly. However, at extremely high temperatures, the mobility can besignificantly reduced due to scattering effects, which can negatively impact device performance.In addition to these electrical effects, temperaturecan also affect the mechanical properties of semiconductors. For example, as the temperature changes, the coefficient of thermal expansion of the semiconductor material can cause stress and strain in the device. This can lead to mechanical failure or even cracking of the semiconductor.中文回答:温度对半导体的影响是电子领域中需要考虑的一个关键因素。
P u b l i s h i n gAustralian Journal of Agricultural Research CSIRO PublishingPO Box 1139 (150 Oxford St)Collingwood, Vic. 3066, Australia Telephone: +61 3 9662 7628Fax: +61 3 9662 7611Email: publishing.ajar@csiro.auPublished by CSIRO Publishingfor CSIRO and the Australian Academy of Sciencew w w.p u b l i s h.c s i r o.a u /j o u r n a l s /a j a rAll enquiries and manuscripts should be directed to:A ustralian J ournal of A gricultural R esearchVolume 53, 2002© CSIRO 2002A journal for the publication of original contributions towards the understanding of an agricultural systemAust. J. Agric. Res., 2002, 53, 707–714 The effects of temperature elevation and water deprivation on lambphysiology, welfare, and meat qualityTim E. Lowe AE,Neville G. Gregory AB,Andrew D. Fisher AC,and Steven R. Payne ADA MIRINZ Food Technology and Research, Ruakura Research Centre, Hamilton, New Zealand.B Current address: South Australia Research & Development Institute, Flaxley, SA 5153, Australia.C Animal Behaviour & Welfare Research Centre, AgResearch, Private Bag 3123, Hamilton, New Zealand.D Current address: Bioengineering Technologies, HortResearch, Private Bag 3123, Hamilton, New Zealand.E Corresponding author; current address: Crop & Food Research, PO Box 5114, Port Nelson, New Zealand;email: tlowe@Abstract.Romney-cross ewe lambs (n = 27) were subjected to controlled environmental conditions to induce acute heat stress. The goals of the study were to: (1) determine appropriate physiological indicators of acute heat stress, (2) determine threshold rectal temperatures (T r) for catecholamine and cortisol release, (3) determine effectson meat quality, and (4) assess the effect of dehydration on the above measures. There were 3 treatments: control (ambient temperature and humidity), heat stress (33°C, and 85–100% humidity), and heat stress combined with water deprivation. The duration of the treatment period was 12 h. Respiration rate (R f) and rectal temperature (T r) were highly correlated with increasing temperature humidity index (THI) (r > 0.75, P < 0.001), whereas heart rate was less responsive to THI (r = 0.30, P < 0.05). The welfare of these lambs was at risk at T r greater than 40.5°C, a point at which respiration rate was maximal and unable to prevent further increases in T r. Plasma cortisol concentrations were increased in heat-stressed lambs after T r reached approximately 40.7°C. Plasma catecholamines were only elevated in lambs when T r was greater than 42°C. The majority of lambs subjected to heat stress had a T r less than 42°C, and there were no significant effects on meat quality. Despite exhibiting increases in plasma protein concentrations, there were no indications that dehydrated lambs were under additional stress during heat challenge in comparison with hydrated lambs.Additional keywords: heat stress, hyperthermia, dehydration, catecholamines, cortisol.IntroductionHeat stress is a common problem for livestock in warmer climates, with losses in milk and meat production during heat waves (Hahn and Mader 1997), and it is thought to be a factor in reduced meat quality in cattle (Scanga et al.1998). Acute heat stress can occur when animals are in microenvironments with extra thermoregulatory demands, such as when confined to yards or trucks. If the heat stress is not recognised and alleviated, heat exhaustion and mortality can occur. Conditions that cause heat stress, and animal-based indices of measuring heat stress, need to be better understood, and are of increasing relevance to quality assurance and welfare auditing programs.Heat loss in animals is mainly achieved by evaporative heat loss, via sweating and respiration (panting), and this links increasing heat loads with increasing water loss. Therefore, heat challenge is of particular concern in dehydrated animals. In cattle, for example, dehydration can delay the onset of sweating, with a corresponding increase in rectal temperature (Bianca 1965). D ehydration combined with exercise (increased heat load) in humans, activates the sympatho-adrenal system elevating plasma catecholamines and reducing renal concentrating ability (Melin et al. 1997). Similarly, in livestock, when body core temperatures reach threshold levels, elevation of catecholamines has been shown to occur in pigs (Stefanovic 1970) and dairy cows (Katti et al. 1991).The tolerance of sheep to high temperatures (Lee 1950), and their cardiovascular and respiratory responses to such conditions, have been investigated (Bell et al. 1983), along with the endocrine responses of sheep to mild heat stress and the effect of dehydration (Parrott et al. 1996). However, the threshold body temperatures that elicit catecholamine and cortisol responses in sheep are not known. Similarly, the additional effect of dehydration on acute heat stress in sheep has not been examined, nor has acute heat stress been induced in order to examine its effects on meat quality.© CSIRO 200210.1071/AR011250004-9409/02/060707708T. E. Lowe et al.In this study, our goals were 4-fold: (1) to determine appropriate physiological indicators of acute heat stress in lamb, (2) to determine the likely rectal temperature (T r) threshold for catecholamine and cortisol release in lambs,(3)to measure the effects of heat stress on meat quality, and(4) to assess the additional effect of dehydration on heat stress responses.The indicators of heat stress and dehydration used in this study included the temperature humidity index (THI), rectal temperature (T r), heart rate (HR), and respiration rate (R f).D ehydration was assessed using body weight loss, and indicators of blood and urine concentration (haematocrit, plasma protein, plasma osmolality, urine osmolality and production). In addition, the hormonal stress response was measured using plasma and urinary adrenaline, noradren-aline, and cortisol. The major urinary catecholamine metab-olite vanilmandelic acid (VMA) was also measured. The metabolic response to heat stress and dehydration was measured using non-esterified fatty acids (NEFA), plasma urea nitrogen (PUN), β-hydroxybutyrate (BOH), lactate, and glucose. The replication of measures in plasma and urine was to assess the usefulness of urine to measure these responses as urine can be collected non-invasively. Materials and methodsAnimals and experimental designThis experiment was conducted with the approval of the Ruakura Animal Ethics Committee, Hamilton, New Zealand.Romney-cross ewe lambs (n = 27; 21–32 kg) were blocked by weight and allocated to 3 treatment groups, each of 9 animals. The animals had been maintained on pasture at Ruakura Research Centre, Hamilton, NZ, and supplemented with hay and Multifeed nuts (NRM New Zealand Ltd, Auckland, NZ), and had been shorn 2 months previously.The treatments were: control (C), heat stress (HS), and dehydration plus heat stress (DHS). To familiarise the lambs with the pens in the treatment rooms, they were held in the pens for 1–2 h on 6 occasions in the month before the experiment.The experiment was conducted over 3 consecutive weeks, with 3 animals in each treatment group per week. The experimental protocol is summarised in Table 1. The lambs were yarded at 1700 hours the day before the experiment, and fasted overnight. During holding, the C and the HS groups had access to water, whereas the DHS group did not. The following morning, each animal was fitted with a jugular cannula for blood collection and a 14-gauge foley urethral catheter for urine collection. Three self-adhesive electrodes for measuring the electrocardiogram (ECG) were placed on shaved skin around the chest. The animals were then weighed and placed in their pens.During the experiment, the lambs were held in individual pens (1.5 by 0.65 m) with 3 sheep to a room. The control room was at ambient temperature; the other 2 rooms were kept at ambient temperature until the final 12 h of the experiment, when both rooms were heated to approximately 33°C and 85–100% relative humidity. The rooms were heated using electrical fan heaters and the humidity increased by vapour from boiling water baths. The time schedules for sampling and applying treatments to the 3 treatment groups were staggered by 1 h. Air temperature and humidity were recorded every 45 min using a hand-held meter (Almeno 2290-2, Leitz, Germany). These data were used to calculate the temperature humidity index (THI) using the following equation (Johnson 1994):THI = T db + (0.36 * T dp) + 41.5where T db is the dry bulb temperature and T d p is the dewpoint temperature.At the conclusion of the experiment, the animals were weighed and transported to the slaughter-house (approximately 0.4 km).Sample collection and analysisBlood samples were collected every 3 h via the jugular cannula. On each occasion, 16 mL of blood was collected. Blood for catecholamine anaylsis (6 mL) was mixed with sodium metabisulfite (10 mg), and the centrifuged plasma frozen in liquid nitrogen and stored at –75°C. Plasma for total protein and osmolality determination was chilled. Plasma for cortisol analysis was frozen at –20°C. Frozen plasma aliquots (–75°C) were used for determination of NEFA, PUN, and BOH concentrations.In the holding period prior to experimental sampling, urine was collected from catheters hourly, and the volume recorded. Thereafter, urine was collected and the volume recorded every 3 h. The catheter was removed if a lamb showed continued discomfort. Urine subsamplesTable 1.Sequence of events and feeding treatments of experimental groupsTime:1700–0800(15 h)0800–1200(4 h)1200–1800(6 h)0600–2400(6 h)2400–1200(12 h)1200–0100Event:Sheep in yardsovernight Sheep instrumentedand put into pensSheep in pens Sampling andmonitoring startedHeat treatmentstarted. 33°C and85–100% relativehumiditySheep slaughtered andmeat sampledTreatment groupControl Water Water Water Water WaterHeat Water Water Water Water Water,heat Dehydrated + heat No water No water No water No water No water, heatSamplesBlood and urine Every 3 h(3 samples)Every 3 h(4 samples)Heart rate, respiration rate, rectal temperature Every 45 min(9 samples)Every 45 min(15 samples)Temperature elevation and water deprivation effects on lambs709were frozen at –75°C pending catecholamine analysis, and at –20°C for cortisol and creatinine analysis. Urine osmolality was measured within a day of collection on chilled subsamples.Catecholamines were extracted from plasma and urine, and analysed as described by He et al. (1997). The coefficient of variation for external standards was 3.26% and 3.81% for noradrenaline (NA) and adrenaline (A), respectively. Epinine was used as an internal standard. The extraction efficiencies were 63.7 ± 3.5, 64.7 ± 3.6, and 66.8 ± 3.5% (mean ± s.e.) for noradrenaline, adrenaline, and epinine, respectively.Urinary VMA concentrations were determined by HPLC with electrochemical detection. The column used was a Prodigy 150 × 4.6, 3µ ODS(3) (Phenomenex, New Zealand). The mobile phase consisted of 4.8 g/L of K3PO4, 10.7 g/L of KH2PO4, 0.2 g/L of tetrabutylammonium hydrogen sulfate (TBAHS), 1% methanol. Vanilmandelic acid and TBAHS were purchased from Sigma (Australia). Urine samples were prepared for analysis by mixing equal volumes of urine and 1 M HCL, this was neutralised with 2 M K2CO3, and after centrifugation the supernatant was diluted 4-fold in ultra pure water (ELGA, Vivendi Water Systems Pty Ltd, Sydney, Australia).Plasma cortisol samples were analysed using RIA. The sensitivity of the assay was 1.0 ng/mL. Samples were run as a single assay, with a CV of 11.6%.Urine cortisol concentrations were measured using a competitive cortisol enzymeimmunoassay (EIA) developed by Munro and Stabenfeldt (1985). Assay sensitivity was 5 pg/well and all samples from an individual animal were analysed in the same assay. The inter-and intra-assay coefficients of variation for control samples were 7.2 and 4.7%, respectively, for the high sample, and 4.8 and 7.6%, respectively, for the low sample.Respiration rate, heart rate,and rectal temperatureThe HR, R f, and T r were recorded every 45 min throughout the experiment. The R f was calculated in 2 ways, depending on the respiration rate of the sheep. At slow R f (<60), the number of breaths taken in 30 s was recorded by an observer. At fast R f (>60), the time taken for 30 breaths was recorded. Observers also noted if the lambs were open-mouthed panting. The ECG was recorded using a remote telemetric system and stored on a computer. Stored ECGs were later used to derive HR. Rectal temperatures were measured using flexible digital thermometers (Becton Dickinson and Company, Canada). The volume of water drunk by each lamb on the C and HS treatments was also measured.Carcass composition and meat qualityAt the end of the experiment, the lambs were slaughtered and dressed, and then chilled to 10°C. At 24 h post-mortem, the m. longissimus thoracis et lumborum (LT) was removed and meat colour L, a, and b values (mean of 3 readings) were obtained by a Hunter Lab Miniscan model MS/S-4000S (Hunter Associates Laboratory Inc., Reston, V A, USA) using D65 (daylight) illumination, observer angle 10 degrees (standardised using a white plate), and pH was measured using a Mettler Toledo pH meter with an Ingold probe. The 24-h pH was also measured on 3 leg muscles (m. infraspinatus, triceps brachii, and psoas major).An estimate of relative body fatness from the carcasses of the 18 lambs that were heat-stressed was measured in a sample leg by dissection into fat, muscle, bone, and other tissue, using the method of Timon and Bichard (1967).Statistical analysesWater consumption, weight loss, and meat pH and colour were analysed using ANOV A. Where significant differences were found, groups were compared using Tukey’s multi-comparison procedure. The effects of treatment and time for blood and urine variables were analysed using repeated measures ANOV A. The analysis was restricted to the last 4 samples (after heating began in the HS and DHS groups), using the first 3 measures taken (before heating began) as a covariate. Data relating to urine production and cortisol, and plasma cortisol, glucose, lactate, and PUN were log-transformed. Treatment, time, and treatment × time effects were tested after adjustment of the degrees of freedom using the greenhouse-geisser correction. These analyses were performed using G ENSTAT 5, Release 4.1.ResultsDehydrationLambs on the DHS treatment lost more weight than lambs on the C and HS treatments during the 22–24-h period from when the sheep were instrumented until slaughter (Table 2). This was a relative decrease of 3.2% in the DHS treatment compared with the C treatment. Of the 2 treatments with access to water, the HS lambs drank more water than the C lambs (Table 2).Plasma and urine osmolality, plasma protein, and haema-tocrit data are shown in Table 3. Plasma osmolality increased to be higher in DHS lambs, compared with C and HS lambs, by the 12-h sample. There was a tendency for urine osmolality to be higher in lambs on the DHS treatment than in lambs on the other treatments (P < 0.10). Urine production did not differ between treatments. There was a treatment ×time interaction for plasma protein concentrations, whereby the HS treatment caused plasma protein to decrease in comparison with the other treatments. The haematocrit did not change in response to treatment.Environmental and rectal temperature, heart rate, and respiration rateThe mean THI values for the climate rooms for the 3 trial periods are shown in Fig. 1a. Over a period of 4 h, the THI for the HS and DHS treatments increased from less than 75 to 86, whereas THI values in the C room remained less than 75. The corresponding changes in T r, HR, and R f are shown in Fig. 1b–d. The T r in the HS and DHS lambs continually increased throughout the heating period (Fig. 1b). The T r was highly correlated with THI (r = 0.795, P < 0.001) and R f (r=0.750, P < 0.001). The R f was also highly correlated with THI (r = 0.834, P < 0.001). However, HR was less strongly correlated with THI (r = 0.302, P < 0.05), T r (r = 0.4775, P < 0.01), and R f (r = 0.289, P < 0.05). Both R f and Table 2.Amounts of water drunk by lambs and changes in wholeanimal weight while in pensThe results are mean ± s.e.m. Within rows, values followed by same letter are not significantly different at P = 0.05Control(n = 9)HS(n = 8)DHS(n = 7) Water drunk (L)0.37 ±0.13a 1.56 ±0.25b No water offered Weight lost (kg) 1.33 ±0.19a0.787 ±0.24a 2.14 ±0.30b% Weight lost 5.1 3.08.3710T. E. Lowe et al.T a b l e 3.P l a s m a a n d u r i n a r y v a r i a b l e s f o r l a m b s d u r i n g t h e t r e a t m e n t p e r i o dV a r i a b l eC o n t r o l (n = 9)H e a t s t r e s s (n = 8)D e h y d r a t i o n a n d h e a t s t r e s s (n = 7)T m tT i m e T m t ×l .s .d .l .s .r .A36912036912036912T i m eH a e m a t o c r i t31.132.933.432.130.131.933.332.333.332.827.428.430.129.830.5n .s .n .s .n .s .3.1(%)P l a s m a p r o t e i n 74.274.073.173.273.078.576.876.075.074.378.577.778.779.480.2n .s .n .s .**3.2(g /L )P l a s m a o s m o l a l i t y 292294292292292292292292292290291295295297299*n .s .n .s .2.1(m o s m o l )U r i n e o s m o l a l i t y 638884899889868663754737668529839913939958905n .s .n .s .n .s .264(m o s m o l )U r i n e p r o d u c t i o n 813742263065333335195944242729n .s .n .s .n .s .2.73(m L /3 h )P l a s m a a d r e n a l i n e 0.2060.2260.2250.1730.2040.1750.1820.2290.2050.2160.1850.2030.1980.1960.173n .s .n .s .n .s .0.035(n g /m L )P l a s m a n o r a d r e n a l i n e 0.4490.5710.6220.4250.5190.6070.6860.7360.6760.6770.5650.7270.7280.6330.755n .s .n .s .n .s .0.141(n g /m L )P l a s m a c o r t i s o l 12.014.519.918.317.810.411.310.429.623.311.218.618.221.433.4n .s .***1.92(n g /m L )U r i n e V M A B0.0710.0690.0630.0760.0740.0880.0930.0740.0940.1000.0510.0730.0730.0500.067n .s .n .s .n .s .0.105U r i n e c o r t i s o l B34.531.035.640.339.129.327.53852.662.141.036.139.134.439.4n .s .*****1.35P l a s m a l a c t a t e 0.370.410.390.350.370.370.410.400.610.590.400.430.490.580.62n .s .**1.42(m m o l )P l a s m a g l u c o s e 2.862.562.522.852.713.022.962.913.443.413.223.213.263.453.38*****n .s .1.19(m m o l )N E F A 0.801.211.271.170.910.911.151.091.281.180.830.931.151.110.96n .s .**0.249(m m o l )P U N 9.268.858.998.978.879.218.688.718.939.628.317.727.978.749.17n .s .****1.27(m m o l )B O H 0.610.690.830.970.950.670.730.820.921.000.630.740.820.890.99n .s .***n .s .0.13(m m o l )*P < 0.05; **P < 0.01; ***P < 0.001; n .s ., n o t s i g n i f i c a n t .A l .s .r . i s t h e l e a s t s i g n i f i c a n t r a t i o a n d i s p r e s e n t e d i n s t e a d o f t h e l .s .d . f o r a l l d a t a t h a t w e r e l o g -t r a n s f o r m e d i n d a t a a n a l y s i s . T h e l .s .d . a n d l .s .r . r a t i o s a r e f o r c o m p a r i n g t r e a t m e n t m e a n s a t a c o m m o n t i m e p o i n t (i .e . l .s .d ./l .s .r . f r o m t r e a t m e n t × t i m e s t r a t u m ).B (µg /µm o l c r e a t i n i n e ).Temperature elevation and water deprivation effects on lambs711T r responded quickly to increased THI, whereas HR was less responsive. The R f appeared to reach a maximal rate soon after the onset of heat stress, and then settled at a slightly lower rate after approximately 6 h (Fig. 1d). The initial fast R f, at the beginning of heat stress, was a shallow form of panting, whereas the later slower R f was deeper, and the lambs appeared noticeably uncomfortable and demonstrated open-mouthed panting. Behavioural changes after the onset of heat stress included increased time standing in the heated groups.Catecholamines and cortisolPlasma NA and A, and urinary VMA concentration did not vary significantly with treatment, time, or treatment × time (Table 3). There was a treatment × time effect for plasma cortisol concentrations, such that concentrations increased more over time in the HS and DHS lambs (Table 3). There was also a treatment × time effect for urine cortisol concentrations, but only values for HS lambs were elevated in comparison with C and DHS lambs (Table 3).Metabolic indicatorsPlasma lactate concentrations increased with time and showed a treatment × time interaction (Table 3). Lactate concentrations in the C lambs were constant throughout the experimental period, whereas lactate increased in the HS and D HS lambs. Plasma glucose concentrations were lower (P<0.05) in the C lambs compared with the HS and DHS lambs (Table 3). There was also a time effect for glucose, with concentrations increasing over the duration of the experiment.There was a treatment × time effect for NEFA (Table 3). At 12 h, NEFA concentrations in HS lambs were higher than in C lambs (P < 0.05). In addition, individual NEFA concentrations were correlated with the proportion of fat in the leg (r = 0.633, P < 0.01), but were not correlated with plasma or urinary catecholamine and cortisol concentrations, or with T r (P > 0.05). There were treatment × time effects for PUN (P < 0.01), such that PUN concentrations increased over the course of the experiment in HS and DHS lambs, but remained stable in C lambs. PlasmaFig. 1.Changes in THI, T r, HR, and R f with time.712T. E. Lowe et al.BOH concentrations showed an increase with time (P<0.001; Table 3).Meat qualityMeat colour values in the LT did not differ between treatments (P > 0.80). The overall mean values (±s.e.m.) for L, a, and b were 40.4 ± 0.4, 17.9 ± 0.2, and 11.6 ± 0.2, respectively. Ultimate pH varied between different muscle types, but did not show any difference between treatments (Table 4).Case animalsTwo lambs (one from each of the HS and DHS treatments) developed rectal temperatures of ≥42°C. Both of these animals showed a large rise in plasma catecholamines, urinary VMA, and plasma and urinary cortisol after T r reached 42°C. The final sample values for lactate and glucose in these animals were the highest recorded for any time or animal in the entire study.DiscussionThe conditions of moderately high temperature and high humidity used in this study were an effective means of raising T r, and by inference body core temperature. Respiration rate was the most sensitive measure of elevated T r, and increased proportionately. Maximal R f was reached at a T r of approximately 40.5°C, but there was no significant change in HR at this point. The HR did subsequently increase in association with further increases in T r, but R f was a better correlate of T r. There were no changes in catecholamine concentrations until lambs exceeded a T r of 42°C. At this T r in these lambs, there was also a suite of other physiological responses consistent with elevation of catecholamines.Sheep are a panting species, and increase their R f in response to elevated body temperature induced by high environmental temperature or exercise (Bligh 1963; Hales and Webster 1967; Rawson and Quick 1970). The strong correlations of R f with T r and THI in this study demonstrate the usefulness of R f as an external, non-invasive indicator of heat stress.In comparison, HR was not strongly correlated with either T r or THI, and there was no increase in HR until after the first 3 h of heating. Y et, at the same time, the heat-stressed groups had elevated T r by 1°C and increased R f from 25 to 200, when compared with the control animals. A redirection of blood flow for increased cooling, rather than an increase in cardiac output in the early stages of heat stress, may be the reason for the minimal increases in HR (Baker and Hayward 1968; Bell et al. 1983). An additional problem in the use of HR as an indicator of heat stress is its sensitivity to exercise (Bell et al. 1983).The only evidence for elevation of catecholamines as a consequence of heat stress in this study occurred in the 2 lambs whose T r exceeded 42°C. However, these lambs were the exception in the experiment and there were no significant effects of heat stress treatments on plasma noradrenaline, adrenaline, or urinary VMA. In humans, if exercise is combined with heat stress the threshold for increased catecholamine secretion can be as low as 38.5°C (Melin et al. 1997). The elevation of T r in this experiment was due to high environmental temperature without exercise, and there was no indication that dehydration enhanced catecholamine release. In other species, catecholaminergic responses to heat stress alone are: 41.5°C in pigs (Barrand et al. 1981), 43°C in rats (Gisolfi et al. 1991), and 40.5°C in oxen (Robertshaw and Whittow 1966).Plasma cortisol is a commonly used stress indicator, and both plasma and urinary cortisol increased in heat-stressed lambs to a greater extent than the increase for control lambs. This result only partially agrees with the findings of Parrott et al. (1996), who found that the experimental environment, but not high temperature, increased cortisol in sheep. Our study involved more acute and intense levels of heat challenge, and this may explain the disparity in these results. Studies of dairy cows and pigs show that heat stress is a potent stimulus for cortisol secretion in these species (Elvinger et al. 1992; Becker et al. 1997). In the present study, plasma cortisol concentrations were increased in heat-stressed lambs after about 9 h, when T r values reached approximately 40.7°C. A corresponding increase in urine cortisol concentrations was only detected in the HS lambs, possibly due to the greater variability of this measure.Although heat stress increased cortisol secretion, there was no additional effect of dehydration in the DHS lambs. Likewise, plasma metabolic indicators were increased by heat stress to a similar extent in both HS and DHS lambs. Given that there were small increases in plasma protein concentrations and no difference in plasma osmolality in D HS lambs compared with HS lambs, the extent of dehydration induced was mild, and did not significantly affect physiological responses in comparison with the effect of heat stress alone. It would appear from these results that lambs would need to be under even more severe water deprivation than that imposed in this study for it to be a potentiating factor in clinical heat stress. However, it is possible that dehydration may affect recovery from heat stress, which was not tested in this study.Table 4.Meat ultimate pH in infraspinatus, triceps brachii, psoas major, and longissimus dorsi muscles 24 h post-mortemThe results are mean ± s.e.m.Group infraspinatus tricepsbrachii psoasmajorlongissimusthoracis etlumborumC (n = 9) 6.02 ± 0.06 5.86 ± 0.07 5.79 ± 0.03 5.66 ± 0.01 HS (n = 8) 5.94 ± 0.06 5.87 ± 0.11 5.73 ± 0.02 5.66 ± 0.03 DHS (n = 7) 5.94 ± 0.03 5.92 ± 0.08 5.82 ± 0.05 5.66 ± 0.02。
UO/MSI CH 668 Polymer Thermal, Molecular, and Rheological Characterization (Summer 2013)QUIZ (50 points) DSC Curves from FORD and SETARAMOPEN BOOK/NOTES (NO people)The following problems are real data from companies that presented these to us for analysis.1) (35 points) DSC Curves for Polylactic Acid (PLA) under different molding conditions. Polylactic Acid (PLA) is a biodegradeable plastic material that is being considered for various automotive applications by the Ford Motor Company. The toughness and strength of PLA is significantly affected by the molding conditions, based primarily on the degree of final crystallinity of the injection molded part. One of the engineers has conducted experiments where she has varied the mold temperature and holding time in the mold. The thermal characterization lab has run DSC on the various samples for the engineer (see accompanying data). She would like to have you help her interpret the results. The goal is to determine the optimum (remember that time is money!) mold temperature and holding time to achieve high crystallinity in the final molded part. Start by explaining the DSC curves to her (label the curves), explain how to approximate the % relative crystallinity and then give her your recommendations. Please be a specific as possible.2) (15 points) DSC Curves for Polystyrene under high gas pressuresYou are working for a company that makes membranes for gas separations which are typically run under high pressure. One of your colleagues approaches you with some interesting data on theglass transition temperature for polystyrene under high pressure using a methane gas (see accompanying plots). The glass transition temperature of PS dropped from approximately 95°C at1bar to 65°C at 250 bar. To make things even more puzzling, they repeated the experiment with nitrogen gas and saw no change in the glass transition temperature.Can you offer a molecular explanation for this, based on your knowledge of the meaning ofthe glass transition temperature?。