SAE J1455-1994 汽车电器试验标准
- 格式:pdf
- 大小:497.00 KB
- 文档页数:52
SAEJ(标准参考)翻译1 范围该SAE标准涵盖了应⽤于汽车球墨铸铁铸件和相关的⾏业的铸铁试件的⾦相组织和最低机械性能要求。
铸件需详细说明是铸态或热处理状态。
如果铸件需热处理,需获得客户的批准。
本附录提供了在化学成分,显微组织和⼒学性能,铸造性能等⽅⾯⾯信息以及为特定条件服务的其他信息。
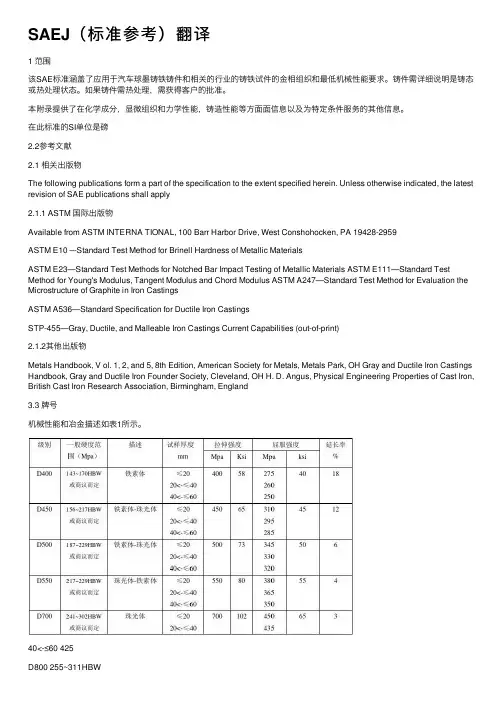
在此标准的SI单位是磅2.2参考⽂献2.1 相关出版物The following publications form a part of the specification to the extent specified herein. Unless otherwise indicated, the latest revision of SAE publications shall apply2.1.1 ASTM 国际出版物Available from ASTM INTERNA TIONAL, 100 Barr Harbor Drive, West Conshohocken, PA 19428-2959ASTM E10 –-Standard Test Method for Brinell Hardness of Metallic MaterialsASTM E23—Standard Test Methods for Notched Bar Impact Testing of Metallic Materials ASTM E111—Standard Test Method for Young's Modulus, Tangent Modulus and Chord Modulus ASTM A247—Standard Test Method for Evaluation the Microstructure of Graphite in Iron CastingsASTM A536—Standard Specification for Ductile Iron CastingsSTP-455—Gray, Ductile, and Malleable Iron Castings Current Capabilities (out-of-print)2.1.2其他出版物Metals Handbook, V ol. 1, 2, and 5, 8th Edition, American Society for Metals, Metals Park, OH Gray and Ductile Iron Castings Handbook, Gray and Ductile Iron Founder Society, Cleveland, OH H. D. Angus, Physical Engineering Properties of Cast Iron, British Cast Iron Research Association, Birmingham, England3.3 牌号机械性能和冶⾦描述如表1所⽰。
汽车用电器盒企业标准1、范围本规范规定了汽车用电器盒的技术要求、试验方法、检验规则及标志、包装、运输、储存。
本规范适用于xxx公司各种车型。
2、规范性引用文件下列文件中的条款通过本标准的引用而成为本标准的条款。
凡是注日期的引用文件,其随后所有的修改单(不包括勘误的内容)或修订版均不适用于本标准,然而,鼓励根据本标准达成协议的各方研究是否可使用这些文件的最新版本。
凡是不注日期的引用文件,其最新版本适用于本标准。
GB 2423.1-1989 电工电子产品基本环境试验规程试验A:低温试验方法GB2423.2-1989 电工电子产品基本环境试验规程试验B:高温试验方法GB2423.10-1995 电工电子产品基本环境试验规程试验FC:振动(正弦)试验方法GB2423.22-1987 电工电子产品基本环境试验规程试验N:温度变化试验方法QC/T 413-1999 《汽车电气设备基本技术条件》QC/T 420-1999 《汽车用熔断器》QC/T 417.1~417.5-2001《车用电线束插接件》3、术语3.1 连接插头:用来与外部电路进行电连接的电器的导电部分。
3.2 连接插座:用于与继电器插头或保险片连接的具有一定卡紧力的插座。
3.3 插接力:将继电器端子或标准插片插入接线盒所需的力。
3.4 拔出力:将继电器插头或标准插片从接线盒中拔出所需的力。
3.5 桥接片在测量电压降时,连接继电器或保险丝拆下后需要导通部位具有不同形状的一种接线片3.6 连续定额:连续定额是制造厂对产品所规定的可以长期运行的负载和条件。
4、技术要求4.1 接线盒应符合本标准的规定,并按照经规定程序批准的图样及设计文件制造。
接线盒为连续定额。
规定采用的熔断器应符合QC/T 420-1999《汽车用熔断器》的规定,插接件应符合QC/T 417.1~417.5-2001《车用电线束插接器》的规定4.2 接线盒的外形及安装尺寸应符合产品图样的规定。
二、电子设备可靠性测试标准1、ISO国际标准化组织中,ISO/TC22/SC3?负责汽车电气和电子技术领域的标准化工作。
汽车电子产品的应用环境包括电磁环境、电气环境、气候环境、机械环境、化学环境等。
目前ISO?制订的汽车电子标准环境条件和试验标准主要包含如下方面:ISO16750-1:道路车辆-电子电气产品的环境条件和试验:总则ISO16750-2:道路车辆-电子电气产品的环境条件和试验:供电环境ISO16750-3:道路车辆-电子电气产品的环境条件和试验:机械环境ISO16750-4:道路车辆-电子电气产品的环境条件和试验:气候环境ISO16750-5:道路车辆-电子电气产品的环境条件和试验:化学环境ISO20653?汽车电子设备防护外物、水、接触的等级ISO21848?道路车辆-供电电压42V?的电气和电子装备电源环境国内目前汽车电子产品的环境试验标准主要还是按照产品的技术条件来规定。
全国汽车标准化技术委员会(SAC/TC114)正在参照ISO?标准制订相应的国家和行业标准。
ISO?的标准在欧美车系的车厂中得到了广泛采用,而日系车厂的要求相对ISO?标准来说偏离较大。
为了确保达到标准的限值,各汽车车厂的内控的环境条件标准一般比ISO?的要求要苛刻。
2、AEC?系列标准上个世纪九十年代,克莱斯勒、福特和通用汽车为建立一套通用的零件资质及质量系统标准而设立了汽车电子委员会(AEC),AEC?建立了质量控制的标准。
AEC-Q-100?芯片应力测试的认证规范是AEC?的第一个标准。
AEC-Q-100?于1994?年首次发表,由于符合AEC?规范的零部件均可被上述三家车厂同时采用,促进了零部件制造商交换其产品特性数据的意愿,并推动了汽车零件通用性的实施,使得AEC?标准逐渐成为汽车电子零部件的通用测试规范。
经过10?多年的发展,AEC-Q-100?已经成为汽车电子系统的通用标准。
在AEC-Q-100?之后又陆续制定了针对离散组件的AEC-Q-101?和针对被动组件的AEC-Q-200?等规范,以及AEC-Q001/Q002/Q003/Q004?等指导性原则。
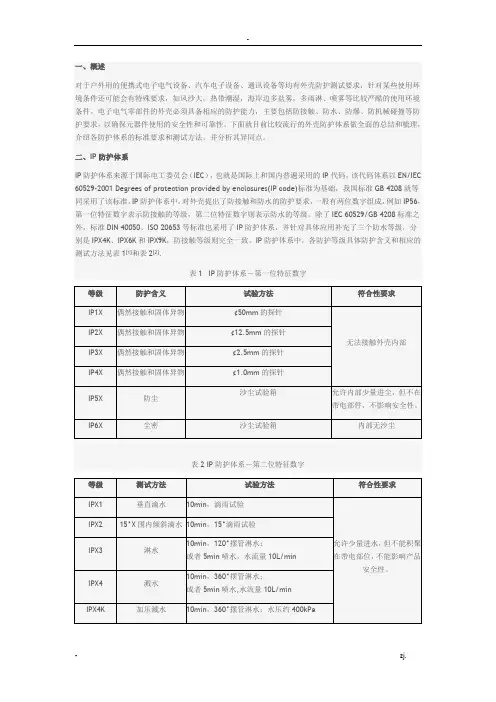
一、概述对于户外用的便携式电子电气设备、汽车电子设备、通讯设备等均有外壳防护测试要求,针对某些使用环境条件还可能会有特殊要求,如风沙大,热带潮湿,海岸边多盐雾,多雨淋、喷雾等比较严酷的使用环境条件。
电子电气零部件的外壳必须具备相应的防护能力,主要包括防接触、防水、防爆、防机械碰撞等防护要求,以确保元器件使用的安全性和可靠性。
下面就目前比较流行的外壳防护体系做全面的总结和梳理,介绍各防护体系的标准要求和测试方法,并分析其异同点。
二、IP防护体系IP防护体系来源于国际电工委员会(IEC),也就是国际上和国内普遍采用的IP代码,该代码体系以EN/IEC 60529-2001 Degrees of protection provided by enclosures(IP code)标准为基础,我国标准GB 4208就等同采用了该标准。
IP防护体系中,对外壳提出了防接触和防水的防护要求,一般有两位数字组成,例如IP56,第一位特征数字表示防接触的等级,第二位特征数字则表示防水的等级。
除了IEC 60529/GB 4208标准之外,标准DIN 40050、ISO 20653等标准也采用了IP防护体系,并针对具体应用补充了三个防水等级,分别是IPX4K、IPX6K和IPX9K,防接触等级则完全一致。
IP防护体系中,各防护等级具体防护含义和相应的测试方法见表1[1]和表2[2].表1 IP防护体系-第一位特征数字参考文献:[1] GB 4208-2008/IEC 60529-2001外壳防护等级(IP代码)[2] ISO 20653-2006 Road vehicles – Degrees of protection (IP-Code) – Protection of electrical equipment against foreign objects. Water and access[3] GB/T 20138-2006/IEC 62262;2002电器设备外壳对外界机械碰撞的防护等级< IK代码>[4] NEMA Standards Publication 250-2003 Enclosures for Electrical Equipment(1000 Volts Maximum)[5] JIS D0203-1994 Method of moisture, rain and spray test for automobile[6] JIS D0207-1977 General rules of dust test for automobile parts。
sae 标准SAE标准,即美国汽车工程师学会(Society of Automotive Engineers)标准,是国际上广泛采用的一套汽车行业技术标准,它涵盖了从车辆设计和制造到测试和评估的各个方面。
SAE标准由SAE国际组织负责制定和发布,其目的是为了确保汽车和汽车相关设备的安全性、性能和可靠性,并促进全球汽车行业的技术进步和统一。
在汽车行业中,SAE标准被广泛应用于各个领域,包括车辆设计、发动机技术、车辆传动系统、车辆电子控制等。
下面是一些关于SAE标准的相关参考内容:1. SAE J1939: 这是一项涉及汽车网络通信的SAE标准。
它定义了一种用于车辆通信的控制器局域网(CAN)协议,用于传输车辆诊断信息、车载控制命令和传感器数据等。
该标准规定了通信协议、数据格式、诊断服务和电气连接等要求。
2. SAE J2522: 这是一项关于车辆电子系统电磁兼容性的SAE标准。
它规定了车辆电子系统在电磁环境下的工作要求,包括电磁辐射限值、敏感度测试、抗扰度测试等。
该标准旨在确保车辆电子系统在电磁环境中的正常运行,并减少电磁干扰对其造成的影响。
3. SAE J2807: 这是一项关于车辆拖曳能力测试的SAE标准。
它规定了用于评估汽车和轻型卡车拖曳能力的测试方法和要求。
该标准定义了拖曳车辆的参数和限制条件,以确保车辆在拖曳任务中的安全性和可靠性。
4. SAE J826: 这是一项关于汽车人体工程学设计的SAE标准。
它规定了在设计车辆驾驶舱和座椅时应考虑的人体工程学要求,包括驾驶员身体尺寸、姿势和动作等方面。
该标准旨在提高驾驶员的舒适性、安全性和操作便捷性。
5. SAE J3061: 这是一项关于车辆网络安全的SAE标准。
它提供了一种用于评估和管理汽车网络安全风险的方法,包括威胁建模、安全需求分析和安全验证等。
该标准旨在确保车辆网络系统的安全性和防护能力,防止恶意攻击和非法访问。
总之,SAE标准在汽车行业中具有重要的地位和作用。
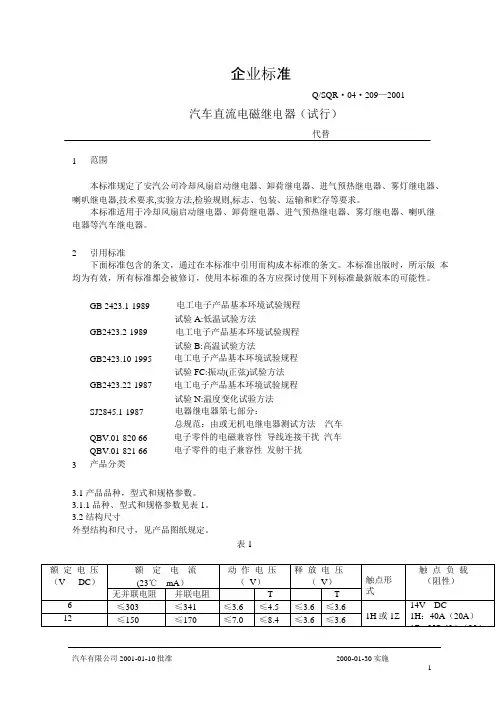
1企业标准Q/SQR·04·209—2001汽车直流电磁继电器(试行)代替范围本标准规定了安汽公司冷却风扇启动继电器、卸荷继电器、进气预热继电器、雾灯继电器、喇叭继电器,技术要求,实验方法,检验规则,标志、包装、运输和贮存等要求。
本标准适用于冷却风扇启动继电器、卸荷继电器、进气预热继电器、雾灯继电器、喇叭继电器等汽车继电器。
2 引用标准下面标准包含的条文,通过在本标准中引用而构成本标准的条文。
本标准出版时,所示版本均为有效,所有标准都会被修订,使用本标准的各方应探讨使用下列标准最新版本的可能性。
GB2423.1-1989GB2423.2-1989 GB2423.10-1995 GB2423.22-1987 SJ2845.1-1987QBV.01-82066 QBV.01-82166电工电子产品基本环境试验规程试验A:低温试验方法电工电子产品基本环境试验规程试验B:高温试验方法电工电子产品基本环境试验规程试验FC:振动(正弦)试验方法电工电子产品基本环境试验规程试验N:温度变化试验方法电器继电器第七部分:总规范:由或无机电继电器测试方法汽车电子零件的电磁兼容性导线连接干扰汽车电子零件的电子兼容性发射干扰3产品分类3.1 产品品种,型式和规格参数。
3.1.1 品种、型式和规格参数见表1。
3.2 结构尺寸外型结构和尺寸,见产品图纸规定。
表124≤80.8≤91≤14.2≤16.0≤3.6≤3.6)NC.30A(20A)4 技术要求4 技术要求4.1 环境条件4.1.1 温度贮存(无载):按5.2 条规定进行试验。
试验后,继电器的动作电压和释放电压应符合4.2.2条规定,接触压降应符合4.2.3条规定。
4.1.2 温度贮存(带载):按5.3 条规定进行试验。
试验后,继电器的动作电压和释放电压应符合4.2.2条规定,接触压降应符合4.2.3条规定。
4.1.3 温度变化:按5.4条规定进行试验。
汽车内部线束耐压试验标准概述说明以及解释1. 引言1.1 概述汽车内部线束耐压试验是对汽车内部电气线束在不同的耐压条件下进行测试,以确保其安全可靠地工作。
线束耐压试验是汽车行业中非常重要且必要的环节,它能够验证线束是否满足国家及行业标准的要求,以提高汽车的整体质量和可靠性。
1.2 文章结构此文将详细介绍汽车内部线束耐压试验的基本概念、重要性以及标准介绍。
接下来的章节将进一步探讨该测试方法,并对其中涉及到的关键要点进行解释和说明。
最后,文章将给出结论和建议,强调对于应用和遵守汽车内部线束耐压试验标准的必要性。
1.3 目的本文旨在为读者提供关于汽车内部线束耐压试验的全面认识。
通过阐述该测试方法的概念、重要性和相关标准,读者能够了解到该测试在保障汽车电气系统安全可靠运行方面所起到的作用。
同时,本文还将深入分析该测试方法中涉及到的关键因素和注意事项,帮助读者更好地理解并正确应用线束耐压试验标准。
2. 正文:2.1 汽车内部线束耐压试验基本概念解释汽车内部线束是指将电器设备连接起来的电线连接系统。
耐压试验是一项用于测试汽车内部线束在高压力、高温度和高湿度等极端条件下的稳定性和可靠性的测试工艺。
在汽车设计和制造过程中,对汽车内部线束进行耐压试验非常重要。
该测试能够确保线束在各种极端环境下仍然能够正常运行,避免因为电线松动、短路或损坏等问题导致的故障和事故。
2.2 汽车内部线束耐压试验的重要性说明汽车内部线束经受着各种外界环境的影响,比如高温、潮湿或者长时间运行后产生的振动等。
如果没有进行适当的耐压试验,这些因素可能会导致电子设备无法正常运作,甚至引发火灾等严重安全问题。
通过进行汽车内部线束耐压试验,可以验证其在不同工况下的稳定性,并评估其安全性和可靠性。
这些测试包括暴露于高温、低温、高湿度等极端环境下以及承受机械压力和振动等。
只有通过耐压试验,汽车制造商才能确保线束的质量,并提供可靠且安全的汽车产品。
2.3 汽车内部线束耐压试验标准介绍在汽车行业,有一系列的标准和规范用于指导和规范汽车内部线束耐压试验。

J1455RECOMMENDED400 Commonwealth Drive, Warrendale, PA 15096-0001Submitted for recognition as an American National Standard(R) JOINT SAE/TMC RECOMMENDED ENVIRONMENTAL PRACTICES FOR ELECTRONIC EQUIPMENTDESIGN (HEAVY-DUTY TRUCKS)1. Scope—The climatic, dynamic, andinfluence the performance and reliability of vehicle and tractor/trailer electronic components, are included inthis SAE Recommended Practice. Test methods that can be used to simulate these environmental conditionsSAE Technical Standards Board Rules provide that: ―This report is published by SAE to advance the state of technical and engineering sciences. The use of this report is entirely voluntary, and its applicability and suitability for any particular use, including any patent infringement arising therefrom, is the sole responsibility of the user.‖SAE reviews each technical report at least every five years at which time it may be reaffirmed, revised, or cancelled. SAE invites your written comments and suggestions.QUESTIONS REGARDING THIS DOCUMENT: (412) 772-8512 FAX: (412) 776-0243TO PLACE A DOCUMENT ORDER; (412) 776-4970 FAX: (412) 776-0790SAE WEB ADDRESS FIGURE 1—TIME INTO RUN-MINUTES VEHICLE WARM-UP CHARACTERISTICSThe vehicle electronic component designer is urged to develop a systematic, analytic method for dealing steady-state and transient thermal analysis. The application of many devices semiconductors is temperature limited. For this reason, the potential extreme operatingeach application must be scrutinized to avoid failure in the field.FFECT O N P ERFORMANCE—The damaging effects of thermal stock and thermal cycling include:Cracking of printed circuit board or ceramic substrates.Thermal stress of fatigue failures of solder joints.FIGURE 2A—24 HOUR THERMAL CYCLEFIGURE 2B—SHORT (8 HOUR) THERMAL CYCLE FIGURE 2C—THERMAL SHOCKFIGURE 3—VEHICLE ENVIRONMENTAL ZONESFIGURE 4—RECOMMENDED HUMIDITY CYCLESSTEAM CLEAN/PRESSURE WASH CHAMBERFor pressure washing with water/detergent, the previous test should be run at 40gage) with a flow rate of approximately 9460 cm3/min (150 gal/h).None.FungusThe fungus test is used to determine the resistance of the vehicle electronic component to fungi and to determine if it is adversely affected by fungi under conditions favorable for their development;for example, high humidity, warm atmosphere, and inorganic salts.Microorganisms digest organic materials; thus, degrading the substrate, reducing the surface tension, and increasing moisture penetration.Products of cellular metabolism diffuse out of the cells and cause physical and chemical changes to Microorganisms produce bridges across components which may result in electrical failure.Resistance to biological attack can be determined by chemical analysis of the nutritive value ofmaterials and material decomposition products used in the equipment.The most common way to determine the effect of fungal growth on electronic inoculate the test item with a fungal sporecomponent to permit fungal growth, and examine and test the item. Incubation normally takes placeand humidity conditions that approximateassure suitable fungal growth.Conductive solutions used as a spore media and growth accelerator may affect operational tests.None.FIGURE 6—SAMPLE CAB MOUNTED VIBRATION PSD CLASS 8 TRUCK, VERTICAL AXISFIGURE 7—SAMPLE CAB MOUNTED VIBRATION PSD TRANSVERSE AXISFIGURE 8—SAMPLE CAB MOUNTED VIBRATION PSD CLASS 8 TRUCK, LONGITUDINAL AXISFIGURE 9—SAMPLE ENGINE VIBRATION DATA (VERTICAL), HEAVY-DUTY TRUCKFIGURE 10—CHASSIS VIBRATION DATA, PSD, BOBTAIL VERTICAL MID FRAME, HEAVY-DUTY TRUCK FIGURE 11—CHASASIS VIBRATION DATA, PSD, BOBTAIL VERTICAL REAR FRAME, HEAVY-DUTY TRUCKFIGURE 12—OPERATIONAL SHOCK PROFILEnot typical of component mounting locations,environment. This information is provided for guidance accepted test procedures at the present time.FIGURE 13—48 KM/H (30 MPH) BARRIER AND SLED SHOCK PROFILESPECIFICATIONS—Two specifications are recommended for consideration. The first,203B, Random Drop, is designed to uncover failures that may result from theshocks that occur in shipping and handling. It is an endurance test. The second, MIL-STD-202F,213B, Shock (Specified Pulse), is intended to measure the effect of known or generally accepted shock pulse It is intended that operational shock be reduced into a standard pulse shape to achieve a repeatable test method. Other valuable guidance can be found in MIL-STD-810D, Method 516.3.General Heavy-Duty Truck Electrical Environment—Factors unique to the truck/tractor that make the vehicular environment more severe than those encountered in most electrical componentapplications are:Interaction with other vehicular electronic/electrical systems on the truckVoltage variationsCustomer added equipmentLack of maintenanceComplex external electromagnetic fieldsFIGURE 14—COMBINED THERMAL AND ELECTRICAL STRESS PROFILEThe voltage applied and removed at the two points shown in Figure 14 is generally 16 V, the maximum normal voltage. If the test is performed for the high voltage battery jump start conditionnarrower temperature range is used. This is a destructive test that is often used as an indication of basic design environmental capability. The number of cycles expected before failure, the actual limit values for temperature and voltage, and the period of each cycle are dependent on the designelectronic component being considered.Samples of finished units are generally tested for extended operation at the peak voltage/temperature combination expected at the component's location. In the absence of an actual combination, the values in Table 1A and 1B are recommended. These tests often runperiods and are particularly stringent for electronic components in the underhood environment.Twenty-four Volt SystemDefinition—A normally operating vehicle will maintain supply voltages ranging from +22 to +32 V DC.However, under certain conditions, the voltage may fall to approximately 18 V DC. This can happen in an idling vehicle that has a heavy electrical load (lights and air-conditioning) and a fully discharged battery. Therefore, depending upon the application, the designer/user may specify the +18 to +32 V DC range. For specific equipment that must function during engine start, voltage may be specified. Cold cranking of the engine with a partially depleted battery at -40 ︒C (-40 ︒F) can reduce the nominal 24 V to 13.3 V minimum at the battery terminals. At the starter motor terminals, because of the voltage drop on the battery cabling, the voltage typically varies sinusoidally from 10.6 V to 16 V at about 4 HzFIGURE 15—LOAD DUMP TRANSIENTdump transient contains considerable electrical energy which must beblocked to prevent damage to electronic component. This transient occurs randomly in time appearing as individual or repetitive pulses at random unknown rates due to vibration. See for more information.Load Switching Transient—Inductive transients are caused by solenoid,conditioning clutch, and ignition system switching. These occur during vehicle operation whenever an inductive accessory is turned off. Severity is dependent on the magnitude of switched inductive load line impedance. Unfortunately, measurements to date have not been takenprocedures and were most probably observed with different loads.These transients generally take the form of large positive or negative peaks, followeddamped excursions of the opposite polarity. Transients of this nature may cause component damage or introduce logic or functional computational errors. Table 4A illustrates typical values for 12 V systems and Table 4B shows typical values for 24 V systems.FIGURE A1—MAXIMUM EXPECTED TRUCK ACCELERATION LEVELSDuring testing the test item shall be operated and monitored as if it were in normal usage.After completion of the test duration, inspect the test item and compare it to the pretest data and physical condition. Record the results.Repeat low level sweeps and note any significant changes in the resonant frequencies. A change in resonant frequency may constitute a failure.。
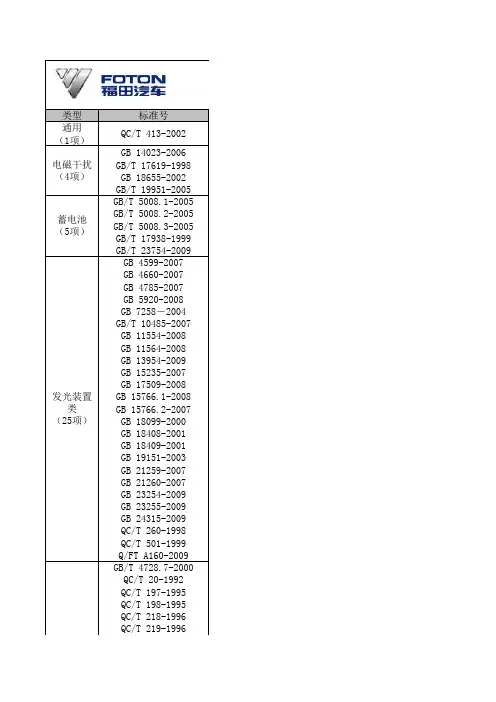
类型标准号通用(1项)QC/T 413-2002GB 14023-2006GB/T 17619-1998GB 18655-2002GB/T 19951-2005GB/T 5008.1-2005GB/T 5008.2-2005GB/T 5008.3-2005GB/T 17938-1999GB/T 23754-2009GB 4599-2007GB 4660-2007GB 4785-2007GB 5920-2008GB 7258-2004GB/T 10485-2007GB 11554-2008GB 11564-2008GB 13954-2009GB 15235-2007GB 17509-2008GB 15766.1-2008GB 15766.2-2007GB 18099-2000GB 18408-2001GB 18409-2001GB 19151-2003GB 21259-2007GB 21260-2007GB 23254-2009GB 23255-2009GB 24315-2009QC/T 260-1998QC/T 501-1999Q/FT A160-2009GB/T 4728.7-2000QC/T 20-1992QC/T 197-1995QC/T 198-1995QC/T 218-1996QC/T 219-1996汽电磁干扰(4项)发光装置类(25项)(16项)蓄电池(5项)、传感器(18项)汽车电器类标准汇总标准名称汽车电气设备基本技术条件车辆、船和有内燃机驱动的装置无线电骚扰特性限值和测量方法机动车电子电器组件的电磁辐射抗扰性限值和测量方法用于保护车载接收机的无线电骚扰特性的限值及测量方法道路车辆静电放电产生的电骚扰试验方法起动用铅酸蓄电池 技术条件起动用铅酸蓄电池 产品品种和规格起动用铅酸蓄电池 端子的尺寸和标记工业车辆 电动车辆牵引用 铅酸蓄电池 优先选用的电压铅酸蓄电池槽汽车用灯丝灯泡前照灯汽车用灯丝灯泡前雾灯汽车及挂车外部照明和光信号装置的安装规定汽车及挂车前位灯、后位灯、示廓灯和制动灯配光性能(实施日期2010.1.1)机动车安全运行技术条件道路车辆 外部照明和光信号装置 环境耐久性机动车和挂车用后雾灯配光性能 (实施日期2010.1.1)机动车回复反射器警车、消防车、救护车、工程救险车标志灯具(实施日期2010.5.1)倒车灯配光性能汽车及挂车转向信号灯配光性能 (实施日期2010.1.1)道路机动车辆灯丝灯泡 尺寸、光电性能要求道路机动车辆灯丝灯泡 性能要求汽车及挂车侧标志灯配光性能汽车及挂车后牌照板照明装置配光性能汽车驻车灯配光性能机动车用三角警告牌汽车用气体电光源前照灯汽车用前照灯清洗器货车及挂车 车身反光标识(实施日期2009.7.1)汽车昼间行驶灯配光性能校车标识(实施日期2010.1.1)汽车高位制动灯汽车信号闪光器技术条件汽车用电子式闪光器技术条件电气简固用图形符号 第7部分:开关、控制和保护器件汽车用气压式制动灯开关技术条件汽车常用开关的安装尺寸汽车用开关通用技术条件汽车用转向管柱上组合开关技术条件汽车用脚踏式变光开关。
汽车零部件的耐振动等级通常是根据国际标准或行业标准进行测试和评估的。
以下是一些常见的汽车零部件耐振动等级标准:
1. ISO 16750-3:这是国际标准化组织(ISO)制定的标准,用于评估汽车电子设备在振动环境下的可靠性。
该标准规定了不同类型的振动测试,包括正弦振动、随机振动和混合振动。
2. SAE J1455:这是美国汽车工程师协会(SAE)制定的标准,用于评估汽车零部件在振动环境下的耐久性。
该标准涵盖了各种类型的振动测试,包括正弦振动、随机振动和道路模拟振动。
3. ECE R10.05:这是欧洲经济委员会(ECE)制定的标准,用于评估汽车电子设备在振动环境下的可靠性。
该标准规定了振动测试的要求和方法。
这些标准通常会根据振动的频率、振幅、持续时间和方向等因素来确定耐振动等级。
不同的汽车零部件可能有不同的耐振动等级要求,具体取决于其在车辆中的位置、功能和使用条件。
需要注意的是,耐振动等级的评估和测试通常需要专业的设备和实验室进行。
汽车制造商和供应商通常会根据相关标准进行测试,以确保零部件在振动环境下的可靠性和耐久性。
汽车试验与质量评定标准精选(最新)G1495《GB1495-2002汽车加速行驶车外噪声限值及测量方法》G3847《GB3847-2005压燃式发动机和压燃式发动机汽车排气烟度排放限值及测量方法》G4970《GB/T4970-2009汽车平顺性试验方法》G4971《GB/T4971-2009汽车平顺性术语和定义》G6323《GB/T6323-2014汽车操纵稳定性试验方法》G6792《GB/T6792-1996客车车身骨架应力、形变测量方法》G10716《GB/T10716-2012同步带传动汽车同步带物理性能试验方法》G11340《GB11340-2005装用点燃式发动机重型汽车曲轴箱污染物排放限值》G12535《GB/T12535-2007汽车起动性能试验方法》G12545《GB/T12545.1~2-2001乘用车及商用车辆燃料消耗量试验方法》G12676《GB12676-2014商用车辆和挂车制动系统技术要求及试验方法》G12540《GB/T12540-2009汽车最小转弯直径、最小转弯通道圆直径和外摆值测量方法》G12542《GB/T12542-2009汽车热平衡能力道路试验方法》G12543《GB/T12543-2009汽车加速性能试验方法》G12544《GB/T12544-2012汽车最高车速试验方法》G12546《GB/T12546-2007汽车隔热通风试验方法》G12547《GB/T12547-2009汽车最低稳定车速试验方法》G12782《GB/T12782-2007汽车采暖性能要求和试验方法》G13043《GB/T13043-2006客车定型试验规程》G13563《GB/T13563-2007滚筒式汽车车速表检验台》G13564《GB/T13564-2005滚筒反力式汽车制动检验台》G13594《GB/T13594-2003机动车和挂车防抱制动性能和试验方法》G13872《GB/T13872-2002货运挂车产品质量检查试验规程》G13873《GB/T13873-2009道路车辆货运挂车试验方法》G14172《GB/T14172-2009汽车静侧翻稳定性台架试验方法》G14761《GB/T14761-1999汽车排放污染物限值及其测试方法》G14762《GB14762-2008重型车用汽油发动机与汽车排气污染物排放限值及测量方法(中国III、IV阶段)》G14763《GB14763-2005装用点燃式发动机重型汽车燃油蒸发污染物排放限值》G14894《GB/T14894-2005城市轨道交通车辆组装后的检查与试验规则》G15085《GB15085-2013汽车风窗玻璃刮水器和洗涤器性能要求和试验方法》G15086《GB15086-2013汽车门锁及车门保持件的性能要求和试验方法》G15742《GB15742-2001机动车用喇叭的性能要求及试验方法》G16739.1《GB/T16739.1-2004汽车维修业开业条件第1部分:汽车整车维修企业》G16739.2《GB/T16739.2-2004汽车维修业开业条件第2部分:汽车专项维修业户》G17339《GB/T17339-1998汽车安全玻璃耐化学浸蚀性和耐温度变化性试验方法》G17349.1《GB/T17349.1-1998道路车辆汽车诊断系统词汇》G17349.2《GB/T17349.2-1998道路车辆汽车诊断系统图形符号》G17469《GB/T17469-2012汽车制动器衬片摩擦性能评价小样台架试验方法》G17691《GB17691-2005车用压燃式、气体燃料点燃式发动机与汽车排气污染物排放限值及测量方法(中国III、lV、V阶段)》G17752《GB/T17752-1999汽车燃油节能添加剂试验评定方法》G17753《GB/T17753-1999汽车发动机润滑油节能添加剂试验评定方法》G18274《GB/T18274-2000汽车鼓式制动器修理技术条件》G18275《GB/T18275.1~2-2000汽车制动传动装置修理技术条件》G18276《GB/T18276-2000汽车动力性台架试验方法和评价指标》G18285《GB18285-2005点燃式发动机汽车排气污染物排放限值及测量方法(双怠速法及简易工况法)》G18296《GB18296-2001汽车燃油箱安全性能要求及试验方法》G18305《GB/T18305-2003/ISO/T S16949:2002质量管理体系汽车生产件及相关维修零件组织应用GB/T19001-2000的特别要求》G18344《GB/T18344-2001汽车维护、检测、诊断技术规范》G18352.1《GB/T18352.1-2001轻型汽车污染物排放限值及测量方法(I)》G18352.2《GB/T18352.2-2001轻型汽车污染物排放限值及测量方法(II)》G18352.3《GB18352.3-2005轻型汽车污染物排放限值及测量方法(中国III、IV阶段)》G18377《GB/T18377-2001汽油车用催化转化器的技术要求和试验方法》G18565《GB18565-2001营运车辆综合性能要求和检验方法》G18566《GB/T18566-2011道路运输车辆燃料消耗量检测评价方法》G18697《GB/T18697-2002声学汽车内噪声测量方法》G19233《GB/T19233-2008轻型汽车燃料消耗量试验方法》G19344《GB19344-2003在用燃气汽车燃气供给系统泄漏安全技术要求及检验方法》G19951《GB/T19951-2005道路车辆静电放电产生的电骚扰试验方法》G20069《GB/T20069-2006道路车辆牵引座强度试验》G20731《GB/T20731-2006车轮平衡机的检验》G20890《GB20890-2007重型汽车排气污染物排放控制系统耐久性要求及试验方法》G20913《GB/T20913-2007乘用车正面偏置碰撞的乘员保护》G21910《GB/T21910-2008轿车轮胎湿路面相对抓着性能试验方法》G22127《GB22127-2008散装水泥车罐体安全质量》G23335《GB/T23335-2009天然气汽车定型试验规程》G25979《GB/T25979-2010道路车辆重型商用汽车列车和铰接客车横向稳定性试验方法》G26778《GB/T26778-2011汽车列车性能要求及试验方法》G26780《GB/T26780-2011压缩天然气汽车燃料系统碰撞安全要求》G26987《GB/T26987-2011道路车辆路面摩擦特性测定》G27840《GB/T27840-2011重型商用车辆燃料消耗量测量方法》G27999《GB27999-2011乘用车燃料消耗量评价方法及指标》G28529《GB/T28529-2012平板式制动检验台》G28957.1《GB/T28957.1-2012道路车辆用于滤清器评定的试验粉尘第1部分:氧化硅试验粉尘》G28957.2《GB/T28957.2-2012道路车辆用于滤清器评定的试验粉尘第2部分:氧化铝试验粉尘》G28958《GB/T28958-2012乘用车低温性能试验方法》G28962《GB/T28962-2012液化石油气汽车定型试验规程》G29041《GB/T29041-2012汽车轮胎道路磨耗试验方法》G29063《GB/T29063-2012道路车辆制动衬片摩擦材料气制动商用车性能试验方法》G29121《GB/T29121-2012道路车辆乘用车列车横向稳定性试验》G29125《GB/T29125-2012压缩天然气汽车燃料消耗量试验方法》QC35《QC/T35-1992汽车与挂车气压控制装置台架试验方法》QC38《QC/T38-1992汽车与挂车气压调节保护装置台架试验方法》QC40《QC/T40-1992气卸散装电石粉车性能试验方法》QC42《QC/T42-1992汽车盘式制动器摩擦块试验后表面和材料缺陷的评价》QC75《QC/T75-1998矿用自卸汽车定型试验规程》QC216《QC/T216-1996汽车用地毯的性能要求和试验方法》QC221《QC/T221-1997汽车轻合金车轮性能要求和试验方法》QC223《QC/T223-2010自卸汽车试验方法》QC236《QC/T236-1997汽车内饰材料性能试验方法》QC237《QC/T237-1997汽车驱车制动器性能台架试验方法》QC241《QC/T241-2011汽车无内胎车轮密封性试验方法》QC242《QC/T242、243、717-2004汽车车轮质量要求及测试方法》QC244《QC/T244-1997汽车车轮安全带动态要求及测试方法》QC248《QC/T248-1998汽车化油器性能试验方法》QC249《QC/T249-1998机械膜片式汽油泵试验方法》QC250《QC/T250-1998矿用自卸汽车试验方法制动性能试验》QC252《QC/T252-1998专用汽车定型试验规程》QC255《QC/T255-1998运钞车防护性能试验方法》QC259《QC/T259-2011车轮轮辋与轮辐焊接强度要求及试验方法》QC311《QC/T311-2008汽车液压制动主缸性能要求及台架试验方法》QC449《QC/T449-2000保温车、冷藏车性能试验方法》QC474《QC/T474-2011客车平顺性评价指标及限值》QC476《QC/T476-2007客车防雨密封性限值及试验方法》QC529《QC/T529-2000汽车动力转向器总成台架试验方法》QC564《QC/T564-2008乘用车制动器性能要求及台架试验方法》QC568.1《QC/T568.1-2011汽车机械式变速器总成台架试验方法第1部分:微型》QC630《QC/T630-1999汽车排气消声器性能试验方法》QC637《QC/T637-2000汽车发动机曲轴弯曲疲劳试验方法》QC646.1《QC/T646.1-2000汽车粉尘密封性试验粉尘洞法》QC647《QC/T647-2000汽车转向万向节总成性能要求及试验方法》QC648《QC/T648-2000汽车转向拉杆总成性能要求及试验方法》QC649《QC/T649-2000汽车转向传动轴总成性能要求及试验方法》QC650《QC/T650-2000汽车转向拉杆球头销要求及试验方法》QC654《QC/T654-2005摩托车和轻便摩托车制动器台架试验方法》QC677《QC/T677-2001卧铺客车平顺性随机输入行驶试验方法》QC728《QC/T728-2005汽车整车大气暴露试验方法》QC732《QC/T732-2005乘用车强化腐蚀试验方法》QC754《QC/T754-2006液化天然气汽车定型试验规程》QC759《QC/T759-2006汽车试验用城市运转循环》QC788《QC/T788-2007汽车踏板装置性能要求及台架试验方法》QC789《QC/T789-2007汽车电涡流缓速器总成性能要求及台架试验方法》QC790《QC/T790-2007制动气室性能要求及台架试验方法》QC900《QC/T900-1997汽车整车产品质量检验评定方法》QC901《QC/T901-1997汽车发动机产品质量检验评定方法》QC938《QC/T938-2013汽车对行人的碰撞保护试验规程》QC29096《QC/T29096-1992汽车转向器总成台架试验方法》JT316《JT/T316-2010货运挂车产品质量检验评定方法》JT413《JT/T413-2000就车式车轮动平衡仪技术条件》JT425《JT/T425-2000汽车维修业质量检验人员技术水平》JT426《JT/T426-2000汽车列车性能要求及试验方法》JT445《JT/T445-2008汽车底盘测功机》JT448《JT/T448-2001汽车悬架装置检测台》JT455《JT/T455-2001环型线圈车辆检测器》JT487《JT/T487-2003货运挂车气压制动技术要求和试验方法》JT488《JT/T488-2003轿车运输挂车性能试验方法》JT494《JT/T494-2003汽油机进气阀沉积物模拟试验方法》JT497《JT/T497-2004乘用车悬架特性检测和评定方法》JT(合)509《JT/T509~512-2004汽车维护、检测技术规范》(合订本)JT632《JT/T632-2005汽车故障电脑诊断仪》JT634《JT/T634-2005汽车前轮转向角检验台》JT638《JT/T638-2005汽车发动机电喷嘴清洗检测仪》JT639《JT/T639-2005汽车车体校正机》JT649《JT/T649-2006多功能汽车制动性能检测台》JT670《JT/T670-2006车辙试验机》GA123《GA/T123-1995移动式机动车安全检测站条件》GA131《GA/T131-1996消防车产品质量定期检查试验规程》GA468《GA468-2004机动车安全检验项目和方法》GA485《GA/T485-2004便携式制动性能测试仪》HJ289《HJ/T289-2006汽油车双怠速法排气污染物测量设备技术要求》HJ290《HJ/T290-2006汽油车简易瞬态工况法排气污染物测量设备技术要求》HJ291《HJ/T291-2006汽油车稳态工况法排气污染物测量设备技术要求》HJ292《HJ/T292-2006柴油车加载减速工况法排气烟度测量设备技术要求》HJ395《HJ/T395-2007压燃式发动机汽车自由加速法排气烟度测量设备技术要求》HJ500《HJ500-2009轻型汽车车载诊断(OBD)系统管理技术规范》MT881《MT/T881-2000露天矿用自卸汽车适应性试验方法》SH0634《SH/T0634-1996水冷二冲程汽油机油滤清器堵塞倾向测定法》JJG133《JJG133-2005汽车油罐车容量》JJG847《JJG847-2011滤纸式烟度计检定规程》JJG906《JJG906-2009滚筒反力式制动检验台》JJG908《JJG908-1996汽车侧滑检验台》JJG909《JJG909-2009滚筒式车速表检验台检定规程》JJG1001《JJG1001-2005机动车近光检测仪校准器》JJG1014《JJG1014-2006机动车检测专用轴(轮)重仪》JJG1020《JJG1020-2007平板式制动检验台》JJG1047《JJG1047-2009金属努氏硬度计》JJG1048《JJG1048-2009标准努氏硬度块》JJF1141《JJF1141-2006汽车转向角检验台校准规范》JJF1151《JJF1151-2006车轮动平衡机校准规范》JJF1154《JJF1154-2014四轮定位仪校准规范》JJF1168《JJF1168-2007便携式制动性能测试仪校准规范》JJF1169《JJF1169-2007汽车制动操纵力计校准规范》JJF1192《JJF1192-2008汽车悬架装置检测台校准规范》JJF1193《JJF1193-2008非接触式汽车速度计校准规范》JJF1196《JJF1196-2008机动车方向盘转向力—转向角检测仪校准规范》JJF1221《JJF1221-2009.汽车排气污染物检测用底盘.测功机校准规范》JJF1227《JJF1227-2009汽油车稳态加载污染物排放检测系统校准规范》JJF1248《JJF1248-2010通道式车辆放射性监测系统校准规范》JJF1375《JJF1375-2012机动车发动机转速测量仪校准规范》JJF1385《JJF1385-2012汽油车简易瞬态工况法用流量分析仪校准规范》JJF1481《JJF1481-2014汽车排放气体测试仪型式评价大纲》JJF1482《JJF1482-2014透射式烟度计型式评价大纲》JJF1483《JJF1483-2014滤纸式烟度计型式评价大纲》JJF1489《JJF1489-2014四轮定位仪校准装置校准规范》。
电动汽车定型试验规程中强制性标准检测项目-CAL-FENGHAI-(2020YEAR-YICAI)_JINGBIAN电动汽车定型试验规程中强制性标准检测项目目录GB1495-2002汽车加速行驶车外噪声限值及测量方法GB1589-2004道路车辆外廓尺寸、轴荷及质量限值GB4094-1999汽车操纵件、指示器及信号装置的标志GB4599-2007汽车前照灯配光性能GB4660-2007汽车前雾灯配光性能GB4785-2007汽车及挂车外部照明和信号装置的安装规定GB5920-2008汽车及挂车前位灯、后位灯、示廓灯和制动灯配光性能GB7063-1994汽车护轮板GB7258-2004机动车运行安全技术条件GB8410-2006汽车内饰材料的燃烧特性GB9656-2003汽车安全玻璃GB9743-2007轿车轮胎GB9744-2007载重汽车轮胎GB11550-2009汽车座椅头枕性能要求和试验方法GB11552-2009轿车内部凸出物GB11554-2008汽车及挂车后雾灯配光性能GB11555-2009汽车风窗玻璃除霜和除雾系统的性能和试验方法GB11557-1998防止汽车转向机构对驾驶员伤害的规定GB11562-1994汽车驾驶员前方视野要求及测量方法GB11564-2008机动车回复反射器..GB11566-2009轿车外部凸出物汽车和挂车侧面防护要求汽车和挂车后下部防护要求GB12676-1999汽车制动系统结构、性能和试验方法GB13057-2003客车座椅及其车辆固定件的强度GB13094-2007客车结构安全要求GB14023-2006车辆、机动船和由火花点火发动机驱动的装置的无线电骚扰特性的限值和测量方法GB14166-2003机动车成年乘员用安全带和约束系统GB14167-2006汽车安全带安装固定点GB15082-2008汽车用车速表GB15083-2006汽车座椅系统强度要求及试验方法GB15084-2006汽车后视镜的性能和安装要求GB15085-1994汽车风窗玻璃刮水器、洗涤器的性能要求及试验方法GB15086-2006汽车门锁及门铰链的性能要求和试验方法GB15235-2007汽车倒车灯配光性能GB15740-2006汽车防盗装置性能要求GB15741-1995汽车和挂车号牌板(架)及其位置GB15742-2006机动车用喇叭的性能要求及试验方法GB15743-1995轿车侧门强度道路机动车辆灯丝灯泡尺寸、光电性能要求GB16735-2004道路车辆车辆识别代号(VIN)GB16897-1997制动软管GB17354-1998汽车前、后端保护装置GB17509-2008汽车和挂车转向信号灯配光性能GB17675-1999汽车转向系基本要求GB18099-2000汽车及挂车侧标志灯配光性能GB18409-2001汽车驻车灯配光性能GB18655-2002用于保护车载接收机的无线电骚扰特性的限值和测量方法GB18986-2003轻型客车结构安全要求GB19151-2003机动车用三角警告牌。
汽车零部件检测标准大全QC/T641-2005汽车用塑料密封条GB15766.1-2000道路机动车辆灯丝灯泡尺寸、光电性能要求、ECER37、IEC809-1992 GB4599-1994汽车前照灯配光性能ECER1关于批准发射非对称近光和/或远光并装有R2/或HS1类白炽灯的机动车前照的统一规定ECER5关于批准发射对称近光或远光或两者兼有的机动车封闭式前照灯(SB)的统一规定ECER8关于批准发射非对称近光或远光装有卤素灯H1、112、H3、IIB3、HB4、IIB、H7)认可规定ECER20关于批准发身非对称近光或远光或两者兼有装有卤素灯(H4)的机动车前照灯的统一规定ECER31关于批准发射非对称近光或远光或两者兼有的卤素封闭式(HSB)机动车前照灯的统一规定ECER112ECER98关于批准装用气体放电光源的机动车前照灯的统一规定ECER99关于批准用于已通过认证的机动车的气体放电灯具的气体放电光源的统一规定GB4660-1994汽车前雾灯配光性能ECER19前雾灯GB11554-1998汽车及挂车后雾灯配光性能ECER38后雾灯GB15235-1994汽车倒车灯配光性能ECER23、SAEJ5930CT95 GB17509-1998汽车及挂车转向信号灯配光性能ECER6、SAEJ588DEC.94、GB11564-1998>ECER3、76/757/EEC、ECER69、ECER70、ECER104GB18408-2001汽车及挂车后牌照板照明装置配光性能GB5920-1999汽车及挂车前位灯、后位灯、示廓灯和制动配光性能ECER7,SAEJ222DEC.94,*SAEJ586SEP95,SAEJ585DEC.1994、ECER91、ECER4GB18099-2000汽车及挂车侧标志灯配光性能GB18409-2001汽车驻车灯配光性能GB19151-2003机动车用三角警告牌ECER77、CMVDR127、ECER27、GA184-1999 GB4785T998汽车及挂车外部照明和信号装置的安装规定GB/T10485-1989汽车及挂车外部照明和信号装置基本环境试验TS0/DTS12346:1997照明和信号装置基本环境试验**GA406-2002车身反光标识GB15742-2001机动车用喇叭性能要求和试验方法ECER28QC/T30-2004汽车用电喇叭技术条件QC/T413-2002汽车电器设备基本技术条件GB18655-2002用于保护车载接收机的无线电骚扰特性的限值和测量方法扰GB/T19126-2003农用运输车座椅系统强度要求及试验方法GB/T19129-2003农用运输车电喇叭性能要求 及试验方法GB/T19130-2003农用运输车车速表使用性 能GB/T19131-2003农用运输车号牌板(架)及 其位置GB/T19132-2003农用运输车外廓尺寸限值 GB/T19133-2003农用运输车最大侧倾稳定角 试验方法GB/T19134-2003农用运输车后视镜性能和安 装要GB18322-2001农用运输车自由加速烟度限值GB/T5383T994摩托车和轻便摩托车最低稳 定车速试验方法GB/T5384-1994摩托车和轻便摩托车最高车 速试验方法GB/T5385T994摩托车和轻便摩托车加速性 能试验方法GB/T5386-1994摩托车和轻便摩托车滑行试 验方法GB/T5387-1994摩托车和轻便摩托车爬坡能 力试验方法CMVDR640关于摩托车和轻便摩托车最高车速 及发动机最大扭矩和最大净功率的设计规则 GB/T16486-1996摩托车和轻便摩托车燃油 消耗量试验方法GB16169-2005摩托车和轻便摩托车加速行驶噪声限值及测量方法GB4569-2005摩托车和轻便摩托车定置噪声 限值及测试方法ECER41关于就噪声方面批准摩托车的统一规 定ECER63关于就噪声方面批准轻便摩托车的统 一规定78/1015/EEC 摩托车——噪声试验CMVDR463关于轻便摩托噪声的设计规则 CMVDR409关于三轮机动车噪声的设计规则 CMVDR441关于摩托车噪声的设计规则 93/14/EEC 二轮或三轮机动车辆的制动GB17355-1998摩托车和轻便摩托车制动性能性能GB17510-1998摩托车光信号装置配光性能**GB19152-2003轻便摩托车前照灯配光性能**GB/T18384.2-2001电动汽车安全要求第二部分:功能安全和故障防护**GB/T18384.3-2001电动汽车安全要求第三部分:人员触电防护**GB/T19755-2005轻型混合动力电动汽车污染物排放测量**GB/T18488.1-2001电动汽车用电机及其控制器技术条件**GB/T18488.•2-2001电动汽车用电机及其控制器试验方法。
SAE Technical Standards Board Rules provide that: “This report is published by SAE to advance the state of technical and engineering sciences. The use of this report is entirely voluntary, and its applicability and suitability for any particular use, including any patent infringement arising therefrom, is the sole responsibility of the user.”SAE reviews each technical report at least every five years at which time it may be reaffirmed, revised, or cancelled. SAE invites your written comments and suggestions.QUESTIONS REGARDING THIS DOCUMENT: (412) 772-8512 FAX: (412) 776-0243TO PLACE A DOCUMENT ORDER; (412) 776-4970 FAX: (412) 776-0790SAE WEB ADDRESS 2.1.4R ELATED P UBLICATIONS—The following publications are provided for information purposes only and are not arequired part of this document.TAPPI T801-83TAPPI T802-813.Application3.1Environmental Data and Test Method Validity—The information included in the following sections is basedupon test results achieved by major North American truck manufacturers and component equipment suppliers.Operating extremes were measured at test installations normally used by manufacturers to simulate environmental extremes for vehicles and original equipment components. They are offered as a design starting point. Generally, they cannot be used directly as a set of operating specifications because some environmental conditions may change significantly with relatively minor physical location changes. This is particularly true of vibration, engine compartment temperature, and electromagnetic compatibility. Actual measurements should be made as early as practicable to verify these preliminary design baselines.The proposed test methods are currently being used for laboratory simulation or are considered to be a realistic approach to environmental design validation. They are not intended to replace actual operational tests under adverse conditions. The recommended methods describe standard cycles for each type of test. The designer must specify the number of cycles over which the vehicle electronic components should be tested.The number of cycles will vary depending upon equipment, location, and function. While the standard test cycle is representative of an actual short term environmental cycle, no attempt is made to equate this cycle to an acceleration factor for reliability or durability. These considerations are beyond the scope of this document.3.2Organization of Test Methods and Environmental Extremes Information3.2.1The data presented in this document are contained in Sections 4 and 5. Section 4, Environmental Factorsand Test Methods, describes the thirteen characteristics of the expected environment that have an impact on the performance and reliability of truck and bus electronic systems. These descriptions are titled:a.Temperatureb.Humidityc.Salt Spray Atmosphered.Immersion and Splash (Water, Chemicals, and Oils)e.Steam Cleaning and Pressure Washingf.Fungusg.Dust, Sand, and Gravel Bombardmenth.Altitudei.Mechanical Vibrationj.Mechanical Shockk.General Heavy-Duty Truck Electrical Environmentl.Steady State Electrical Characteristicsm.Transient, Noise, and Electrostatic Characteristicsn.Electromagnetic Compatibility/Electromagnetic InterferenceThey are organized to cover three facets of each factor:1.Definition of the factor2.Description of its effect on control, performance, and long-term reliability3. A review of proposed test methods for simulating environmental stress3.2.2I N S ECTION 5a.Underhood1.Engine (Lower Portion)2.Engine (Upper Portion)3.Bulkheadb.Interior (cab)1.Floor2.Instrument Panel3.Head Liner4.Inside Doorsc.Interior (aft of cab)1.Bunk Area2.Storage Compartmentd.Chassis1.Forward2.Reare.Exterior of Cab1.Under Floor2.Rear3.Top4.Doors3.3Combined Environments—The vehicle environment consists of many natural and induced factors.Combinations of these factors are present simultaneously. In some cases, the effect of a combination of these factors is more serious than the effect of exposing samples to each environmental factor in series. For example, the suggested test method for humidity includes high- and low-temperature exposure. This combined environmental test is important to vehicle electronic components when proper operation is dependent on seal integrity. Temperature and vibration is a second combined environmental test method that can be significant to components. During design analysis a careful study should be made to determine the possibility of design susceptibility to a combination of environmental factors that could occur at the planned mounting location. If the possibility of susceptibility exists, a combined environmental test should be considered.3.4Test Sequence—The optimum test sequence is a compromise between two considerations:3.4.1The order in which the environmental exposures will occur in operational use.3.4.2 A sequence that will create a total stress on the sample that is representative of operation stress.The first consideration is impossible to implement in vehicle testing since exposures occur in a random order.The second consideration prompts the test designer to place the most severe environments last. Many sequences that have been successful follow this general philosophy, except that the temperature cycle is placed or performed first in order to condition the sample mechanically.4.Environmental Factors and Test Methods4.1Temperature4.1.1D EFINITION—Thermal factors are probably the most pervasive environmental hazard to vehicle electroniccomponents. Sources for temperature extremes and variations include:4.1.1.1The vehicle's climatic environment, including the diumal and seasonal cycles—Variations in climate bygeographical location must be considered. In the most adverse case, the vehicle that spends the winter in Canada may be driven in the summer in the Arizona desert. T emperature variations due to this source range from −54 to +85 °C (−65 to +185 °F).4.1.1.2Heat sources and sinks generated by the vehicle's operation—The major sources are the engine anddrivetrain components, including the brake system. Wide variations are found during operation. For instance, temperatures on the surface of the engine can range from the cooling system 88 °C (190 °F) to the surface at the exhaust system at 816 °C (1500 °F). This category also includes conduction, convection, and radiation of heat because of the various modes of the vehicle's operation.4.1.1.3Self-heating of the equipment due to its internal dissipation—A design review of the worst casecombination of peak ambient temperature (see 4.1.1.1 and 4.1.1.2), minimized heat flow away from the equipment, and peak-applied steady-state voltage should be conducted.4.1.1.4Vehicle operational mode and actual mounting location—Measurements should be made at the actualmounting site during the following vehicular conditions while they are subjected to the maximum heat generated by adjacent equipment, and while they are at the maximum ambient environment:a.Engine startb.Engine idlec.Engine high speedd.Engine turn off (Prior history important.)e.Various engine/road conditions4.1.1.5Ambient conditions before installation due to storage and transportation extremes—Shipment in unheatedaircraft cargo compartments may lower the minimum storage (nonoperating) temperature to −50 °C (−58°F).The thermal environmental conditions that are a result of these conditions can be divided into three categories:a.Extremes - The ultimate upper and lower temperatures the equipment is expected to experience.b.Cycling - The cumulative effects of temperature cycling within the limits of the extremes.c.Shock - Rapid change of temperature. Figure 1 illustrates one form of vehicle operation that inducesthermal shock and is derived from an actual road test of two vehicles. Thermal shock is also inducedwhen vehicle electronic componentry at elevated temperature is exposed to sudden rain or roadsplash, or when it is moved from a heated shelter into a low (−40 °C/−40 °F) ambient temperatureenvironment.FIGURE 1—TIME INTO RUN-MINUTES VEHICLE WARM-UP CHARACTERISTICS The vehicle electronic component designer is urged to develop a systematic, analytic method for dealing with steady-state and transient thermal analysis. The application of many devices containing semiconductors is temperature limited. For this reason, the potential extreme operating conditions for each application must be scrutinized to avoid failure in the field.4.1.2E FFECT O N P ERFORMANCE—The damaging effects of thermal stock and thermal cycling include:4.1.2.1Cracking of printed circuit board or ceramic substrates.4.1.2.2Thermal stress of fatigue failures of solder joints.4.1.2.3Delamination of printed circuit boards and other interconnect system substrates.4.1.2.4Seal failures, including the breathing action of some assemblies, due to temperature-induced dimensionalvariation that permits intrusion of liquid or vapor borne contaminants.4.1.2.5Failure of circuit components due to direct mechanical stress caused by differential thermal expansion. 4.1.2.6The acceleration of chemical attack on interconnects, due to temperature rise, can result in progressivedegradation of circuit components, printed circuit board conductors, and solder joints.In addition to these phenomena, high temperature extremes can cause a malfunction by:4.1.2.7Exceeding the dissociation temperature of surrounding polymer or other packaging components.4.1.2.8Carbonizing of the packaging materials resulting in the eventual progressive failure of the associatedpassive or active components. This is possible in cases of excessively high temperature. In addition, noncatastrophic failure is possible because of electrical leakage in the resultant carbon paths.4.1.2.9Changing the active device characteristics with increased heat, including changes in gain, impedance,collector-base leakage, peak blocking voltage, collector-base junction second breakdown voltage, etc.4.1.2.10Changing the passive device characteristics, such as permanent or temporary drift in resistor value andcapacitor dielectric constants, with increased temperature.4.1.2.11Changing the interconnect and relay coil performance due to the conductivity temperature coefficient ofcopper.4.1.2.12Changing the properties of magnetic materials with increasing temperature, including Curie point effectsand loss of permanent magnetism.4.1.2.13Changing the dimensions of packages and components leading to the separation of subassemblies.4.1.2.14Changing the strength of soldered joints because of changes in the mechanical characteristics of thesolder.4.1.2.15The severe mechanical stress caused by ice formation in moisture bearing voids or cracks.4.1.2.16The very rapid and extreme internal thermal stress caused by applying maximum power to semiconductoror other components after extended cold soak under aberrant operating conditions such as 36 V battery jumper starts.4.1.3R ECOMMENDED T EST M ETHODS4.1.3.1Temperature Cycle Test—Recommended thermal cycle profiles are shown in Figures 2a, b, and c andrecommended extreme temperatures in T ables 1A and 1B. If temperature characterization has been performed according to 4.1.1.4 the measured temperature may be substituted for the values in Tables 1a and 1b for the purpose of this document. The test method of Figure 2a, a 24 h cycle, offers longer stabilization time and permits a convenient room ambient test period. Figure 2b, an 8 h cycle, provides more temperature cycles for a given test duration. It is applicable only to vehicle electronic components whose temperatures will reach stabilization in a shorter cycle time. Stabilization should be verified by actual measurements; thermocouples, etc. It is important that all parts of the test specimen be held at the specified maximum and minimum temperatures for at least 15 min, after reaching stability at that temperature. This is to maintain thermal or pressure stresses generated in the test specimen for a reasonable period of time. Figure 2c illustrates a test method for thermal shock.FIGURE 2A—24 HOUR THERMAL CYCLEFIGURE 2B—SHORT (8 HOUR) THERMAL CYCLEFIGURE 2C—THERMAL SHOCKTABLE 1A—ENVIRONMENTAL EXTREME SUMMARY HEAVY-DUTY CAB OVER ENGINE TRUCK/TRACTORLocation (1)1.Figure 3 - Pictorial Description of LocationsTemperaturesMinTemperatures OperatingTemperaturesMax (2)2.If temperature characterization has been performed according to 4.1.1.4, the measured temper-ature may be substituted for the values in Tables 1a and 1b for the purpose of this document.ENGINE1a Underhood - Lower −40 °C 56 °C over ambient −40 °F 100 °F over ambient 1b Underhood - Upper (3)3.Exhaust Manifold 816 °C 1500 °F−40 °C 222 °C over ambient −40 °F 400 °F over ambient 1c Underhood Bulkhead−40 °C 56 °C over ambient −40 °F 100 °F over ambientINTERIOR:2a Floor−40 °C 27 °C 66 °C −40 °F 80 °F 150 °F 2b Instrument Panel (4)4.Windshield (Daylight opening on top of instrument panel) Direct sunlight surface temperature 115 °C maximum 240 °F maximum−40 °C 24 °C 85 °C −40 °F 75 °F 185 °F 2c Headliner −40 °C 24 °C 79 °C −40 °F75 °F 175 °F2d Inside Door 3a Bunk Area−40 °C 24 °C 93 °C −40 °F 75 °F 200 °F 3b Storage Compartment−40 °C 24 °C 74 °C −40 °F 75 °F165 °F CHASSIS:4a Forward −40 °C 120 °C −40 °F 248 °F 4b Rear−40 °C 95 °C −40 °F 203 °FEXTERIOR:5a Under No Data 5b Back No Data 5c Door −40 °C 56 °C over ambient −40 °F 100 °F over ambient5d TopNo DataMaximum ambient temperature may reach 85 °C (185 °F)TABLE 1B—ENVIRONMENTAL EXTREME SUMMARY HEAVY-DUTYCONVENTIONAL ENGINE TRUCK/TRACTORLocation (1)1.Figure 3 - Pictorial Description of LocationsTemperaturesMinTemperatures OperatingTemperaturesMax (2)2.If temperature characterization has been performed according to 4.1.1.4, the measured temper-ature may be substituted for the values in Tables 1a and 1b for the purpose of this document.ENGINE1a Underhood - Lower −40 °C56 °C over ambient −40 °F100 °F over ambient 1b Underhood - Upper (3)3.Exhaust Manifold 816 °C 1500 °F−40 °C222 °C over ambient −40 °F400 °F over ambient 1c Underhood Bulkhead−40 °C56 °C over ambient −40 °F100 °F over ambientINTERIOR:2a Floor−40 °C 27 °C 75 °C −40 °F 80 °F 165 °F 2b Instrument Panel (4)4.Windshield (Daylight opening on top of instrument panel) Direct sunlight surface temperature 115 °C maximum 240 °F maximum−40 °C 24 °C 85 °C −40 °F 75 °F 185 °F 2c Headliner −40 °C 24 °C 79 °C −40 °F75 °F 175 °F2d Inside Door 3a Bunk Area−40 °C 24 °C 93 °C −40 °F 75 °F 200 °F 3b Storage Compartment−40 °C 24 °C 74 °C −40 °F 75 °F165 °F CHASSIS:4a Forward −40 °C 121 °C −40 °F 250 °F 4b Rear−40 °C 93 °C −40 °F 200 °FEXTERIOR:5a Under No Data 5b Back No Data 5c Door −40 °C 56 °C over ambient −40 °F 100 °F over ambient5d TopNo DataMaximum ambient temperature may reach 85 °C (185 °F)FIGURE 3—VEHICLE ENVIRONMENTAL ZONESSeparate or single test chambers may be used to generate the temperature environment described by the thermal cycles. By means of circulation, the air temperature should be held to within ±3 °C (±5 °F) at each of the extreme temperatures. The test specimens should be placed in a position, with respect to the airstream, where there is substantially no obstruction to the flow of air across the specimen. If two test specimens are used, care must be exercised to assure that the test samples are not subject to temperature transition rates greater than that defined in Figures 2a and 2b. Direct heat conduction from the temperature chamber heating element to the specimen should be minimized.NOTE—Airflow is a function of actual equipment location. Simulation of actual airflow and thermal transfer operation conditions should be considered in test design.Electrical performance should be measured under the expected operational minimum and maximum extremes of excitation, input and output voltage, and load at both the cold and hot temperature extremes.These measurements provide insight into electrical variations with temperature.4.1.3.2Thermal Shock Test—Thermal shock that can be expected in the vehicle environment is simulated by themaximum rates of change shown on the recommended thermal cycle profile portrayed in Figure 2c. The thermal shock test should begin with a 2 h presoak (−40 °C/−40 °F). The test item should be transferred to the hot chamber (85 °C/185 °F) where it should remain for 2 h, then transferred to the cold chamber (−40 °C/−40 °F) for 2 h. This cycle should be repeated at least five times. Each transfer should be accomplished in1 min or less.4.1.3.3Thermal Stress—Thermal stress is caused by repeat cycling through the thermal profiles of Figures 2a, b,and c. Many failures are due to fatigue. Slow cycles not repeated often will not demonstrate this. The number of cycles is a function of the vehicle electronic component application. Functional electrical testing during temperature transitions or immediately after temperature transitions, is a means of detecting poor electrical connections. The effect of thermal stress is similar to thermal shock but is caused by fatigue.NOTE—Although uniform oven temperatures are desirable, the only means of heat removal in some vehicle environments may be by special heat sinks or by free convection to surrounding air. Itmay be necessary to use conductive heat sinks with independent temperature controls in theformer case and baffles or slow speed air stirring devices in the latter to simulate such conditionsin the laboratory (see Section 3).4.1.4R ELATED S PECIFICATIONS—A generally accepted method for small part testing is defined in MIL-STD-202F,Method 107F, Thermal Shock, Method A or B, alternately MIL-STD-810D, Method 503.2. The short dwell periods at high temperature are satisfactory where temperature stabilization is verified by actual measurements.4.2Humidity4.2.1D EFINITIONS—(Contained in 4.2.2)4.2.2E FFECTS O N P ERFORMANCE—Both primary and secondary humidity sources exist in the vehicle. In additionto the primary source externally applied ambient humidity, the cyclic thermal-mechanical stresses caused by operational heat sources introduce a variable vapor pressure on the seals. Temperature gradients set up by these cycles can cause the dew point to travel from locations inside the equipment to the outside and back, resulting in additional stress on the seals.The actual relative humidity in the vehicle depends on factors such as operational heat sources, trapped vapors, air-conditioning, and cool-down effects. Recorded data indicates an extreme condition of 98% relative humidity at 38 °C (100 °F).Primary failure modes include corrosion of metal parts because of galvanic and electrolytic action, as well as corrosion caused by interaction with contaminated water and oxygen. Other failure modes include changes in electrical properties, surface bridging corrosion products and condensation between circuits, decomposition of organic matter because of attacking organisms (for example, mildew), and swelling of elastomers.4.2.3R ECOMMENDED T EST M ETHODS—The most common way to determine the effect of humidity on vehicleelectronic components is to over test and examine any failure for relevance to the more moderate actual operating conditions. The most common test is an 8 h active temperature humidity cycling under accelerated conditions (Figure 4a). A second test is an 8 to 24 h exposure at 103.4 kPa gage pressure (15 lbf/in2 gage) in a pressure vessel (Figure 4b). This is a quick and effective method for uncovering defects in plastic encapsulated semiconductors.FIGURE 4—RECOMMENDED HUMIDITY CYCLESAn optional frost condition may be incorporated during one of these humidity cycles. Electrical performance should be continuously monitored during these frost cycles to note erratic operation. Heat-producing and moving parts may require altering the frost condition portions of the cycle to allow a period of nonoperation induced frosting.4.2.4R ELATED S PECIFICATIONS—Many related humidity specifications are recommended for review and reference.The first: MIL-STD-810D, Method 507.2, Procedures I through III, Humidity, is a system-oriented test method. The second, a modified version of MIL-STD-202F, Method 103B, Humidity (Steady State), is intended to evaluate materials. The third, MIL-STD-202F, Method 106E, Moisture Resistance, is a procedure for testing small parts.4.3Salt Spray Atmosphere4.3.1D EFINITION—(Contained in 4.3.2)4.3.2E FFECT O N P ERFORMANCE—Vehicle electronic components mounted on the chassis, exterior, and underhoodare often exposed to a salt spray environment. In coastal regions, the salt is derived from sea breezes, and in colder climates, from road salt. Although salt spray is generally not found in the interior of the vehicle, it is advisable to evaluate the floor area for potential effects of saline solutions that were transferred from the outside environment by vehicle operators, passengers, and transported equipment.Failure modes due to salt spray are generally the same as those associated with water and water vapor.However, corrosion effects and alteration of conductivity are accelerated by the presence of saline solutions and adverse changes in pH.4.3.3R ECOMMENDED T EST M ETHODS—The recommended test method for measuring susceptibility of vehicleelectronic component to salt spray is the American Society for Testing and Materials (ASTM) Standard Method of Salt Spray (Fog) Testing Number B 117-73. Similar test methods are found in MIL-STD-202, Method 101D, and MIL-STD-810D, Method 509.2.The test consists of exposing the vehicle electronic component to a solution of five parts salt to 95 parts water, atomized at a temperature of 35 °C (95 °F). The component being tested should be exposed to the salt spray for a period of 24 to 96 h. The actual exposure time must be determined by analysis of the specific mounting location. When the tests are concluded, the test specimens should be gently rinsed in clean running water, about 38 °C (100 °F), to remove salt deposits from the surface, and then immediately dried.Drying should be done with a stream of clean, compressed dry air at about 175.8 to 241.3 kPa gage pressure (35 to 40 lbf/in2 gage). The vehicle electronic component should be tested under nominal conditions of voltage and load throughout the test.NOTE—The Pascal (Pa) is the designated SI (metric) unit for pressure and stress. It is equivalent to 1 N/m2.Where leakage resistance values are critical, appropriate measurements under wet and dry conditions may be necessary.4.3.4R ELATED S PECIFICATIONS—ASTM B 117-73 is the recommended test method.4.4Immersion and Splash (Water, Chemicals, and Oils)4.4.1D EFINITION—Vehicle electronic component mounted on or in the vehicle are exposed to varying amounts ofwater, chemicals, and oil. A list of potential environmental chemicals and oils includes:Engine Oils and AdditivesTransmission OilRear Axle OilPower Steering FluidBrake FluidAxle GreaseWasher SolventGasolineDiesel FuelFuel AdditivesAlcoholAnti-Freeze Water MixtureDegreasersSoap and DetergentsSteamBattery AcidWater and SnowSalt WaterWaxesKeroseneFreonSpray PaintPaint StrippersEtherDust Control Agents (magnesium chloride)Moisture Control Agents (calcium chloride)Vinyl PlasticizersUndercoating MaterialMuriatic AcidAmmoniaThe modified chemical characteristics of these materials when degraded or contaminated should also be considered.4.4.2E FFECT O N P ERFORMANCE—Loss of the integrity of the container can result in corrosion or contamination ofvulnerable internal components. The chemical compatibility can be determined by laboratory chemical analysis. Devices such as sensors, that may be immersed in fluids for a long period, should be subjected to laboratory life tests in these fluids.4.4.3R ECOMMENDED T EST M ETHODS—The vehicle electronic component designer should first determine whetherthe parts must withstand complete immersion or splash, and which fluids are likely to be present in the application. Immersion and splash tests are generally performed following other environmental tests because this sequence tends to aggravate incipient defects in seals, seams, and bushings that might otherwise escape notice.Splash testing should be performed with the equipment mounted in a normal operating position with any drain holes open. Any integral parts, such as electrical connectors, shall be in place. Areas of the equipment not subject to splash testing may be sealed or otherwise isolated. The test apparatus should be designed to provide 100% coverage of the test surface using 80 degrees flat fan nozzles located 20 to 25 cm(10 to 12 in) from the test surface. The apparatus should provide a source pressure of approximately200kPa gauge (29 psig) with a flow rate of 2650 cm3/min (0.7 gal/min). The equipment should be exposed to the spray for 5 min of a 10 min period for a total of two cycles.During immersion testing, utilizing water as the fluid, the component ordinarily is not operated due to setup logistics and techniques of this test. In this test, the vehicle electronic component in its normal exterior package is immersed in tap water at about 18 °C (65 °F). The test sample should be completely covered by the water. The sample is first positioned in its normal mounting orientation. It remains in this position for 5min and then rotated 180 degrees. It should remain in this position for 5 min and then rotated 90 degrees about the other axis where it remains for 5 min. Immediately after removal, the sample should be exposed toa temperature below freezing until the entire mass is below freezing. The sample is then returned to roomtemperature, air dried, functionally tested, and inspected for damage.More severe tests such as combined temperature, pressure, and continuous fluid contact must be considered for equipment subjected to extreme environments; for example, exposure to coolant water, brake fluid, and transmission oil. Caution must be used in specifying combined tests because they may be unrealistically severe for many applications.4.4.4R ELATED S PECIFICATIONS—None4.5Steam Cleaning and Pressure Washing4.5.1D EFINITION—(Contained in 4.5.2)4.5.2E FFECTS O N P ERFORMANCE—The intense heat from cleaning sprays and the caustic nature of chemicalagents used in washing solutions create a severe environment for devices and associated wiring and connectors mounted in the engine, chassis, and exterior areas. This exposure can cause a degradation of insulation and seals as well as cracking of vinyl connectors and component packaging. High pressure wash-down may produce results similar to salt spray in many truck interior.4.5.3R ECOMMENDED T EST M ETHOD—The electronic component under test shall be mounted in its normaloperating position with drain holes, if used, open. If an integral connector is used, it shall be mated. The test apparatus should be designed to provide 100% coverage of the exposed surface of the electronic component using flat fan spray nozzles located 20 to 30 cm (7.9 to 11.8 in) away. This apparatus should provide a source pressure of approximately 1400 kPa gage (203 lbf/in2 gage) with a flow rate of 9460 cm3/min (150gal/h). For the steam cleaning, the water temperature should be at 93 °C (200 °F). The test item should be exposed to the spray for 3 s of a 6 s period for a total of 375 cycles.A sample test device is illustrated in Figure 5.。