基于TCS230传感器的高精度颜色识别系统设计_潘海鸿
- 格式:pdf
- 大小:271.79 KB
- 文档页数:3


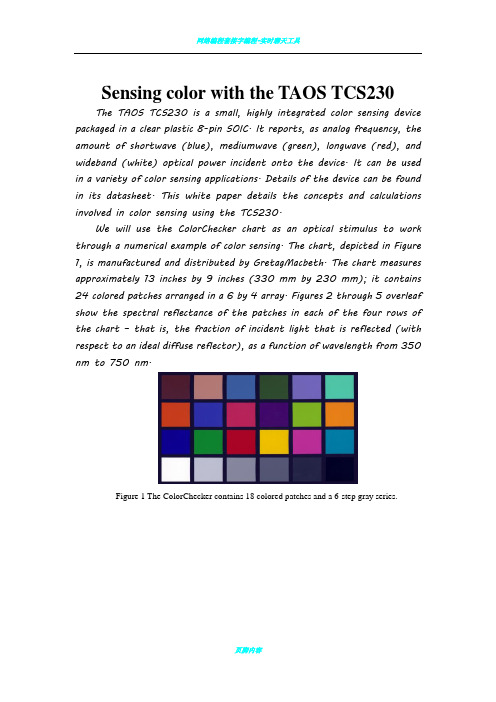
Sensing color with the TAOS TCS230The TAOS TCS230 is a small, highly integrated color sensing device packaged in a clear plastic 8-pin SOIC. It reports, as analog frequency, the amount of shortwave (blue), mediumwave (green), longwave (red), and wideband (white) optical power incident onto the device. It can be used in a variety of color sensing applications. Details of the device can be found in its datasheet. This white paper details the concepts and calculations involved in color sensing using the TCS230.We will use the ColorChecker chart as an optical stimulus to work through a numerical example of color sensing. The chart, depicted in Figure 1, is manufactured and distributed by GretagMacbeth. The chart measures approximately 13 inches by 9 inches (330 mm by 230 mm); it contains 24 colored patches arranged in a 6 by 4 array. Figures 2 through 5 overleaf show the spectral reflectance of the patches in each of the four rows of the chart – that is, the fraction of incident light that is reflected (with respect to an ideal diffuse reflector), as a function of wavelength from 350 nm to 750 nm.Figure 1 The ColorChecker contains 18 colored patches and a 6-step gray series.Figure 2 ColorChecker spectra, top row.Figure 3 ColorChecker spectra, second row.Figure 4 ColorChecker spectra, third row.Figure 5 ColorChecker spectra, bottom row (neutral series)Figure 6 Cone sensitivities of cone photoreceptors are shown. The shortwave-sensitive photoreceptors are much less sensitive than the other two types. The responses of the mediumwave and longwave photoreceptors have a great deal of overlap. Vision is not sensitive to the precise wavelength of the stimulus: What atters is optical power integrated under each response curve.Introduction to color visionPhotoreceptor cells called cones in the retina are responsible for human color vision. There are three types of cone cells, sensitive to longwave, mediumwave, and shortwave radiation within the electro-magnetic spectrum between about 400 nm and 700 nm. Because the cone sensitivities are very roughly in the parts of the spectrum that appear red, green, and blue, color scientists denote the cell types as ρ,γ, and, the Greek letters for r, g, and b. (To denote the sensors R, G, and B would wrongly suggest a closer correspondence.) Estimates of the spectral response of the cone types are graphed in Figure 6 above.Light in the physical world can be characterized by spectral power distributions (SPDs). Colored objects can be characterized by spectral reflectance curves, such as those of the ColorChecker. However, vision is insensitive to the exact wavelength of a stimulus: According to the modern theory of color science, all that matters is the integral of optical power underneath each response curve. That there are exactly three types of cone cells leads to the property of trichromaticity: Three components are necessary and sufficient to characterize color. Some people might use the phrase “color as sensed by the eye,” but I con-sider that qualifier to be redundant at best, and misleading at worst: Color is defined by vision, so there is no need to use the qualifying phrase “as sensed by the eye,” or to use the adjective visible when referring to color.Overview of CIE ColorimetryThe spectral responses of the cone cells that I graphed in Figure 6 were unavailable to researchers in the 1920s. Researchers at the time used psychophysical experiments, such as the famous color matching experiment, to tease out the data. The CIE is the international body responsible for color standards. In1931, that organization adopted the color matching functions denoted x (λ), y (λ), and z (λ), graphed in Figure 7.Figure 7 CIE 1931, 2° color-matching functions. A camera with 3 sensors must have these spectral response curves, or linear combinations of them, in order to capture all colors. However, practical considerations make this difficult. These analysis functions are not comparable to spectral power distributions!Weighting a physical SPD under each of these three curves (that is, forming the wavelength-by-wavelength product), and summing the results, forms a triple of three numbers, denoted X, Y, and Z. In continuous mathematics, three integrals need to be computed; in discrete math, a matrix product is sufficient. The X, Y, and Z tristim-ulus values characterize color. They are linear-light quantities, propor-tional to optical power, that incorporate the wavelength sensitivity of human vision. The Y value is luminance, which is ordinarily expressed in units of candela per meter squared (cd·m-2). If you are measuring reflectance, the reflected tristimulus values depend upon the spectral characteristics of the illuminant, and their amplitudes scale with the power of the illumination. Relative luminance is the ratio of reflected luminance to the luminance of the illumination; it is also known as the luminance factor.Figure 8 SPDs of various illuminants are graphed here. Illuminant A, shown in orange, is representative of tungsten light sources; it is deficient in shortwave power, and may cause errors in sensing blue colors. The blue line graphs the SPD of a Nichia white LED. There is a peak in the blue portion of the spectrum: Uncorrected, the sensor would report excessive blue values. The other four lines represent CIE standard illuminants C, D50, D55, and D65.In many applications, tristimulus signals (including luminance) scale with the illumination, and are otherwise uninteresting in themselves. What is more interesting is the ratios among them, which characterize color disregarding luminance. The CIE has standardized the projective transformation of Equation 1, in the margin, to transform [X, Y, Z] values into a pair of [x, y] chromaticity coordinates that represent color disregarding luminance. These coordinates are suitable for plotting in two dimensions on a chromaticity diagram.Eq 1 Chromaticity coordinatesIlluminationA nonemissive object must be illuminated in order to be visible. The SPD reflected from an illuminated object is the wavelength-by-wave-length product of the illuminant’s SPD and the spectral reflectance of the object. Before light reaches the eye, the interaction among light sources andmaterials takes place in the spectral domain, not in the domain of trichromaticity. To accurately model these interactions requires spectral computations. When applying the TCS230, attention must be paid to the spectral content of the illumination and to poten-tial interaction between the illumination and the samples to be sensed. Generally, the less spiky the spectra, the better. Figure 8 graphs several illuminants.Your application may involve sensing color, in which case the preceding description applies. However, some applications of the TCS230 involve not so much estimating color as seen by the eye but rather sensing physical parameters associated with optical power in the visible range. In such applications, to approximate the visual response may not be the best approach: It may be more effective to take a more direct approach to estimating the parameters of the underlying physical process.The Color CheckerEquipped with knowledge of how spectra are related to colors, the plotting of chromaticity coordinates, and the dependence of colors upon illumination, we can return to the ColorChecker. GretagMac-beth doesn’t publish or guarantee the spectral composition of the patches of the ColorChecker. However, nominal CIE [X, Y, Z] values are published. The patches in the bottom row of the ColorChecker contain neutral colors; the numeric notations in the legends of Figure 5 reflect one tenth of the lightness (L*) values of those patches.The spectra graphed on pages 2 and 3 represent the physical wave-length-by-wavelength reflectance of the patches. These spectral reflec-tances have been measured by color measurement instrument called a spectrophotometer. If you had access to a light source having perfectly even distribution of power across the visible spectrum, then the reflectance curves graphed here could simply be scaled to repre-sent the reflectance in your application. Practical light sources do not have perfectly even spectral distributions, so compensation is neces-sary: You must compute the wavelength-by-wavelength product of the illuminant’s SPD with the spectral reflectance of the chart.We will first calculate the CIE [X, Y, Z] values from the chart. (These values should agree with the figures provided by Gretag.) Then we willcalculate the [R, G, B] values that will be detected by a TCS230.To calculate CIE [X, Y, Z], we take the 31×3 matrix representing the color matching functions (CMFs) of the CIE Standard Observer, and perform a matrix product with 31 spectral response values as corrected for illumination. This produces the [X, Y, Z] tristimulus values. When chromaticity coordinates [x, y] are computed from [X, Y, Z] through the projective transform in Equation 1, then plotted, the chromaticity diagram in Figure 9 results. The horseshoe-shaped figure, closed at the bottom, contains all colors: Every non-negative spectral distribution produces an [x, y] pair that plots within this region. The lightly-shaded triangle shows the region containing all colors that can be produced by an additive RGB system using sRGB (Rec. 709) primary colors. This region typifies video and desktop computing (sRGB). The points plotted in Figure 9 are the colors of the ColorChecker. White and gray values are clustered near the center of the chart.Figure 9 Coordinates of ColorChecker patches are graphed on the CIE [x, y] chromaticity diagram. The horseshoe encloses all colors; the triangle encloses the colors that can be represented in video (Rec. 709) and in desktop computing (sRGB). The TCS230Figure 10 shows the responses of the four channels of the TCS230. The black curve shows the response of the unfiltered sensor elements. Thered, green, and blue curves show the responses of the longwave-sensitive, mediumwave-sensitive, and shortwave-sensitive elements respectively.As I mentioned on page 5, the CIE model of color vision involves inte-grating an SPD under the X(λ), Y(λ), and Z(λ) color matching func-tions (graphed in Figure 7), producing X, Y, and Z values. To use the TCS230 to estimate color we perform an analogous calculation, but using the TCS230 sensitivity functions instead of the CIE CMFs: We integrate the SPD under the TCS230’s sensitivity curves, and produce R, G, and B values. The device R, G, and B values will depend upon several factors: the spectral content of the illuminant, the spectral reflectance of the sample, the spectral attenuation of any intervening optical components (such as the lens), and finally, the spectral response functions of the TCS230. The various spectral phenomena are modelled by computing wavelength-by-wavelength products.Figure 10 TCS230 spectral sensitivities are graphed here. The red, green, and blue channels are graphed in the corresponding colors; the gray line reflects the sensitivity of the clear (unfiltered) channel. Because these responses are different from the CIE standard observer, the values reported by the TCS230 are not colorimetric. However, suitable signal processing yields color information that is sufficiently accurate for many industrial applications.Owing to the fact that the TCS230 is sensitive to infrared light (having wavelengths above 700 nm), and the fact that most light sources produce power in the infrared region, typical applications include an IR cutfilter in front of the TCS230. Figure 11 overleaf shows the response of a typical IR cut filter.To form a more accurate estimate of color requires processing the raw TCS230 R, G, and B values through a linear 3×3 matrix whose coeffi-cients are optimized with respect to the spectrum of the illuminant, the spectral response of intervening optical components, and the response curves of the TCS230. The data processing operation can be represented in matrix form as follows:x=M•tEq 2The symbol t represents a three-element vector containing the device values captured from a color patch. M represents the 3×3 color correction matrix that we will apply to these values through matrix multiplication, denoted by the • symbol. The symbol x represents the resulting vector of estimated [X, Y, Z] values.We can use matrix notation to symbolize processing a set of three color patches at once, by arranging the three sets of device values into successive columns of a 3×3 matrix T. Successive rows of T contain red, green, and blue data respectively. Upon matrix multiplication by M, the columns of the resulting matrix X contain XYZ values of the successive samples; the rows of X contain X, Y, and Z values respec-tively. One equation expresses the mapping of three patches at once:X=M•T Eq 3Given a matrix T whose columns contain three sets of device samples, and a matrix X containing the corresponding set of three ideal XYZ triples, there is a unique matrix M that maps from T to X. It is found by computing the matrix inverse of T, then computing the matrix product (by premultiplication) with X:M=X •Eq 4The resulting 3×3 color correction matrix M exactly maps the each of the chosen three sets of device values to the corresponding set of tris-timulus values. It is not necessary to invert matrices at the time ofsensing! The matrix M can be computed in advance, based upon the samples that are expected to be presented to the sensor in the intended application. To process three device values upon sensing a sample, all that is necessary is computation of the matrix product of Equation 3.A color correction matrix that produces good results across more than three samples can be computed through a numerical optimization procedure. When this is done, no particular sample is likely to map exactly to its ideal tristimulus set, but a linear matrix can be constructed that minimizes the error across a range of samples (where the error is measured in a least-squares sense). The color correction operation is still accomplished exactly as in Equation 2.基于TAOS公司的TCS230的颜色感应TAOS公司的TCS230是一个小的、高度集成、8引脚、SOIC封装的色彩传感装置。

一.课设概要:1.利用TCS230D颜色传感器进行颜色检测2.利用单片机(STC52)进行控制3.利用1602液晶显示出RGB值(10进制和16进制)二.课设原理:1.TCS230D(1)参数:1)电源范围2.7V~5.5V2)出错率0.2%每50KHz3)采用soic封装(用DXP进行PCB设计时用到)(2)颜色检测的原理:基本原理:不同的颜色经白光照射后,反射回的光中,RGB的值是不同的。
由三原色感应原理可知, 如果知道构成各种颜色的三原色的值, 就能够知道所测试物体的颜色。
对于TCS230来说, 当选定一个颜色滤波器时, 它只允许某种特定的原色通过, 阻止其他原色的通过。
例如: 当选择红色滤波器时, 入射光中只有红色可以通过, 蓝色和绿色都被阻止, 这样就可以得到红色光的光强; 同理, 选择其他的滤波器, 就可以得到蓝色光和绿色光的光强。
通过这三个值, 就可以分析投射到TCS230 传感器上的光的颜色。
TCS230 的输出信号是数字量, 可以驱动标准的T T L 或CMOS 逻辑输入, 因此可直接与微处理器或其他逻辑电路相连接。
TCS230 采用8 引脚的SOIC 表面贴装式封装, 在单一芯片上集成有64 个光电二极管。
这些二极管共分为四种类型。
其中16 个光电二极管带有红色滤波器; 16 个光电二极管带有绿色滤波器; 16 个光电二极管带有蓝色滤波器; 其余16 个不带有任何滤波器, 可以透过全部的光信息。
这些光电二极管在芯片内是交叉排列的, 能够最大限度地减少入射光辐射的不均匀性, 从而增加颜色识别的精确度; 另一方面, 相同颜色的16 个光电二极管是并联连接的, 均匀分布在二极管阵列中, 可以消除颜色的位置误差。
工作时,通过两个可编程的引脚来动态选择所需要的滤波器。
该传感器的典型输出频率范围从2 H z~500 kH z, 用户还可以通过两个可编程引脚来选择100%、20%或2%的输出比例因子, 或电源关断模式。
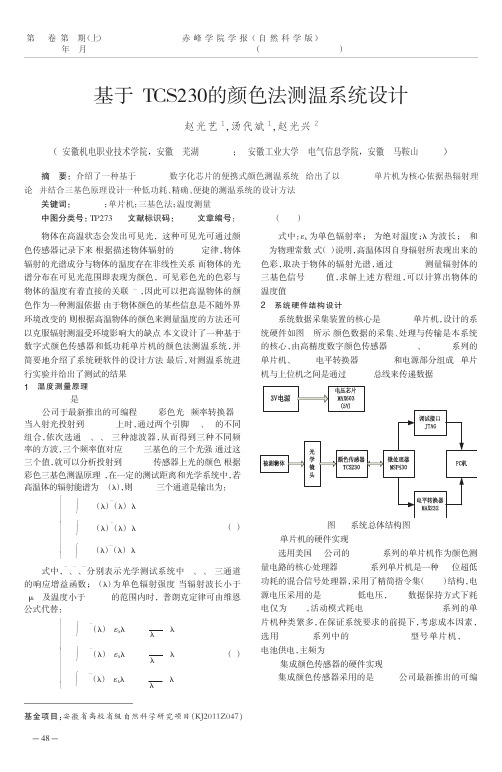
基于ZigBee和TCS230的无线颜色检测系统设计唐燕妮【摘要】针对彩色面阵CCD摄像机采集颜色值数据量大、成本高的不足,设计了一种基于ZigBee和TCS230的无线颜色检测系统.系统选用了无线SoC集成芯片CC2530及TI2007版ZigBee协议栈搭建网络,颜色检测节点利用CC2530片上微控制器与TCS230颜色传感器直连,配合简单的光源照明电路,可实现多个目标RGB 颜色值的准确检测和低速率传输.实验显示,网络数据传输准确率>99.07%,单个节点颜色检测速度<1.0s,RGB值准确度高.系统实现了低成本、高精度、分布便捷、通信稳定的无线颜色检测.【期刊名称】《制造业自动化》【年(卷),期】2015(037)021【总页数】4页(P121-124)【关键词】ZigBee;片上系统;TCS2300;RGB颜色检测【作者】唐燕妮【作者单位】河源职业技术学院,河源 517000【正文语种】中文【中图分类】TP3930 引言颜色检测技术在工业自动化领域的应用非常广泛,其中较为典型的应用有:回收塑料瓶的自动颜色分选[1];蔬菜的识别和分类[2];水果在线检测和质量控制[3]等等。
此类颜色检测是基于图像处理技术,通过对被测物图像的测定和还原来达到颜色识别的目的。
该法通常采用彩色面阵CCD摄像机采集目标图像,把图像像素的RGB 分值作为识别依据,系统集成度高,处理数据量大,成本较高,价格较贵,很大程度限制了检测的便捷性和低成本应用[4]。
工业现场中需要对某一个不规则外形的工件进行多个位置的颜色检测,用以判别该工件颜色值及均匀度等,则上述检测方法存在其局限性。
本文针对上述颜色检测系统的应用不足,设计了一个基于ZigBee网络和新型高分辨率TCS230颜色传感技术的无线检测系统,可实现低成本、分布式、低数据量、高检测精度的颜色检测。
1 系统总体设计无线颜色检测系统由ZigBee无线网络、TCS230颜色检测节点和上位机控制中心等构成,系统结构如图1所示。
基于TCS230颜色传感器的色彩识别器的设计2编辑整理:尊敬的读者朋友们:这里是精品文档编辑中心,本文档内容是由我和我的同事精心编辑整理后发布的,发布之前我们对文中内容进行仔细校对,但是难免会有疏漏的地方,但是任然希望(基于TCS230颜色传感器的色彩识别器的设计2)的内容能够给您的工作和学习带来便利。
同时也真诚的希望收到您的建议和反馈,这将是我们进步的源泉,前进的动力。
本文可编辑可修改,如果觉得对您有帮助请收藏以便随时查阅,最后祝您生活愉快业绩进步,以下为基于TCS230颜色传感器的色彩识别器的设计2的全部内容。
2 颜色识别及颜色传感器技术介绍2.1 色彩识别正如我们所知道的那样,色彩实际上是频率连续的电磁波,理论上色彩是无限的,但是人们能分辨的色彩是有限的,而且存在着个体差异。
专业人士在设计一个色彩识别系统的时候,会很仔细地以5%甚至更小的区别来仔细调整色彩之间的比值。
当这些类似色并排在一起时,即使是没有经过训练的普通人,除了色盲意外,都能够看出它们之间的区别。
但是当一个色彩识别系统被确定并且单独展现时,普通人是无法区别出这5%什么更大的差异的。
因此大多数人会简单的将他们所看到的某个色彩归类到他们能用简单语言描述的一类颜色,比如红、黄、白,或在这个基础上加以设当的区分,比如橘黄,有点发白的橘黄等。
这种普通人感知的色彩可以被看作围绕着一个核心色的一个一个的区间,在这个区间中的所有颜色在色彩识别的时候,都会被看作是一种色彩。
初中同一色彩识别区间的所有色彩尽管值不一样,但是对于受众而言是一样的。
2.2 色彩识别算法2.2。
1色彩识别的应用在现今的工业化社会中,色彩识别被广泛的应用于各行各业之中,如:各种物体表面颜色识别(产品包装色标检测,产品外表特征颜色的检测,液体溶液颜色变化过程的检测与控制,等等)。
又如:图书馆使用颜色区分对文献进行分类,能够极大的提高排架管理和统计等工作;在包装行业,产品包装利用不同的颜色或装磺来表示其不同的性质或用途;在品牌的形象设计和品牌推广的竞争中,色彩系统是一个比较重要的部分,设计师都会花费大量的时间细致地调整不同色彩搭配之间的组合关系,以达到更好的视觉效果。
基于TCS230便携式颜色测量系统设计季峰【期刊名称】《电子质量》【年(卷),期】2015(0)10【摘要】介绍了TCS230可编程颜色测量芯片的工作原理。
基于TCS230的工作原理,以89c51单片机为控制单元,设计出便携式颜色测量系统。
系统采用24c02存储器存放TCS230的白平衡调整因子,避免了每次开机时的白平衡调试,颜色测量结果通过LCD1602显示。
所设计的系统具有使用元器件少、体积小、成本低等优点。
%The working principle of TCS230 programmable color measuring chip is introduced.Based on the working principle,a design of portable color measurement system is proposed by using 89c51 single-chip mi-crocomputer as control unit.The system uses the 24c02 memory to store the white balance adjustment factor of TCS230,which avoids the white balance adjustment when the system starts every time.And the measured results are displayed by LCD1602.The designed system has the advantages of less components,smal size and low cost.【总页数】3页(P68-70)【作者】季峰【作者单位】武汉职业技术学院电子信息工程学院,湖北武汉430074【正文语种】中文【中图分类】TP274【相关文献】1.基于TCS230芯片颜色测量系统的研究 [J], 杨杰;谢元媛2.基于TCS230的便携式数字化调色仪的系统设计 [J], 刘双喜;丁筱玲3.基于TCS230与LabVIEW的颜色测量系统 [J], 李爱勤;张绪坤4.基于TCS230传感器的颜色识别系统设计 [J], 李静;梁鹏超5.基于51单片机控制TCS230传感器分拣物体系统设计 [J], 程琦因版权原因,仅展示原文概要,查看原文内容请购买。