LABVIEW第6章字符串数组簇和矩阵
- 格式:ppt
- 大小:900.00 KB
- 文档页数:33

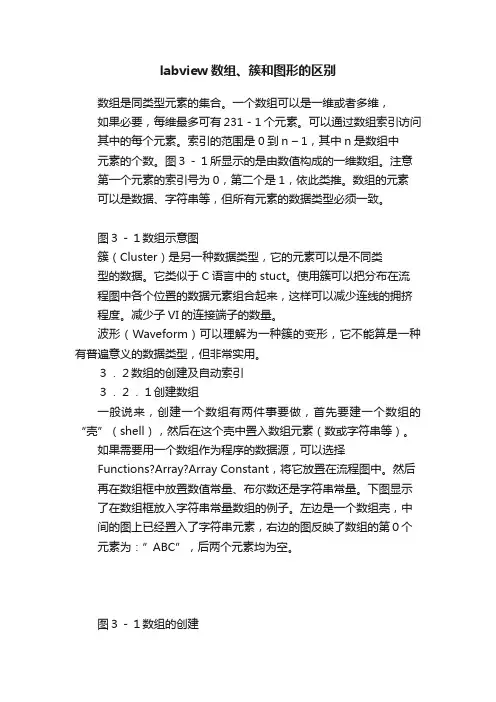
labview数组、簇和图形的区别数组是同类型元素的集合。
一个数组可以是一维或者多维,如果必要,每维最多可有231-1个元素。
可以通过数组索引访问其中的每个元素。
索引的范围是0到n – 1,其中n是数组中元素的个数。
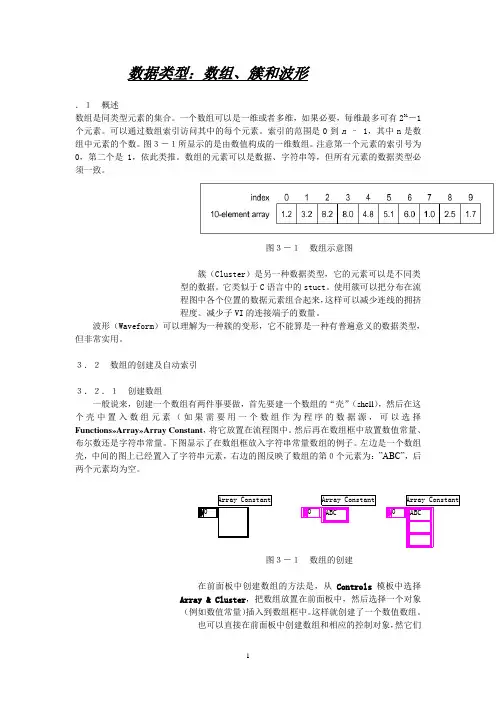
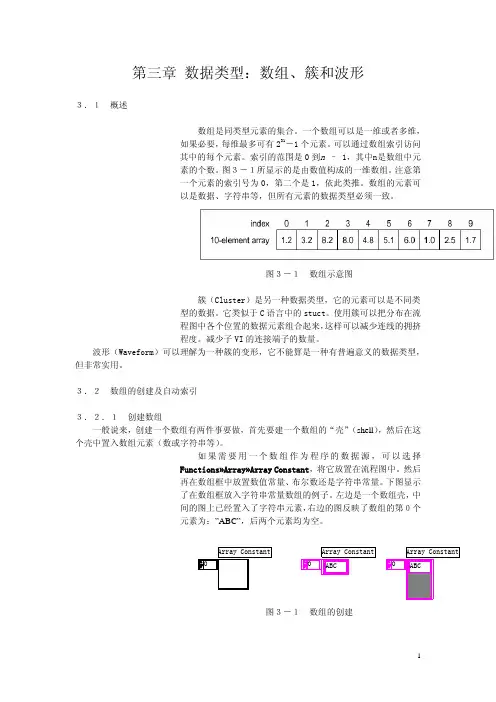
图3-1所显示的是由数值构成的一维数组。
注意第一个元素的索引号为0,第二个是1,依此类推。
数组的元素可以是数据、字符串等,但所有元素的数据类型必须一致。
图3-1数组示意图簇(Cluster)是另一种数据类型,它的元素可以是不同类型的数据。
它类似于C语言中的stuct。
使用簇可以把分布在流程图中各个位置的数据元素组合起来,这样可以减少连线的拥挤程度。
减少子VI的连接端子的数量。
波形(Waveform)可以理解为一种簇的变形,它不能算是一种有普遍意义的数据类型,但非常实用。
3.2数组的创建及自动索引3.2.1创建数组一般说来,创建一个数组有两件事要做,首先要建一个数组的“壳”(shell),然后在这个壳中置入数组元素(数或字符串等)。
如果需要用一个数组作为程序的数据源,可以选择Functions?Array?Array Constant,将它放置在流程图中。
然后再在数组框中放置数值常量、布尔数还是字符串常量。
下图显示了在数组框放入字符串常量数组的例子。
左边是一个数组壳,中间的图上已经置入了字符串元素,右边的图反映了数组的第0个元素为:”ABC”,后两个元素均为空。
图3-1数组的创建在前面板中创建数组的方法是,从Controls模板中选择Array & Cluster,把数组放置在前面板中,然后选择一个对象(例如数值常量)插入到数组框中。
这样就创建了一个数值数组。
也可以直接在前面板中创建数组和相应的控制对象,然后将它们复制或者拖曳到流程图中,创建对应的常数。
还有很多在流程图中创建和初始化数组的方法,有些功能函数也可以生成数组。
3.2.2数组控制对象、常数对象和显示对象通过把数组与数值、布尔数、字符串或者簇组合在一起,可以在前面板和流程图中创建任何一种控制对象、常数对象和显示对象。
数据类型:数组、簇和波形.1概述数组是同类型元素的集合。
一个数组可以是一维或者多维,如果必要,每维最多可有231-1个元素。
可以通过数组索引访问其中的每个元素。
索引的范围是0到n – 1,其中n是数组中元素的个数。
图3-1所显示的是由数值构成的一维数组。
注意第一个元素的索引号为0,第二个是1,依此类推。
数组的元素可以是数据、字符串等,但所有元素的数据类型必须一致。
图3-1数组示意图簇(Cluster)是另一种数据类型,它的元素可以是不同类型的数据。
它类似于C语言中的stuct。
使用簇可以把分布在流程图中各个位置的数据元素组合起来,这样可以减少连线的拥挤程度。
减少子VI的连接端子的数量。
波形(Waveform)可以理解为一种簇的变形,它不能算是一种有普遍意义的数据类型,但非常实用。
3.2数组的创建及自动索引3.2.1创建数组一般说来,创建一个数组有两件事要做,首先要建一个数组的“壳”(shell),然后在这个壳中置入数组元素(如果需要用一个数组作为程序的数据源,可以选择Functions»Array»Array Constant,将它放置在流程图中。
然后再在数组框中放置数值常量、布尔数还是字符串常量。
下图显示了在数组框放入字符串常量数组的例子。
左边是一个数组壳,中间的图上已经置入了字符串元素,右边的图反映了数组的第0个元素为:”ABC”,后两个元素均为空。
图3-1数组的创建在前面板中创建数组的方法是,从Controls模板中选择Array & Cluster,把数组放置在前面板中,然后选择一个对象(例如数值常量)插入到数组框中。
这样就创建了一个数值数组。
也可以直接在前面板中创建数组和相应的控制对象,然它们复制或者拖曳到流程图中,创建对应的常数。
还有很多在流程图中创建和初始化数组的方法,有些功能函数也可以生成数组。
3.2.2数组控制对象、常数对象和显示对象通过把数组与数值、布尔数、字符串或者簇组合在一起,可以在前面板和流程图中创建任何一种控制对象、常数对象和显示对象。

LabVIEW(⼗):数组和簇★★★★★★★★★★★★★★★★★★★★★★★★★★★★★★★★★★★★★★★★⼀、数组1、创建数组(1)、前⾯板右键>“数组、矩阵与簇”>数组。
(2)、前⾯板右键>(选择要添加的数组数据类型,⽐如创建数值数组)数值>将“数值输⼊控件”拖⼊数组中。
(3)、选中数组右键>表⽰法>”DBL(双精度)”或“I32(长整型)”等,根据需要修改。
2、查看数组⼤⼩:(前⽂已有赘述)选中索引框右键>⾼级>显⽰最后元素3、改变数组的维度选中索引框>“添加维度”或“删除维度”4、数组的初始化将数组的“数值输⼊控件”往下拖拉以显⽰更多元素,在输⼊控件中填⼊数值。
初始化完毕。
5、“数组⼤⼩”函数:返回数组每个维度中元素的个数程序框图右键>数组>数组⼤⼩>为“数组⼤⼩”创建显⽰控件>连接需要获得数组⼤⼩的数组。
6、“创建数组”函数:连接多个数组或向N维数组添加元素。
(1)、程序框图右键>数组>创建数组(2)、将“创建数组”向上/下拖动可显⽰更多输⼊端。
也即:选中“创建数组”右键>”添加输⼊”或”删除输⼊”。
(3)、可输⼊单个“数值输⼊控件”(在前⾯板中添加),也可以输⼊数组。
7、添加的数组:“创建数组”创建的显⽰控件。
(1)、选中“创建数组”右键>(勾选)连接输⼊:两个N维的数组连接之后仍是N维数组。
(2)、选中“创建数组”右键>(未勾选)连接输⼊:两个N维的数组连接之后是2N维数组。
8、“数组插⼊”函数:在n维数组中索引指定的位置插⼊元素或⼦数组。
(1)、程序框图右键>数组>数组插⼊。
(2)、将“数组插⼊”向上/下拖动可显⽰更多输⼊端。
但不像创建数组那样有快捷菜单。
(3)、要添加索引的位置:“数组插⼊”右键>创建>常量。
可省略此项,省略该项则添加到数组末尾。
第三章 数据类型:数组、簇和波形3.1 概述数组是同类型元素的集合。
一个数组可以是一维或者多维,如果必要,每维最多可有231-1个元素。
可以通过数组索引访问其中的每个元素。
索引的范围是0到n – 1,其中n是数组中元素的个数。
图3-1所显示的是由数值构成的一维数组。
注意第一个元素的索引号为0,第二个是1,依此类推。
数组的元素可以是数据、字符串等,但所有元素的数据类型必须一致。
图3-1 数组示意图簇(Cluster)是另一种数据类型,它的元素可以是不同类型的数据。
它类似于C语言中的stuct。
使用簇可以把分布在流程图中各个位置的数据元素组合起来,这样可以减少连线的拥挤程度。
减少子VI的连接端子的数量。
波形(Waveform)可以理解为一种簇的变形,它不能算是一种有普遍意义的数据类型,但非常实用。
3.2 数组的创建及自动索引3.2.1 创建数组一般说来,创建一个数组有两件事要做,首先要建一个数组的“壳”(shell),然后在这个壳中置入数组元素(数或字符串等)。
如果需要用一个数组作为程序的数据源,可以选择Functions»Array»Array Constant,将它放置在流程图中。
然后再在数组框中放置数值常量、布尔数还是字符串常量。
下图显示了在数组框放入字符串常量数组的例子。
左边是一个数组壳,中间的图上已经置入了字符串元素,右边的图反映了数组的第0个元素为:”ABC”,后两个元素均为空。
图3-1 数组的创建在前面板中创建数组的方法是,从Controls模板中选择Array & Cluster,把数组放置在前面板中,然后选择一个对象(例如数值常量)插入到数组框中。
这样就创建了一个数值数组。
也可以直接在前面板中创建数组和相应的控制对象,然后将它们复制或者拖曳到流程图中,创建对应的常数。
还有很多在流程图中创建和初始化数组的方法,有些功能函数也可以生成数组。
3.2.2 数组控制对象、常数对象和显示对象通过把数组与数值、布尔数、字符串或者簇组合在一起,可以在前面板和流程图中创建任何一种控制对象、常数对象和显示对象。

第三章数据类型:数组、簇和波形3.1概述数组是同类型元素的集合。
一个数组可以是一维或者多维,如果必要,每维最多可有231-1个元素。
可以通过数组索引访问其中的每个元素。
索引的范围是0到n – 1,其中n是数组中元素的个数。
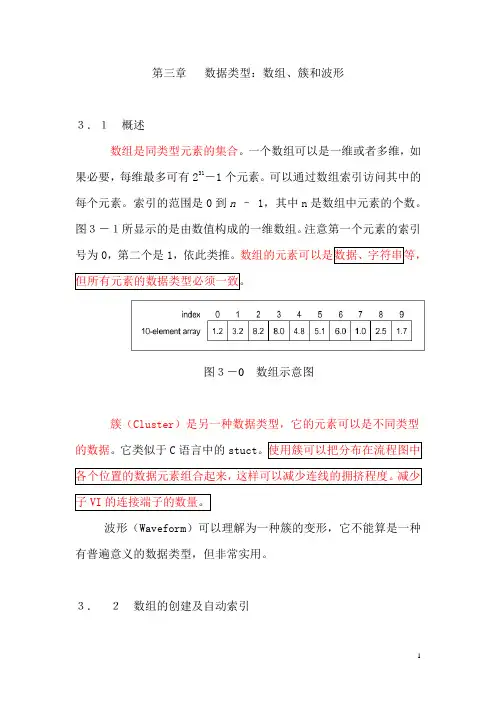
图3-1所显示的是由数值构成的一维数组。
注意第一个元素的索引号为0,第二个是1,依此类推。
图3-0数组示意图簇(Cluster)是另一种数据类型,它的元素可以是不同类型的数据。
它类似于C语言中的stuct波形(Waveform)可以理解为一种簇的变形,它不能算是一种有普遍意义的数据类型,但非常实用。
3.2数组的创建及自动索引3.2.1创建数组一般说来,如果需要用一个数组作为程序的数据源,可以选择Functions»Array»Array Constant,将它放置在流程图中。
然后再在数组框中放置数值常量、布尔数还是字符串常量。
下图显示了在数组框放入字符串常量数组的例子。
左边是一个数组壳,中间的图上已经置入了字符串元素,右边的图反映了数组的第0个元素为:”ABC”,后两个元素均为空。
图3-1数组的创建在前面板中创建数组的方法是,从Controls模板中选择Array & Cluster,把数组放置在前面板中,然后选择一个对象(例如数值常量)插入到数组框中。
这样就创建了一个数值数组。
也可以直接在前面板中创建数组和相应的控制对象,然后将它们复制或者拖曳到流程图中,创建对应的常数。
还有很多在流程图中创建和初始化数组的方法,有些功能函数也可以生成数组。
3.2.2数组控制对象、常数对象和显示对象通过把数组与数值、布尔数、字符串或者簇组合在一起,可以在前面板和流程图中创建任何一种控制对象、常数对象和显示对象。
数组元素不能是数组、图表或者图形。
如果您想查看一些数组的例子,请查看Examples\General\arrays.llb中的例子。
3.2.3自动索引当把某个外部节点的任何一维元素连接到循环边框的某个输入通道时,该数组的各个元素就将按顺序一个一个地输入到循环中。
:Document Type TutorialThis exercise is divided into parts. You are given the scenario for each part first. Refer to the end of this exercise for detailed implementation instructions for each part.1. Open the block diagram of the VI.In the following steps, you create a block diagram similar to the next figure.5. Iterate the Array.Add a to the right of the existing code.For LoopFor Loop For LoopAdd a second inside the first .array indicator For LoopWire the terminal to the interior border. This creates an auto-indexed input tunnel on both For Loops.1006. Multiply each element of the array by .Multiply For LoopAdd a function to the interior .x MultiplyWire the indexed input tunnel to the input of the function.Right-click the input and select from the shortcut menu.y Create»Constant100Enter in the constant.7. Round each element to the nearest whole number.Add a function to the right of the function.Round To Nearest MultipleMultiply Round To NearestWire the output of the function to the input of the function.8. Create a 2D array on the output of the For Loops to recreate the modified array.Wire the output of the function to the outer . This creates an auto-indexed output tunnel on both For Loops.Round To Nearest For LoopIntensity Graph9. Wire the output array to the indicator.10. Switch to the front panel.11. Save the VI.12. Enter values for Rows and Columns.13. Run the VI.Part 2: ImplementationModify Part 1 to accomplish the same goals without using the nested For Loops.Array Investigation Part 1.vi1. Open if it is not still open.2. Save the VI as Array Investigation Part 2.vi.3. Open the block diagram.Multiply Round to Nearest Remove For Loop 4. Right-click the border of the interior For Loop, containing the function and the function, and select .For Loop Remove For Loop5. Right-click the border of the remaining and select from the shortcut menu. Your block diagram should resemble the figure below.6. Save the VI.7. Switch to the front panel.8. Enter values for Rows and Columns.9. Run the VI.xNotice that the VI behaves the same as the solution for Part 1. This is because mathematical functions are polymorphic. For example, because the input of the Multiply function is a y Multiply xtwo-dimensional array, and the input is a scalar, the function multiplies each element in the array by the scalar, and outputs an array of the same dimension as the input.Part 3: ImplementationModify Array Investigation VI so that the VI creates a new array that contains the contents of the third row, and another new array that contains the contents of the second column.Array Investigation.vi1. Open located at the bottom of this pageArray Investigation Part 3.vi2. Save the VI as .3. Open the block diagram of the VI.In the following steps, you build a block diagram similar to that shown in the next figure.4. Retrieve the third row of data from Array using the Index Array function.Add the function to the block diagram.Index ArrayArray array Index ArrayWire to the input of the function.Tip: The Index Array function accepts an n-dimensional array. After you wire the input array to the Index Array function, the input and output terminal names change to match the dimension of the array wired. Therefore, wire the input array to the Index Array function before wiring any other terminals.index(row)Right-click the input of the Index Array function.Create»ConstantSelect from the shortcut menu.2Enter in the constant to retrieve the third row. Remember that the index begins at zero.Right-click the output of the function.subarray Index ArrayCreate»IndicatorSelect from the shortcut menu.Third RowName the indicator .5. Retrieve the second column of data from the Array using the Index Array function.Add another function to the block diagram.Index ArrayArray array Index ArrayWire to the input of the function.disable index(col)Index ArrayRight-click the input of the function.Create»ConstantSelect .1Enter in the constant to retrieve the second column because the index begins at zero.subarray Index ArrayRight-click the output of the function.Select .Create»IndicatorSecond ColumnName the indicator .6. Save the VI.7. Switch to the front panel.8. Enter values for Rows and Columns.9. Run the VI.1. Open a blank VI.Cluster Experiment.vi2. Save the VI as .In the following steps, you create a front panel similar to the figure below.top button3. Add a S to the front panel window.umeric4. Add a N indicator to the front panel window.Round LED5. Add a to the front panel.6. Rename the LED .Boolean 2Cluster numeric control, two toggle switches, and a slide control 7. Create a cluster named , containing a .Cluster ShellAdd a to the front panel.NumericAdd a control to the cluster.Vertical Toggle SwitchesAdd two to the cluster.Rename the Boolean toggle switches to Boolean 1.Horizontal Fill SlideAdd a to the cluster.Modified Cluster8. Create , containing the same contents as Cluster, but indicators instead of controls.ClusterCreate a copy of .Modified ClusterRelabel the copy .Modified Cluster Change to IndicatorRight-click the shell of , and select from the shortcut menu.9. Create , containing a and a .Small Cluster Boolean indicator numeric indicatorModified ClusterCreate a copy of .Small ClusterRelabel the copy .Delete the second toggle switch.Delete the horizontal fill slide indicator.Autosizing»Size to FitRight-click Small Cluster and select .SlideRelabel the numeric indicator to value.Resize the cluster as needed.Cluster, Modified Cluster, and Small Cluster10. Verify the cluster order of .Cluster Reorder Controls in ClusterRight-click the boundary of and select from the shortcut menu.1. Confirm the cluster order shown in the figure below.Click the button on the toolbar to set the cluster order and exit the cluster order edit mode.Confirm Right-click the boundary of and select from the shortcut menu.Modified Cluster Reorder Controls in Cluster Confirm the cluster orders shown in the figure below. should have the same cluster order as .Modified Cluster Cluster Click the button on the toolbar to set the cluster order and exit the cluster order edit mode.Confirm Right-click the boundary of and select from the shortcut menu. Click the button on the toolbar to set the cluster order and exit the cluster order Small Cluster Reorder Controls in Cluster OKedit mode. Confirm the cluster orders shown in the figure below.In the following steps, build the block diagram shown in the next figure.11. Add the from the Structures palette to the block diagram.While Loop Disassemble Cluster.Add the function to the block diagram.Unbundle Wire to the input of the to resize the function automatically.Cluster Unbundle function 13. Assemble Small Cluster.Add the function to the block diagram.Bundle Wire the function as shown in the figure above.Bundle 14. Assemble Modified Cluster.Add the function to the block diagram.Unbundle by Name Wire the to the function.Cluster Unbundle by Name Resize the function to have two output terminals.Unbundle by Name Select in the first node, and in the second node. If a label name is not correct, use the Operating tool to select the correct item.Numeric Boolean 1 Add the function to the block diagram.Increment Wire the output of the function to the input of the function. This function adds one to the value of .Numeric Unbundle By Name Increment Numeric Add the function to the block diagram.Not Wire the output of the function to the input of the function. This function returns the logical opposite of the value of Boolean.Boolean 1Unbundle By Name x Not。