01国际原子量表
- 格式:doc
- 大小:78.50 KB
- 文档页数:3


原子质量原子质量是描述一个原子质量大小的物理量,通常用原子单位(amu)来表示。
原子质量是在原子核中的质子和中子的质量之和,与电子的质量相比可以忽略不计。
原子质量的定义原子质量是以质子为基准进行量化的。
质子是原子核中带正电荷的基本粒子,其质量被定义为一个原子质量单位。
根据最新的定义,一个质子的质量是1.67262192369 × 10^-27 千克,或者约等于1.007276 amu。
质子和中子的质量之和,即原子核的质量,可以通过质谱仪等实验方法进行测量。
通过不同的实验数据,科学家们可以得到各个元素的原子质量。
原子质量的单位原子质量单位(atomic mass unit, amu)是描述原子质量大小的国际标准单位。
1 amu 等于质子质量的约 1/12。
换句话说,1 amu 的质量大约等于1.66053906660 × 10^-27 千克。
原子质量的测量科学家们通过使用质谱仪等实验设备来测量原子质量。
质谱仪是一种利用质谱技术分析样品中各种粒子的设备。
原子或分子经过质谱仪,其被电离后形成的离子通过磁场的作用,根据离子质量-电荷比进行分离和测量,从而得到原子质量。
原子质量的应用原子质量在许多方面都有重要的应用。
其中最重要的应用之一是在化学中。
当我们研究化学反应时,我们通常需要知道各种元素或化合物的摩尔质量。
通过知道元素的原子质量,我们可以确定摩尔质量,并且可以计算出物质的摩尔质量。
原子质量也在物理、天文学以及材料科学中发挥着重要的作用。
在核物理中,原子质量被用来计算核反应的能量、速度和轨道等,并且对于核聚变和核裂变等核反应的研究也起到了重要的作用。
原子质量的重要性原子质量的精确测量对于科学研究和应用具有重要意义。
它使得我们能够了解各种元素的性质,并且能够在化学反应、物理实验和天体观测中进行准确的计算和预测。
此外,了解原子质量还可以帮助我们理解原子结构、量子力学以及原子核的性质。
通过积累对不同元素和同位素(具有相同质量数但不同的原子核数)的原子质量的研究,科学家们可以揭示原子和分子之间的相互作用机制,并且可以为材料科学和能源研究等领域的发展提供基础。

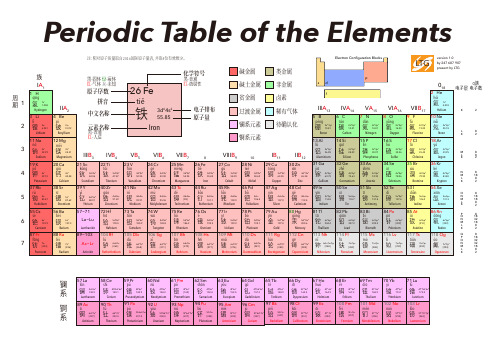
原素周期表原子周期表,也被称为元素周期表(Periodic Table),是一个按照元素原子序数(AtomicNumber)列出所有化学元素的表格,它有助于我们更好地理解元素间的关系,从而让我们能够更深入地研究元素的性质、组成以及其他特性。
原子周期表位于化学学术界的核心地位,并且已被纳入很多年的教学课程中。
原子周期表的起源可以追溯到1869年俄罗斯化学家埃米尔安汉(Dmitri Mendeleev)。
安汉观察到,按照原子序数从小到大排列,所有元素的某些特性(包括原子量、电荷、和密度)存在一种循环性的规律。
他试图把所有现有的元素归入一张表中,以便观察各种元素之间的相互关系和共性。
安汉的表格,也就是现在熟悉的原子周期表,在他设计之后几乎没有进行任何重大的改变。
原子周期表的表格中,每个元素的原子序数和原子量都被列出。
原子序数是每种原子中组成它的原子核环中的质子数,也是特定元素在化学反应时,质子和电子以外余电子数量的数目。
原子量,又称原子质量,是指每种元素原子(或分子)中质子和中子数量的总和,也可以称为“质子量”或“质子数”。
原子周期表的表格中,每种元素的原子核环的质子数目和原子质量都将被列出。
原子周期表中还列出了每种元素的归类,这是因为元素以及它们之间的相互关系可以根据不同的类别来分类,从而更容易地理解。
这些类别包括金属元素、非金属元素、气态元素、放射性元素以及普通元素等。
此外,原子周期表中还可以列出每种元素所处的原子结构以及它们的化学性质,比如沸点、折射率、熔点、密度和饱和电荷等等。
有了这些信息,我们就可以根据元素的排列,来认识它们之间的相互关系,也可以根据元素的特性来判断它们可能的化学反应。
正是由于原子周期表的重要性,才有了查询元素的“质子数-原子序数”图,其中可以看出原子序数与质子数之间的关系,以及各个元素所处的原子结构和它们的化学性质。
这些信息可以帮助人们更好地理解元素性质和相互关系,尤其是在化学实验中,这种信息尤其重要。
化学元素表◇actinium 锕Ac 原子序数:89原子量:227◇aluminium 铝Al 原子序数:13原子量:26.9815◇americium 镅Am 原子序数:95原子量:243◇antimony 锑Sb 原子序数:51原子量:121.75◇argon 氩Ar原子序数:18原子量:39.948◇arsenic 砷As原子序数:33原子量:74.922◇astatine 砹At原子序数:85原子量:210◇barium 钡Ba原子序数:56原子量:137.34◇berkelium 锫Bk 原子序数:97原子量:247◇beryllium 铍Be 原子序数:4原子量:9.012◇bismuth 铋Bi原子序数:83原子量:208.98◇bohrium Bh 原子序数:107原子量:262◇boron 硼B原子序数:5原子量:10.81◇bromine 溴Br原子序数:35原子量:79.904◇cadmium 镉Cd 原子序数:48原子量:112.40◇caesium 铯Cs原子序数:55原子量:132.905◇calcium 钙Ca原子序数:20原子量:40.08◇californium 锎Cf 原子序数:98原子量:251◇carbon 碳C原子序数:6原子量:12.011◇cerium 铈Ce原子序数:58原子量:140.12◇chlorine 氯Cl原子序数:17原子量:35.453◇chromium 铬Cr 原子序数:24原子量:51.996◇cobalt 钴Co原子序数:27原子量:58.933◇copper 铜Cu原子序数:29原子量:63.546◇curium 锔Cm原子序数:96原子量:247◇dubnium Db 原子序数:105原子量:262◇dysprosium 镝Dy 原子序数:66原子量:162.50◇einsteinium 锿Es 原子序数:99原子量:254◇erbium 铒Er原子序数:68原子量:167.26◇europium 铕Eu 原子序数:63原子量:151.96◇fermium 镄Fm 原子序数:100原子量:257◇fluorine 氟 F原子序数:9原子量:18.9984◇francium 钫Fr原子序数:87原子量:223◇gadolinium 钆Gd 原子序数:64原子量:157.25◇gallium 镓Ga原子序数:31原子量:69.72◇germanium 锗Ge 原子序数:32原子量:72.59◇gold 金Au原子序数:79原子量:196.967◇hafnium 铪Hf原子序数:72原子量:178.49◇hassium Hs原子序数:108原子量:265◇helium 氦He原子序数:2原子量:4.0026◇holmium 钬Ho 原子序数:67原子量:164.930◇hydrogen 氢H原子序数:1原子量:1.008◇indium 铟In原子序数:49原子量:114.82◇iodine 碘I原子序数:53原子量:126.9045◇iridium 铱Ir原子序数:77原子量:192.22◇iron 铁Fe原子序数:26原子量:55.847◇krypton 氪Kr原子序数:36原子量:83.80◇lanthanum 镧La 原子序数:57原子量:138.9055◇lawrencium 铹Lr 原子序数:103原子量:257◇lead 铅Pb原子序数:82原子量:207.2◇lithium 锂Li原子序数:3原子量:6.941◇lutetium 镥Lu原子序数:71原子量:174.97◇magnesium 镁Mg 原子序数:12原子量:24.305◇manganese 锰Mn 原子序数:25原子量:54.938◇meitnerium Mt 原子序数:109原子量:266◇mendelevium 钔Md 原子序数:101原子量:256◇mercury 汞Hg原子序数:80原子量:200.59◇molybdenum 钼Mo 原子序数:42原子量:95.94◇neodymium 钕Nd 原子序数:60原子量:144.24◇neon 氖Ne原子序数:10原子量:20.18◇neptunium 镎Np原子序数:93原子量:237.0482◇nickel 镍Ni原子序数:28原子量:58.71◇niobium 铌Nb原子序数:41原子量:92.906◇nitrogen 氮N原子序数:7原子量:14.0067◇nobelium 锘No原子序数:102原子量:254◇osmium 锇Os原子序数:76原子量:190.2◇oxygen 氧O原子序数:8原子量:15.9994◇palladium 钯Pd原子序数:46原子量:106.4◇phosphorus 磷P原子序数:15原子量:30.9738◇platinum 铂Pt原子序数:78原子量:195.09◇plutonium 钚Pu原子序数:94原子量:244.6◇polonium 钋Po原子序数:84原子量:210◇potassium 钾K原子序数:19原子量:39.102◇praseodymium 镨Pr 原子序数:59原子量:140.9077◇promethium 钷Pm 原子序数:61原子量:145.6◇protactinium 镤Pa 原子序数:91原子量:231.0359◇radium 镭Ra原子序数:88原子量:226.0254◇radon 氡Rn原子序数:86原子量:222◇rhenium 铼Re原子序数:75原子量:186.2◇rhodium 铑Rh原子序数:45原子量:102.9055◇rubidium 铷Rb原子序数:37原子量:85.47◇rutherfordium Rf 原子序数:104原子量:261◇ruthenium 钌Ru原子序数:44原子量:101.07◇samarium 钐Sm原子序数:62原子量:150.36◇scandium 钪Sc原子序数:21原子量:44.956◇seaborgium Sg 原子序数:106原子量:263◇selenium 硒Se原子序数:34原子量:78.96◇silicon 硅Si原子序数:14原子量:28.086◇silver 银Ag原子序数:47原子量:107.868◇sodium 钠Na原子序数:11原子量:22.9898◇strontium 锶Sr 原子序数:38原子量:87.62◇sulphur 硫S原子序数:16原子量:32.066◇tantalum 钽Ta 原子序数:73原子量:180.948◇technetium 锝Tc 原子序数:43原子量:98.062◇tellurium 碲Te 原子序数:52原子量:127.60◇terbium 铽Tb原子序数:65原子量:158.9254◇thallium 铊Tl原子序数:81原子量:204.37◇thorium 钍Th原子序数:90原子量:232.038◇thulium 铥Tm 原子序数:69原子量:168.934◇tin 锡Sn原子序数:50原子量:118.69◇titanium 钛Ti 原子序数:22原子量:47.90◇tungsten 钨W 原子序数:74原子量:183.85◇uranium 铀U 原子序数:92原子量:238.0289◇vanadium 钒V 原子序数:23原子量:50.9414◇xenon 氙Xe原子序数:54原子量:131.30◇ytterbium 镱Yb 原子序数:70原子量:173.04◇yttrium 钇Y原子序数:39原子量:88.9059◇zinc 锌Zn原子序数:30原子量:65.39◇zirconium 锆Zr 原子序数:40原子量:91.22。

Pure Appl. Chem., Vol. 83, No. 2, pp. 359–396, 2011.doi:10.1351/PAC-REP-10-09-14© 2010 IUPAC, Publication date (Web): 12 December 2010Atomic weights of the elements 2009(IUP AC Technical Report)*,**,†Michael E. Wieser1,‡and Tyler B. Coplen21Department of Physics and Astronomy, University of Calgary, Calgary, Canada;2U.S. Geological Survey, Reston, VA, USAAbstract: The biennial review of atomic-weight determinations and other cognate data hasresulted in changes for the standard atomic weights of 11 elements. Many atomic weights arenot constants of nature, but depend upon the physical, chemical, and nuclear history of thematerial. The standard atomic weights of 10 elements having two or more stable isotopeshave been changed to reflect this variability of atomic-weight values in natural terrestrialmaterials. To emphasize the fact that these standard atomic weights are not constants ofnature, each atomic-weight value is expressed as an interval. The interval is used togetherwith the symbol [a; b] to denote the set of atomic-weight values, A r(E), of element E in nor-mal materials for which a≤A r(E) ≤b. The symbols a and b denote the bounds of the inter-val [a; b]. The revised atomic weight of hydrogen, A r(H), is [1.00784; 1.00811] from1.00794(7); lithium, A r(Li), is [6.938; 6.997] from 6.941(2); boron, A r(B), is [10.806;10.821] from 10.811(7); carbon, A r(C), is [12.0096; 12.0116] from 12.0107(8); nitrogen,A r(N), is [14.00643; 14.00728] from 14.0067(2); oxygen, A r(O), is [15.99903; 15.99977]from 15.9994(3); silicon, A r(Si), is [28.084; 28.086] from 28.0855(3); sulfur, A r(S), is[32.059; 32.076] from 32.065(2); chlorine, A r(Cl), is [35.446; 35.457] from 35.453(2); andthallium, A r(Tl), is [204.382; 204.385] from 204.3833(2). This fundamental change in thepresentation of the atomic weights represents an important advance in our knowledge of thenatural world and underscores the significance and contributions of chemistry to the well-being of humankind in the International Year of Chemistry 2011. The standard atomic weightof germanium, A r(Ge), was also changed to 72.63(1) from 72.64(1).Keywords: atomic-weight interval; atomic-weight range; conventional atomic-weight values;boron; carbon; chlorine; germanium; half-lives; hydrogen; IUPAC Inorganic ChemistryDivision; lithium; nitrogen; oxygen; silicon; sulfur; thallium.1. INTRODUCTIONAccurate atomic weights of chemical elements are fundamental in science, technology, trade, and com-merce. In particular, no practical use can be made of the results of analytical chemistry without atomic weights, which relate the mass of a chemical element to its amount. Recommended atomic-weight val-ues for use in science, industry, and trade date from F. W. Clarke’s 1882 atomic-weight recalculation359M. E. WIESER AND T. B. COPLEN360[1] and were followed by publication in 1898 of recommended values in the annual reports of the American Chemical Society’s Atomic Weights Commission [2]. From its inception in 1919, the International Union of Pure and Applied Chemistry (IUPAC) took over the careful evaluation and dis-semination of atomic weights and their measurement uncertainties derived from critically assessed, published information. Recommended atomic-weight values have been published under IUPAC since 1920. In 1979 [3], the Commission on Atomic Weights and Isotopic Abundances, as it was known then, agreed that an atomic weight could be defined for any specified sample and decreed that “Dated Tables of Standard Atomic Weights published by the Commission refer to our bestknowledge of the elements in natural [defined below] terrestrial sources.”In recent times, the Table of Standard Atomic Weights has been published biennially, and their values are virtually unchallenged throughout the world. Each standard atomic-weight value reflects the best knowledge of evaluated, published data. The most recent recommended atomic weights were pub-lished in 2009 [4]. Periodically, the history of the standard atomic-weight value of each element is reviewed, emphasizing the relevant published scientific evidence upon which decisions were based [5,6].The Commission on Isotopic Abundances and Atomic Weights (hereafter termed the Commission) met in Vienna, Austria under the chairmanship of Prof. R. Gonfiantini from 28 to 29 July 2009, prior to the 45th IUPAC General Assembly in Glasgow, Scotland. At this meeting, the Commission reviewed recommendations of its Subcommittee on Isotopic Abundance Measurements (SIAM), which reviewed the literature from the past two years of publications, and the Commission rec-ommended that “Isotopic compositions of the elements 2009” [7] be published. At the 2009 meeting, the Commission reviewed and accepted recommendations from the IUPAC project “Assessment of fun-damental understanding of isotopic abundances and atomic weights of the chemical elements” [8] to update the Table of Standard Atomic Weights 2009 and to emphasize the fact that many atomic weights are not constants of nature as their values depend on the source of the material.1.1 Atomic weight of an elementThe atomic weight,A r(E), of element E in a specimen can be determined from knowledge of the atomic masses of the isotopes of that element and the corresponding mole fractions of the isotopes of that ele-ment in the specimen. The Commission used the atomic-mass evaluations of 2003 [9,10] for calcula-tions of the atomic weights that were changed in this compilation. There are 21 elements that have only one stable isotope, defined by the Commission as having a half-life greater than 1 × 10¹⁰a [11]. The standard atomic weight of each of these elements having a single stable isotope is derived from the atomic mass of this stable isotope [9,10]. For elements with no stable isotopes or with no radioactive isotopes having a half-life greater than 1 × 10¹⁰a (e.g., Ra), no standard atomic weight can be calcu-lated and no value is provided in the Table of Standard Atomic Weights. The majority of the elements have two or more stable isotopes. For these elements, the atomic weight of an element in a substance is the abundance-weighted sum of the atomic masses of its isotopes. The atomic weight in a substance P is expressed by the relationA r(E)P= Σ[x(i E) ×A r(i E)]where x(i E) is the mole fraction of isotope i E and the summation is over all stable isotopes of the ele-ment.1.2 “Best measurement” of the isotopic abundances of an elementFor several decades, the isotopic abundances of many elements with two or more stable isotopes have been measured with decreasing measurement uncertainty by means of mass spectrometry. As a result,© 2010, IUPAC Pure Appl. Chem., Vol. 83, No. 2, pp. 359–396, 2011Atomic weights of the elements 2009361 the uncertainty in atomic-weight measurements, U[A r(E)], has improved substantially. The Commission regularly evaluates reports of isotopic abundances to select the “best measurement” of the isotopic abundances of an element in a specified material. The best measurement may be defined as a set of analyses of the isotope-amount ratio, r, or isotope-number ratio, R, of an element in a well-character-ized, representative material with small combined uncertainty. To be considered by the Commission for evaluation, reports must be published in peer-reviewed literature, and the results should be given with sufficient detail so that the Commission can reconstruct the uncertainty budget in its various compo-nents, including sample preparation, analysis of isotope-amount or isotope-number ratios, and data han-dling. Criteria used to evaluate a “best measurement” include:1.The extent to which measurement uncertainties of random and systematic nature have beenassessed and documented in the report. The Commission seeks evidence that mass-spectrometer linearity, mass-spectrometric fractionation of ions of varying masses, memory, baseline, interfer-ence between ions, sample purity and preparation effects, and statistical assessment of data were carried out properly. Preference is given to measurements that are fully calibrated with synthetic mixtures of isotopes of the element of interest, covering the isotopic-abundance variations of nat-urally occurring materials over the interval of the masses of the isotopes in the material being ana-lyzed.2.The relevance and availability of the analyzed material for the scientific community involved inisotopic measurements and calibrations. Preference is given to analyses of chemically stable materials that are distributed internationally as isotopic reference materials, e.g., by the U.S.National Institute of Standards and Technology (NIST), the European Institute for Reference Materials and Measurements (IRMM), the International Atomic Energy Agency (IAEA), etc., or to isotopically unfractionated representatives of homogeneous terrestrial materials.The Commission wishes to emphasize the need for new, calibrated isotopic-composition meas-urements to improve the standard atomic-weight values of a number of elements, which are still not known to a sufficiently small uncertainty, e.g., Ge, Gd, Hf, Hg, Mo, Pd, Ru, and Sm.1.3 “Normal” materialAlthough uncertainties of most atomic-weight measurements have improved over the last century, by 1967 it was recognized that there were seven elements (H, B, C, O, Si, S, and Cu) whose atomic-weight uncertainties could not be reduced because of variations in the mole fractions of their isotopes in nor-mal materials [12], and it was recognized that these isotopic-abundance variations can affect the atomic weights of some reagents [13]. By a “normal” material, the Commission means a material from a ter-restrial source that satisfies the following criterion:“The material is a reasonably possible source for this element or its compounds in com-merce, for industry or science; the material is not itself studied for some extraordinaryanomaly and its isotopic composition has not been modified significantly in a geologicallybrief period.” [5]With improvements in analytical instrumentation during the last three decades, the number of ele-ments with two or more isotopes that have variations in atomic-weight values in normal materials that exceed the uncertainty of the atomic weight determined from a best measurement of isotopic abun-dances grew to 18 elements in the 2007 Table of Standard Atomic Weights [4]. These elements having two or more stable isotopes are given footnote “r” in the Table of Standard Atomic Weights to indicate that a range in isotopic composition of normal terrestrial material prevents a more precise A r(E) from being given.© 2010, IUPAC Pure Appl. Chem., Vol. 83, No. 2, pp. 359–396, 2011M. E. WIESER AND T. B. COPLEN3621.4 Categorization of elements by their atomic-weight and isotopic-composition variationsBecause variation in isotopic composition of an element impacts its atomic weight, the Commission has undertaken assessments of variations of isotopic compositions in the published literature, both through its former Subcommittee for Natural Isotopic Fractionation and through IUPAC projects. Graphical plots of isotopic-abundance variation and atomic-weight variation were published for 15 elements: H, Li, B, C, N, O, Mg, Si, S, Cl, Ca, Cr, Fe, Cu, and Tl [14,15].These elements can be categorized according to constraints on their standard atomic weights: 1. Elements with no stable isotopes or with no radioactive isotopes having a half-life greater than1× 1010a, e.g., radon. No standard atomic weight can be calculated and no value is provided in the Table of Standard Atomic weights for these elements.2. Elements with one stable isotope, e.g., sodium. The standard atomic weight is derived from theatomic mass of its stable isotope [9,10].3. Elements with two or more isotopes showing no evidence of variation in atomic weight for natu-ral terrestrial materials, or elements that currently are not being evaluated for variation in isotopic composition by an IUPAC project, e.g., tungsten.4. Elements with two or more isotopes having variations in atomic weight in natural terrestrial mate-rials, but these variations do not exceed the measurement uncertainty of the atomic weight derived from the “best measurement” of the isotopic abundances of an element, e.g., iron (Fig. 1).5. Elements with two or more isotopes having variations in atomic weight in natural terrestrial mate-rials that exceed the uncertainty of the atomic weight derived from a best measurement of isotopic abundances and have published isotopic compositions currently being evaluated in an IUPAC project, e.g., copper, which is being evaluated in the IUPAC project “Evaluation of Isotopic Abundance Variations in Selected Heavier Elements,” [16] or strontium, which is being evaluated in the IUPAC project “Evaluation of Radiogenic Abundance Variations in Selected Elements”[17].6. Elements with two or more isotopes having variations in atomic weight in natural terrestrial mate-rials that exceed the uncertainty of the atomic weight derived from a “best measurement” of iso-topic abundances and having their upper and lower atomic-weight bounds determined by the Commission from evaluated, published data, e.g., carbon (Fig. 2).Elements in category 3 may enter category 4 as more accurate isotopic-abundance measurements are made. Similarly, elements in category 4 can advance to category 5 as best-measurement results improve. The Commission uses the footnote “g” to identify chemical elements for which the standard atomic weight and its associated uncertainty do not include all known variations, e.g., the anomalous occurrences of isotopic composition for fissionogenic elements found at the Oklo natural nuclear reac-tor in Gabon. For category 3 to 6 elements, the Commission uses the footnote “m” to identify the chem-ical elements for which the standard atomic weight and its associated uncertainty in commercially avail-able material do not include variations due to undisclosed or inadvertent isotopic fractionation. Periodic changes to the values and uncertainties in standard atomic weights result from improved measurements of the atomic masses, and these changes primarily impact category 2 elements.© 2010, IUPAC Pure Appl. Chem., Vol. 83, No. 2, pp. 359–396, 2011Atomic weights of the elements 2009363Fig. 1Example of an element (iron) showing variation in atomic weight in natural terrestrial materials that does not exceed the uncertainty of the standard atomic weight determined from the “best measurement” of isotopic abundances (modified from [14,15]). An isotopic reference material (IRMM-014 elemental iron) is designated by a solid black circle. The current standard atomic weight of iron, 55.845(2), was established in 1993 [18]. The atomic-weight uncertainty determined from the best measurement of isotopic abundances [19] is approximately ±0.0005 and encompasses the atomic weight of all natural terrestrial materials.1.5 Atomic-weight intervalsAtomic-weight distributions calculated from published variations in isotopic compositions can span a relatively large interval. For example, the atomic weight of carbon in normal materials spans atomic-weight values from approximately 12.0096 to 12.0116 (Fig. 2), whereas the uncertainty of the atomic weight calculated from the best measurement of the isotopic abundance of carbon is approximately 30times smaller [7,20]; A r(C) = 12.01109(3). The span of atomic-weight values in normal materials is termed the interval. The interval is used together with the symbol [a; b] to denote the set of values x for which a ≤x ≤b, where b > a and where a and b are the lower and upper bounds, respectively [21]. Neither the upper nor lower bounds have any uncertainty associated with them; each is a considered decision by the Commission based on professional evaluation and judgment. Writing the standard atomic weight of carbon as “[12.0096; 12.0116]” indicates that its atomic weight in any normal mate-rial will be greater than or equal to 12.0096 and will be less than or equal to 12.0116. Thus, the atomic-weight interval is said to encompass atomic-weight values of all normal materials. The range of an inter-val is the difference between b and a, that is b – a[21]; thus, the range of the atomic-weight interval of carbon is calculated as 12.0116 – 12.0096 = 0.0020. The standard atomic weight of an element should not be expressed as the average of a and b with an associated uncertainty of ± half of the range.The lower bound of an atomic-weight interval is determined from the lowest atomic weight deter-mined by the Commission’s evaluations and taking into account the uncertainty of the measurement. Commonly, an isotope-delta measurement is the basis for the determination of the bound [14,15]. In addition to the uncertainty in the delta measurement, the uncertainty in the atomic weight of the mate-rial anchoring the delta scale also must be taken into account. The latter is the uncertainty in relating a delta scale to an atomic-weight scale [14,15]. If substance P is the normal terrestrial material having the lowest atomic weight of element E, then© 2010, IUPAC Pure Appl. Chem., Vol. 83, No. 2, pp. 359–396, 2011lower bound = lowest A r (E)P – U [A r (E)]Pwhere U [A r (E)]P is the combined uncertainty that incorporates the uncertainty in the measurement of the delta value of substance P and the uncertainty in relating the delta-value scale to the atomic-weight scale. For example, consider the lower bound for carbon. The substance with the lowest measured 13C M. E. WIESER AND T . B. COPLEN© 2010, IUPAC Pure Appl. Chem., Vol. 83, No. 2, pp. 359–396, 2011364Fig. 2Variation in atomic weight with isotopic composition of selected carbon-bearing materials (modified from[14,15]). Isotopic reference materials are designated by solid black circles. The previous (2007) standard atomic weight of carbon [4] was 12.0107(8). The atomic-weight uncertainty of the “best measurement” of isotopic abundance [7,20] is approximately ±0.000027, which is about 30 times smaller than the uncertainty of the 2007standard atomic weight [4].Atomic weights of the elements 2009365 abundance is crocetane (2,6,11,15-tetramethylhexadecane) produced at cold seeps of the eastern Aleutian subduction zone [22]. For this specimen, A r(C) = 12.009662, where the atomic weight is deter-mined from an isotope-delta value [14,15]. The uncertainty of the delta measurement is equivalent to an uncertainty in the atomic weight of 0.000003. The uncertainty in relating the carbon-delta scale to its atomic-weight scale corresponds to an atomic-weight uncertainty of 0.000027. Therefore, the com-bined uncertainty in the lowest atomic-weight value of carbon is U[A r(E)]P= (0.0000032+ 0.0000272)1/2= 0.000027 and the lower bound = 12.009662 – 0.000027 = 12.009635.The upper bound is calculated in an equivalent manner except that the combined uncertainty is added to the atomic-weight value of the substance P with the highest measured atomic weight.upper bound = highest A r(E)P+ U[A r(E)]PFor the example of carbon, the substance with the highest 13C-abundance fraction is deep-sea pore water, and it has an atomic-weight value of 12.011505. The uncertainty in the atomic-weight value of this substance, due to the uncertainty in the delta-value determination, is 0.000003. As with the lower bound, the uncertainty in relating the carbon-delta scale to its atomic-weight scale results in an atomic-weight uncertainty of 0.000027. Thus, the upper bound = 12.011505 + (0.0000032+ 0.0000272)1/2= 12.011532.The uncertainties of the delta measurements and the uncertainty of the atomic weight derived from the best measurement of isotopic abundances constrain the number of significant figures in the atomic-weight values of the upper and lower bounds. For carbon, the fifth digit after the decimal point is uncertain because of the uncertainty value of 0.000027. Therefore, the number of significant digits in the atomic-weight value is reduced to four figures after the decimal point. The Commission may rec-ommend additional conservatism and reduce the number of significant figures further. For the lower bound of carbon, 12.009635 is truncated to 12.0096. For an upper bound, the trailing digit is increased to ensure the atomic-weight interval encompasses the atomic-weight values of all normal materials. In the case of carbon, the upper bound is adjusted from 12.011532 to 12.0116 to express four digits after the decimal point. The lower and upper bounds are evaluated so that the number of significant digits in each is identical. If a value ends with a zero, it may need to be included in the value to express the required number of digits. The following are examples of lower and upper atomic-weight bounds for oxygen that could be published by the Commission in its various tables.15.9990315.99977Unabridged Table of Standard Atomic Weights15.999015.9998Abridged to six figures15.99916.000Table of Standard Atomic Weights Abridged to Five Figures15.9916.00Table of Standard Atomic Weights Abridged to Four FiguresRules and comments on determining values of atomic-weight intervals of elements having two or more stable isotopes include:1.The variation in atomic-weight values of an element is termed an atomic-weight “interval” withthe symbol [a; b], where a and b are the lower and upper bounds, respectively, of the interval;thus, for element E, a ≤A r(E)≤b.2.The standard atomic weight of an element expressed as an interval, [a; b], should not be expressedas the average of a and b with an associated uncertainty equal to half of the difference between b and a.3.The atomic-weight interval encompasses atomic-weight values of all normal materials.4.The atomic-weight interval is the standard atomic weight and is the best knowledge of atomicweights of natural terrestrial sources.5.The atomic-weight interval and range should not be confused. The atomic-weight range is equalto b – a, where a and b are the lower and upper bounds, respectively.© 2010, IUPAC Pure Appl. Chem., Vol. 83, No. 2, pp. 359–396, 2011M. E. WIESER AND T. B. COPLEN3666.The lower and upper bounds commonly are determined from the lowest and highest isotope-deltavalues of normal materials, taking into account uncertainties of the isotope-delta measurements and uncertainty in relating the isotope-delta scale to the atomic-weight scale of an element.7.Both lower and upper bounds are consensus values, and neither has any uncertainty associatedwith it.8.The number of significant figures in the lower and upper bounds are adjusted so that mass-spec-trometric measurement uncertainties do not impact the bounds.9.The number of significant figures in the lower and upper bounds should be identical. A zero as atrailing digit in a value may be needed and is acceptable.10.The atomic-weight interval is selected conservatively so that changes in the Table of StandardAtomic Weights are needed infrequently.11.The atomic-weight interval is given as precisely as possible and should have as many digits aspossible consistent with the previously stated rules.12.Values of atomic-weight intervals are updated in the Table of Standard Atomic Weights byIUPAC’s Commission on Isotopic Abundances and Atomic Weights following completion of an IUPAC project reviewing the published literature for peer-reviewed, isotopic-abundance data. 13.If the variation in isotopic composition in normal materials of an element is under evaluation byan IUPAC project, a footnote “r” may be retained in the Table of Standard Atomic Weights until the project completes its evaluation in order that changes to Tables are infrequent. Currently, such elements include He, Ni, Cu, Zn, Se, Sr, Ar, and Pb.2. TABLES OF STANDARD ATOMIC WEIGHTS IN ALPHABETIC AND ATOMIC-NUMBER ORDERThe Table of Standard Atomic Weights 2009 is given in alphabetical order of the English names in Table1 and in order of atomic number in Table2. The standard atomic weights reported in Tables 1 and 2 are for atoms in their nuclear and electronic ground states. With minor exceptions covered by foot-notes, the Table of Standard Atomic Weights is intended to apply to all samples from natural terrestrial occurrences, as well as to materials in commerce, samples found in laboratories involved in chemical investigations, and samples in technological applications. The Table of Standard Atomic Weights does not apply to extraterrestrial materials or to materials with deliberately altered isotopic compositions.To indicate that standard atomic weights of elements with two or more stable isotopes are not con-stants of nature, the Table of Standard Atomic Weights 2009 lists atomic-weight intervals for the stan-dard atomic weights of 10 such elements (B, C, Cl, H, Li, N, O, S, Si, and Tl). These elements had foot-note “r” in the Table of Standard Atomic Weights 2007 [4], and this footnote is not retained for these elements. For all of these elements, a graphical plot of substance, isotopic abundance, and atomic weight is provided in this report, and figure numbers are provided in Tables 1 and 2 for the interested reader.For elements within categories 2 to 5 (see Section 1.4 for category descriptions), a decisional uncertainty, U[A r(E)], is given in parentheses following the last significant figure to which it is attrib-uted. If there is no specific statement on the distribution of possible values, then the distribution should be regarded as a rectangular distribution. The interval A r(E)–U[A r(E)] to A r(E)+U[A r(E)] may be expected to encompass almost all samples from natural terrestrial occurrences as well as materials in commerce and samples found in technological applications or in laboratories involved in scientific investigations.For all elements for which a change in the standard atomic weight is recommended, the Commission by custom makes a statement on the reason for the change and includes a list of recom-mended values over a period in excess of the last 100 years, which are taken from [23] and subsequent Commission publications. Values before the formation of the International Committee on Atomic Weights in 1900 come from [24].© 2010, IUPAC Pure Appl. Chem., Vol. 83, No. 2, pp. 359–396, 2011Atomic weights of the elements 2009367(continues on next page)© 2010, IUPAC Pure Appl. Chem., Vol. 83, No. 2, pp. 359–396, 2011M. E. WIESER AND T . B. COPLEN © 2010, IUPAC Pure Appl. Chem., Vol. 83, No. 2, pp. 359–396, 2011368© 2010, IUPAC Pure Appl. Chem., Vol. 83, No. 2, pp. 359–396, 2011© 2010, IUPAC Pure Appl. Chem., Vol. 83, No. 2, pp. 359–396, 2011© 2010, IUPAC Pure Appl. Chem., Vol. 83, No. 2, pp. 359–396, 2011© 2010, IUPAC Pure Appl. Chem., Vol. 83, No. 2, pp. 359–396, 2011© 2010, IUPAC Pure Appl. Chem., Vol. 83, No. 2, pp. 359–396, 2011undergone undisclosed or inadvertent isotopic fractionation. Historical values of A r (H) include [23]:1882, 1.00; 1894, 1.008; 1931, 1.0078; 1938, 1.0081; 1940, 1.0080; 1961, 1.00797; 1969, 1.0080(3);1971, 1.0079(1).3.2 LithiumThe Commission has changed the recommended value for the standard atomic weight of lithium, A r (Li),to the atomic-weight interval [6.938; 6.997] based on an investigation and evaluation of the effect of the variation in isotopic abundance in natural terrestrial materials upon the atomic weight of lithium [14,15]. This change in the standard atomic weight of lithium is intended to emphasize the fact that the atomic weight of lithium is not a constant of nature but depends upon the source of the material (Fig.4).© 2010, IUPACPure Appl. Chem., Vol. 83, No. 2, pp. 359–396, 2011Fig. 3Variation in atomic weight with isotopic composition of selected hydrogen-bearing materials (modified from [14,15], taking into account [27]). Isotopic reference materials are designated by solid black circles. The previous (2007) standard atomic weight of hydrogen was 1.00794(7). The atomic-weight uncertainty of the “best measurement” of isotopic abundance [7,29] is approximately ±0.00000005, which is about 1000 times smaller than the uncertainty of the 2007 standard atomic weight [4].。
STANDARD ATOMIC WEIGHTS (2001)This table of atomic weights includes the changes made in 1999 and 2001 by the IUPAC Commission on Atomic Weights and Isotopic Abundances. The Standard Atomic Weights apply to the elements as they exist naturally on Earth, and the uncertainties take into account the isotopic variation found in most laboratory samples. Further comments on the variability are given in the footnotes.The number in parentheses following the atomic weight value gives the uncertainty in the last digit. An atomic weight entry in brackets indicates that the element that has no stable isotopes; the value given is the atomic mass in u (or the mass number, if the mass is not accurately known) for the isotope of longest half-life. Thorium, protactinium, and uranium have no stable isotopes, but the terrestrial isotopic composition is sufficiently uniform to permit a standard atomic weight to be specified.REFERENCES1.Vocke, R. D., Pure Appl. Chem. 71, 1593, 1999.2.Coplen, T. D., Pure Appl. Chem. 73, 667, 2001.3.Coplen, T. D., J. Phys. Chem. Ref. Data, 30, 701, 2001.4.Loss, R. D., Report of the IUPAC Commission on Atomic Weights and Isotopic Abundances, Chemistry International, 23, 179, 2001.Name Symbol Atomic No.Atomic Weight FootnotesActinium Ac89[227.0277]aAluminum Al1326.981538(2)Americium Am95[243.0614]aAntimony Sb51121.760(1)gArgon Ar1839.948(1)g rArsenic As3374.92160(2)Astatine At85[209.9871]aBarium Ba56137.327(7)Berkelium Bk97[247.0703]aBeryllium Be49.012182(3)Bismuth Bi83208.98038(2)Bohrium Bh107[264.12]aBoron B510.811(7)g m rBromine Br3579.904(1)Cadmium Cd48112.411(8)gCalcium Ca2040.078(4)gCalifornium Cf98[251.0796]aCarbon C612.0107(8)g rCerium Ce58140.116(1)gCesium Cs55132.90545(2)Chlorine Cl1735.453(2)g m rChromium Cr2451.9961(6)Cobalt Co2758.933200(9)Copper Cu2963.546(3)rCurium Cm96[247.0704]aDubnium Db105[262.1141]aDysprosium Dy66162.500(1)gEinsteinium Es99[252.0830]aErbium Er68167.259(3)gEuropium Eu63151.964(1)gFermium Fm100[257.0951]aFluorine F918.9984032(5)Francium Fr87[223.0197]aGadolinium Gd64157.25(3)gGallium Ga3169.723(1)Germanium Ge3272.64(1)Gold Au79196.96655(2)Hafnium Hf72178.49(2)1-12Name Symbol Atomic No.Atomic Weight Footnotes Hassium Hs108[277]a Helium He2 4.002602(2)g r Holmium Ho67164.93032(2)Hydrogen H1 1.00794(7)g m r Indium In49114.818(3)Iodine I53126.90447(3)Iridium Ir77192.217(3)Iron Fe2655.845(2)Krypton Kr3683.798(2)g m Lanthanum La57138.9055(2)g Lawrencium Lr103[262.1097]a Lead Pb82207.2(1)g r Lithium Li3 6.941(2) b g m r Lutetium Lu71174.967(1)g Magnesium Mg1224.3050(6)Manganese Mn2554.938049(9)Meitnerium Mt109[268.1388]a Mendelevium Md101[258.0984]a Mercury Hg80200.59(2)Molybdenum Mo4295.94(2)g Neodymium Nd60144.24(3)g Neon Ne1020.1797(6)g m Neptunium Np93[237.0482]a Nickel Ni2858.6934(2)Niobium Nb4192.90638(2)Nitrogen N714.0067(2)g r Nobelium No102[259.1010]a Osmium Os76190.23(3)g Oxygen O815.9994(3)g r Palladium Pd46106.42(1)g Phosphorus P1530.973761(2)Platinum Pt78195.078(2)Plutonium Pu94[244.0642]a Polonium Po84[208.9824]a Potassium K1939.0983(1)g Praseodymium Pr59140.90765(2)Promethium Pm61[144.9127]a Protactinium Pa91231.03588(2)Radium Ra88[226.0254]a Radon Rn86[222.0176]a Rhenium Re75186.207(1)Rhodium Rh45102.90550(2)Rubidium Rb3785.4678(3)g Ruthenium Ru44101.07(2)g Rutherfordium Rf104[261.1088]a Samarium Sm62150.36(3)g Scandium Sc2144.955910(8)Seaborgium Sg106[266.1219]a Selenium Se3478.96(3)r Silicon Si1428.0855(3)r Silver Ag47107.8682(2)g Sodium Na1122.989770(2)Strontium Sr3887.62(1)g r Sulfur S1632.065(5)g r Tantalum Ta73180.9479(1)Technetium Tc43[97.9072]a Tellurium Te52127.60(3)g Terbium Tb65158.92534(2)1-13Name Symbol Atomic No.Atomic Weight FootnotesThallium Tl81204.3833(2)Thorium Th90232.0381(1)gThulium Tm69168.93421(2)Tin Sn50118.710(7)gTitanium Ti2247.867(1)Tungsten W74183.84(1)Ununbium Uub112[285]aUnunhexium Uuh116[289]aUnunnilium Uun110[281]aUnunquadium Uuq114[289]aUnununium Uuu111[272.1535]aUranium U92238.02891(3)g mVanadium V2350.9415(1)Xenon Xe54131.293(6)g mYtterbium Yb70173.04(3)gYttrium Y3988.90585(2)Zinc Zn3065.409(4)Zirconium Zr4091.224(2)ga No stable isotope exists. The atomic mass in u (or the mass number, if the mass is not accurately known) is given in brackets for the isotope oflongest half-life.b Commercially available Li materials have atomic weights that range between 6.939 and 6.996; if a more accurate value is required, it must bedetermined for the specific material.g Geological specimens are known in which the element has an isotopic composition outside the limits for the normal material. The differencebetween the atomic weight of the element in such specimens and that given in the table may exceed the stated uncertainty.m Modified isotopic compositions may be found in commercially available material because it has been subject to an undisclosed or inadvertent isotopic fractionation. Substantial deviations in atomic weight of the element from that given in the table can occur.r Range in isotopic composition of normal terrestrial material prevents a more precise atomic weight being given; the tabulated value should be applicable to any normal material.1-14。