预焙阳极影响The Impact of Raw Material Quality and Anode Manufacturing Parameters on the Behavior
- 格式:pdf
- 大小:244.99 KB
- 文档页数:4

提高预焙阳极质量的控制途径和手段Ξ谭 斌(贵阳铝镁设计研究院,贵州 贵阳 550004) 摘 要:指出要提高预焙阳极的质量,首先要保证原料的质量,提高煅烧质量和糊料配料质量以及配入最佳的优质粘结剂。
在焙烧工序中,焙烧炉的设计和焙烧的合理升温曲线及温度,能实现自动控制的先进的燃烧装置,是生产高质量阳极的有效保证。
关键词:预焙阳极;质量;控制途径中图分类号:O646151 文献标识码:B 文章编号:1004-2660(2004)03-0027-04C ontrol Means and Ways for Improving the Quality of Prebaked AnodesT AN Bin(G uiyang Aluminium2Magnesium Design&Research Institute,G uiyang550004,China)Abstract:The paper indicates that the key to the im provement of the quality of prebaked anodes lies firstly in ensuring the quality of raw materials,upgrading the qualities of calcinations and petroleum coke feed and charging with the best binding material.In baking process,a g ood design of baking fur2 nace,rational consideration for both tem perature rise curve and tem perature as well as advanced combus2 tion system with automatic control are the im protant prerequisites for producing excellent anodes.K ey w ords:Prebaked anode;quality;way of control1 阳极质量对铝电解生产的影响在铝电解过程中阳极的质量不好,如密度小、孔隙度大、机械强度低等,会造成阳极在铝电解过程中过量消耗、阳极空气氧化率、铝电解副反应和粉尘率增大;还会使阳极导电面积减少、阳极电流密度增大、阳极发热量增加,电解质导电率下降、阳极和电解质压降增加,电耗增加。

电解铝用预焙阳极的生产流程英文回答:Production Process of Prebaked Anodes for Aluminum Electrolysis.The production of prebaked anodes for aluminum electrolysis involves several key steps:1. Raw Material Preparation:Petroleum coke is calcined to increase its reactivity and remove impurities.Pitch is melted and degassed to remove volatile components.2. Blending:Calcined petroleum coke and pitch are blended in aspecific ratio to achieve the desired anode properties.3. Kneading:The blend is kneaded under high pressure and temperature to form a homogeneous mixture called "green anode paste."4. Forming:The green anode paste is pressed into the desired shape and size using a forming machine.5. Baking:The formed anodes are baked at a high temperature to solidify the pitch binder and carbonize the petroleum coke particles.6. Impregnation:To improve electrical conductivity, the baked anodesare impregnated with a low-viscosity coal tar pitch or a mixture of pitch and anthracene oil.7. Secondary Baking:The impregnated anodes are subjected to a second baking process to further stabilize the pitch and achieve the desired electrical properties.8. Surface Treatment:The anodes are often surface-treated with a protective coating or sealant to enhance their performance and durability in the electrolysis cell.中文回答:预焙阳极的生产工艺。

预焙阳极灰份对铝电解生产的影响及有效控制途径摘要:本文系统探讨了预焙阳极灰份对铝电解生产影响,并针对预焙阳极生产中灰份的来源及构成,进行了较全面的量化分析,密切结合中铝青海A铝厂实际生产状况,提出了具体有效的控制措施。
关键词:预焙阳极、灰份、电解影响、控制途径作为铝电解用预焙阳极关键理化指标之一——灰份含量的控制日益受到铝电解生产企业的重点关注。
随着国内外铝电解行业对炭素预焙阳极灰份试验与研究的逐步深入,已经取得了一些对实际生产具有指导意义的结果,但国内众多生产企业对这些成果转化与运用的水平却参差不齐。
以中铝青海A铝厂为例,自1987年建成投产以来,由于对阳极灰份的研究与实际的转化运用存在不足,生产中阳极灰份的有效控制进步不大,所幸的是现在该厂已经逐步深入开展了预焙阳极灰份专题研究项目,并总结了一些行之有效的控制方法,值得国内同行交流与参考。
1 灰份杂质对铝电解生产的影响生产过程中原料、残极等所携带的灰份杂质,对电解原铝质量、阳极净耗、毛耗、电流效率、电解槽操作工艺、阳极外观质量及其理化性能等经济技术指标都有着直接影响,所以许多国家对预焙阳极灰份中的微量元素含量特别重视,并把它限制在1×10⁻⁶级的限度[1]。
因此,加强对预焙阳极灰份含量有效控制,在炭素及电解铝生产行业具有重大实际生产意义。
国外文献指出,在实际生产中,影响阳极在电解槽中使用性能的灰份微量元素见表一[2]。
表1 石油焦中影响阳极在电解槽中行为的主要元素表元素典型值金属性能阳极消耗电流效率污染S %0.5~3.5 ●H %0.05~0.1 ●Si ppm 50~250 ●Fe ppm 50~400 ●Ti ppm 5~10 ●Pb ppm 1~10 ●●Ni ppm 50~220 ●●V ppm 30~350 ●●Na ppm 20~120 ●K ppm 5~10 ●Ca ppm 20~100 ●P ppm 1~10 ●1.1 灰份杂质对预焙阳极氧化反应的催化与反催化作用:不同灰份杂质元素在预焙阳极中的含量不同,所起到的催化活性也有较大差异。
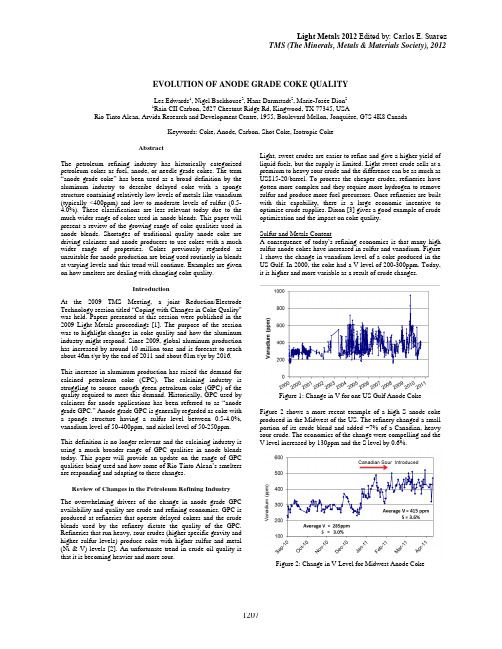
EVOLUTION OF ANODE GRADE COKE QUALITYLes Edwards1, Nigel Backhouse2, Hans Darmstadt2, Marie-Josée Dion21Rio Tinto Alcan, Arvida Research and Development Centre, 1955, Boulevard Mellon, Jonquière, G7S 4K8 Canada Rain CII Carbon, 2627 Chestnut Ridge Rd, Kingwood, TX 77345, USAKeywords: Coke, Anode, Carbon, Shot Coke, Isotropic CokeAbstractThe petroleum refining industry has historically categorized petroleum cokes as fuel, anode, or needle grade cokes. The term “anode grade coke” has been used as a broad definition by the aluminum industry to describe delayed coke with a sponge structure containing relatively low levels of metals like vanadium (typically <400ppm) and low to moderate levels of sulfur (0.5-4.0%). These classifications are less relevant today due to the much wider range of cokes used in anode blends. This paper will present a review of the growing range of coke qualities used in anode blends. Shortages of traditional quality anode coke are driving calciners and anode producers to use cokes with a much wider range of properties. Cokes previously regarded as unsuitable for anode production are being used routinely in blends at varying levels and this trend will continue. Examples are given on how smelters are dealing with changing coke quality.IntroductionAt the 2009 TMS Meeting, a joint Reduction/Electrode Technology session titled “Coping with Changes in Coke Quality” was held. Papers presented at this session were published in the 2009 Light Metals proceedings [1]. The purpose of the session was to highlight changes in coke quality and how the aluminum industry might respond. Since 2009, global aluminum production has increased by around 10 million tons and is forecast to reach about 46m t/yr by the end of 2011 and about 61m t/yr by 2016. This increase in aluminum production has raised the demand for calcined petroleum coke (CPC). The calcining industry is struggling to source enough green petroleum coke (GPC) of the quality required to meet this demand. Historically, GPC used by calciners for anode applications has been referred to as “anode grade GPC.” Anode grade GPC is generally regarded as coke with a sponge structure having a sulfur level between 0.5-4.0%, vanadium level of 50-400ppm, and nickel level of 50-250ppm. This definition is no longer relevant and the calcining industry is using a much broader range of GPC qualities in anode blends today. This paper will provide an update on the range of GPC qualities being used and how some of Rio Tinto Alcan’s smelters are responding and adapting to these changes.Review of Changes in the Petroleum Refining IndustryThe overwhelming drivers of the change in anode grade GPC availability and quality are crude and refining economics. GPC is produced at refineries that operate delayed cokers and the crude blends used by the refinery dictate the quality of the GPC. Refineries that run heavy, sour crudes (higher specific gravity and higher sulfur levels) produce coke with higher sulfur and metal (Ni & V) levels [2]. An unfortunate trend in crude oil quality is that it is becoming heavier and more sour. Light, sweet crudes are easier to refine and give a higher yield of liquid fuels, but the supply is limited. Light sweet crude sells at a premium to heavy sour crude and the difference can be as much as US$15-20/barrel. To process the cheaper crudes, refineries have gotten more complex and they require more hydrogen to remove sulfur and produce more fuel precursors. Once refineries are built with this capability, there is a large economic incentive to optimize crude supplies. Dixon [3] gives a good example of crude optimization and the impact on coke quality.Sulfur and Metals ContentA consequence of today’s refining economics is that many high sulfur anode cokes have increased in sulfur and vanadium. Figure 1 shows the change in vanadium level of a coke produced in the US Gulf. In 2000, the coke had a V level of 200-300ppm. Today, it is higher and more variable as a result of crude changes.Figure 1: Change in V for one US Gulf Anode Coke Figure 2 shows a more recent example of a high S anode coke produced in the Midwest of the US. The refinery changed a small portion of its crude blend and added ~7% of a Canadian, heavy sour crude. The economics of the change were compelling and theV level increased by 130ppm and the S level by 0.6%.Figure 2: Change in V Level for Midwest Anode Coke2012 Edited by: Carlos E. Suarez TMS (The Minerals, Metals & Materials Society), 2012The above phenomenon is global and has been underway for some time [4]. The trend of increasing sulfur and metals levels in high sulfur cokes is compounded by a general lack of low sulfur coke. The availability of low sulfur, low metals coke is now a critical problem for the industry. The trends in crude oil production and refining do not support any significant growth in low sulfur coke production. However, the industry needs more of this coke to offset the rising sulfur and metals levels in other cokes.GPC Quality ChangesToday, calciners are using a much wider range of GPC qualities in anode blends. The most obvious difference is the greater range of sulfur and vanadium levels. Figure 3 illustrates this and shows the range of S and V levels in GPC used by Rain CII in the US in anode blends in 2000 compared to 2011. The size of each circle is proportional to the volume of coke and the center points are the Sand V levels.Some of the cokes shown in Figure 3 cannot be referred to as “anode grade GPC” using the definition given earlier in this paper. Some people use terms like Traditional Anode Coke (TAC) and Non-Traditional Anode Coke (NTAC) but this terminologycan be confusing. In this paper, the higher S and V level cokes will simply be referred to as “marginal quality” cokes.The difference in quality goes beyond V and S differences as shown in Table 1. All the cokes in Table 1 are used in anode blends today and although the range of qualities is broad, it is comparable to those reported with Russia cokes [5]. Cokes A-F have been used as anode cokes for over 30 years. The sulfur and vanadium level of cokes D and E have changed significantly over time and these are the cokes shown in Figure 1 and 2. The next two cokes, G and H have been used in anode grade coke blends for at least 15 years and they are also regarded as good quality anode cokes, albeit with higher impurity levels. Cokes I-K have been introduced in anode blends in the last two years and are good examples of marginal quality cokes.Some cokes have higher VM (volatile matter) contents and HGI’s (Hardgrove Grindability Index) span a much wider range. A lower HGI means the coke is harder. A coke with a high VM content and high HGI is softer and typically finer in particle size whichcreates problems during calcining and is less desirable for anode applications.Table 1: GPC QualityGreen Coke VM ContentAnother undesirable trend in GPC quality is a steady increase in VM content. Higher VM coke arises when a refinery increases the throughout rate in the delayed coker for economic and process reasons. Higher feed rates are often achieved by reducing the coker cycle time and they make it more difficult to maintain coker furnace outlet temperatures. Both of these factors reduce the coking severity and increase the VM in the coke. Figure 4 shows the weighted average VM of cokes used by Rain CII since 2002.Figure 4: Trend in Average VM ContentIn addition to being more difficult to calcine, higher VM GPC leads to more porosity in CPC and a lower VBD. The VBD trend at three rotary kiln calciners using a wide range of cokes over the last 10 years is shown in Figure 5. Results are shown for samples prepared to 8x14 mesh (1.18-2.36mm) but the trends are similar for samples prepared to other sizes. Shaft calciners deal much better with high VM cokes [6].Figure 5: Coke VBD Trend (8x14 Mesh)20112000Figure 3: S and V Level of GPC Sources in 2000 & 2011Coke Structure and TextureAnother difference, not obvious in Table 1, is coke structure. Historically, the aluminum industry has used CPC with a “sponge” structure. The three common structural forms of coke produced in a delayed coker are: needle, sponge and shot. Needle coke looks similar to sponge coke in terms of porosity but it has a layered structure which is generally referred to as an “anisotropic” structure or texture. Needle coke is a premium product used in graphite electrodes for electric arc furnaces. It has a low sulfur content (<0.5%) and a low CTE (coefficient of thermal expansion).Shot coke has a very different physical form to needle coke and sponge coke and has been well described previously [7]. When samples of these coke types are examined under an optical microscope using polarized light, the structures or textures look very different [8]. Shot coke has a very fine texture referred to as an “isotropic” texture. It is quite different to the layered texture in needle coke as shown in Figure 6.Coke I in Table 1 has a very isotropic texture but it is not shot coke. A scanning electron microscope image of the particles is shown in Figure 7 alongside shot coke. Coke I is very unusual in this respect and quite unique.Figure 7: Shot coke and Coke IFuel Grade vs. Anode GradeIn addition to classifying cokes as needle, sponge and shot, another classification in common use is needle grade, anode grade and fuel grade. The difference between needle coke and the other grades is obvious but there is no longer a clear distinction between anode and fuel grade coke. Any coke used in fuel applications (e.g. power generation, gasification or in cement kilns) is broadly classified as fuel grade coke. Fuel grade coke is usually higher in sulfur and vanadium but can have a sponge or a shot structure. Fuel grade coke is typically classified by sulfur level and HGI; lower HGI values imply a higher shot content. Cokes I-K havehistorically been used in fuel applications but today, they are used in both fuel and anode applications.Coke Real DensitiesAlthough it is not shot coke, Coke I shares many characteristics with shot coke. After calcination, the coke shows the following properties relative to sponge coke: it is harder; it has a higher CTE; it has a higher bulk density and a lower macro-porosity; it has a higher micro-porosity and an unusually low real density. Figure 8 shows the real density (RD) versus temperaturerelationship for several of the cokes in Table 1.Figure 8: Temperature vs. Real Density DataMost low sulfur (<3%) sponge cokes (e.g. coke B) show a steady increase in RD as the calcination temperature is increased. Isotropic cokes show a much lower RD at a given temperature and only a small increase with temperature. This is a consequence of their fine texture and high degree of cross-linking. The result is a dense, high strength structure with low macro-porosity but a higher level of micro-porosity. This micro-porosity is not removed when the sample is ground to -75 micron for the RD test.The pore size distribution curves in Figure 9 were generated with a high pressure mercury porosimeter. The micro-porosity of coke I is evident below a pore size of ~0.01µm. The lower level of macro-porosity in the 1-100 µm range for coke I relative to thetwo sponge cokes, coke B and coke E, is also evident.Figure 9: Mercury Intrusion Porosimetry ResultsAnother phenomenon evident from Figure 8 is the reduction in RD that occurs with high sulfur cokes when the calcination temperature is raised above 1250o C. This is due to thermal desulfurization which has been described previously [9]. The implications of this are as follows. When high sulfur cokes are used in blends with isotropic cokes, it can be difficult to achieveFigure 6: Anisotropic needle coke and isotropic shot cokehigh RD levels (>2.06 g/cm³). It is not possible to raise the average RD of such a blend by raising the temperature. The RD of the isotropic cokes stays low and the RD of the high sulfur cokes drops due to desulfurization as shown for cokes D, E and J in Figure 8.Desulfurization is undesirable and negatively affects coke properties. Calcining at a lower average temperature avoids this problem and “under-calcined” coke (UCC) can be beneficial to anode performance [10]. Rio Tinto Alcan adopts this strategy at several smelters. In addition to reducing the risk of desulfurization during calcination, UCC also results in less anode CO 2dusting. Using RD to monitor the level of calcination can be misleading when using high sulfur cokes and isotropic cokes. Two alternative tests are the coke Lc test and specific electrical resistivity test. Both tests are unaffected by desulfurization and are less sensitive to coke structure. Lc data for the cokes in Figure 8 is shown in Figure 10. All cokes show a linear response to temperature whichmakes it easier to judge calcination levels.Figure 10: Coke Lc vs Temperature DataImplications of Changes in Coke QualityThe impact of coke quality changes on selected Rio Tinto Alcan smelters using some of the Rain CII cokes presented above is discussed below.Susceptibility To Anode CrackingAnode CTE increases with increasing concentration of isotropic coke [8] and this can increase the risk of anode cracking. Anticipating a rise in the concentration of isotropic coke, Rio Tinto Alcan performed a lab study in 2009 on reducing the susceptibility of anode cracking. The cracking risk of anodes can be reduced by using a higher grain/sand (G/S) ratio in the aggregate [11].Anodes were manufactured with different concentrations of the highly isotropic coke I and different G/S ratios. Following an approach described in [12], the resistance to crack initiation and propagation was determined. The results can be summarized as follows. With increasing concentration of coke I, the anodes became more susceptible to crack initiation and propagation, Figure 11. At low concentrations of coke I (0 and 15%), increasing the G/S ratio slightly increased the resistance to crack propagation. However, at the same time, crack initiation was facilitated. Nevertheless, the values remained in an acceptable range. The situation was different for anodes made with 30% coke I. Here, increasing the G/S ratio strongly increased the resistanceto crack propagation without affecting crack initiation. Thus, at elevated concentrations of isotropic coke, using a high G/S ratio makes anodes less susceptible to cracking.During the last several years, Rio Tinto Alcan’s paste plants increased their G/S ratios. Furthermore, anode slots were introduced, which also makes anodes more resistant to cracking. Thus, Rio Tinto Alcan had confidence that a certain concentration of isotropic coke could be tolerated in anode blends.The concentration of isotropic coke in green and calcined coke sources is regularly analyzed. In routine analyses, a simplified method similar to the one described in [8] is used. The concentration of isotropic textures varies considerably. Most sources contain 5–15 % isotropic textures. However, some sources have considerably higher concentrations, such as coke I which is represented by the far right point in Figure 12.The concentration of isotropic textures in some coke sources is also highly variable. This is shown in Figure 13 for green coke F. The refinery producing this coke historically operated with a stable crude blend but it now changes crude blends on a regular basis which causes the coke quality to vary. Coke F is a significant Rio Tinto Alcan green coke source. Quality changes in this coke strongly influence the quality of the overall blends at some Rio Tinto Alcan paste plants. At the end of 2010, when coke600010000140001800022000150175200225250Resist. Crack Initiation, Rk [°C]R e s i s t . C r a c k P r o p a g a - t i o n (R s t ) [°C m 0.5]Figure 11 Impact of the concentration of isotropic coke andG/S ratio on thesusceptibility to anode cracking051020406080100Isotropic Texture [%]F r e q u e n c y [-]Figure 12: Concentration of isotropic textures in 32 green andcalcined coke sources analyzed by Rio Tinto AlcanF contained ~60 % of isotropic textures, the blend at the Alma smelter contained ~20 % isotropic textures. During this period, neither a significant increase in anode CTE, nor an increase in anode problems (including cracking) was observed, Figure 14. In 2008, however, the smelter experienced an anode crisis, which was not associated with isotropic coke.Due to a power failure, a P155 pot line at the Latterière smelter had to be shut down in July 2010. The pot line was restarted in the following three months with anodes from the Grande-Baie smelter without significant problems. At this time, the Grande-Baie blend contained ~23% isotropic coke. In summary, Rio Tinto Alcan’s experience is that ~20 % isotropic coke can be tolerated in anodes.Anode density is generally believed to correlate with coke bulk density [13]. Decreasing coke bulk density puts pressure on paste plants that have to increase or at least maintain anode densities. Consequently, considerable work has been done on increasing anode density which has offset the impact of decreasing coke density. Anode DensityAs an example, the trends in coke VBD and baked anode density (BAD) at Rio Tinto Alcan’s Grande-Baie smelter are presented in Figure 15. During the last five years, the VBD has been quite variable and, on average, decreased slightly. In spite of this it waspossible to increase the BAD and keep the variation small. The BAD increase in late 2007 was due to the installation of a so-called “coke separator.” This equipment separates coke according to its bulk density. Low-density particles are milled and used in the fines fractions, whereas high-density particles are used in the coarse and medium fractions [14]. The coke separator also decreased the BAD variability, especially when the coke VBD changed strongly. In addition to the coke separator, several continuous improvement projects focused on the BAD [15].SO 2 EmissionsThe SO 2emissions at smelters are driven by the coke sulfur content. As the sulfur level of some of Rio Tinto Alcan’s cokes has increased, compliance with environmental limits has been achieved by procuring low sulfur cokes for blending. However, some low sulfur cokes have low VBD’s. The ability to produce anodes with a reasonable BAD even with blends containing low-VBD coke allows Rio Tinto Alcan to use such cokes. Technology does exist to scrub SO 2from potroom gases and some smelters do this already. It is very expensive to retrofit however, and is typically not a viable solution for a smelter facing a sulfur increase in their CPC supply. Metal PurityMost of the trace metal impurities in coke such as vanadium and nickel report to the aluminum. Increasing V and Ni levels therefore presents a challenge for maintaining metal purity specifications. This can be mitigated by blending in low metals cokes but this approach only works if there is a readily available supply of low sulfur/low metals coke which is not the case today.Another solution to this problem is to remove impurities from the aluminum metal. The technology to remove vanadium from metal for electrical applications exists and is widely used. The limits for V removal are not well known however and there is no equivalent technology for removing impurities such as nickel. Another approach which is attracting growing interest, is the possibility of relaxing some metal purity specifications [16].Anode OxidationAnother potential concern for smelters with rising V levels is anode airburn. Vanadium is a catalyst for the ignition and burning of carbon in air. This is not a significant problem for modern cell designs where anodes can be well-covered. As long as oxygen access is limited, airburn can be controlled. It can be more20406080Jan-07Jan-09Jan-11DateI s o t r o p i c T e x t u r e s [%]Figure 13: Concentration of isotropic textures in a Rio TintoAlcan green coke source (Coke F) 4.04.44.8Jan-07Jan-09Jan-11DateA n o d e C T E 10-6[-]12345A h e a d o f S c h e d u l e A n o d e s [%]Figure14: Anode CTE and portion of anodes changed ahead ofschedule at Rio Tinto Alcan’s Alma smelterJan-07Jan-09Jan-11DateD e n s i t y C h a n g e [g /c m ³]Figure 15: Change in coke VBD and BAD at Grande-Baieproblematic to keep anodes well-covered in older cell designs and cover practices and operator consistency plays a key role.OutlookThe trend towards greater use of heavy, sour crudes will continue and the situation with anode grade coke availability is not expected to improve. One of the most significant problems today is the lack of low sulfur coke. Since 2008, North America has lost over 0.5 million tons of low sulfur anode grade coke. A good example is the loss of ~300,000 tons of Western Yorktown coke after the refinery was shut down for economic reasons in 2009. The world is already short of low sulfur coke and as demand from the aluminum industry grows, it is hard to see where enough low sulfur coke will come from in the future. As existing supplies of high sulfur anode GPC get higher in S and V, the need for more low S coke to counteract these changes increases. Most of the marginal quality cokes are even higher in S and V.Brazil is expected to produce additional low S coke in the future. Some forecasts estimate additional production of 3-5 million tons by 2020. Several new refineries are planned and these will use the Marlim crude that produces a good low S (<1%) coke. One of the challenges however, is competition from the Brazilian steel industry which already uses ~30% of Brazil’s low S coke as a substitute for imported metallurgical coke.China also produces significant quantities of low S GPC but as their appetite for petroleum fuels increases, they are importing more heavy sour crude. This is already having an impact on sulfur and vanadium levels in GPC in some regions.One implication of the lack of low sulfur coke is an increase in price. This is already occurring and low sulfur GPC now commands a substantial premium price relative to high sulfur GPC. Anode grade GPC prices increased significantly in 2007-2008, decreased during the 2009 recession, and have increased again substantially since 2010. This is driving up smelter carbon costs. Carbon costs have been in the range of 7-8% of total smelter costs historically but this is now increasing to levels above 10%.These developments present both a challenge and an opportunity for the aluminum industry. The short supply of low sulfur GPC means this product will continue to attract a price premium which is passed onto the smelters. Smelters that can utilize coke with higher S and V levels will be able to procure lower cost CPC in the future.ConclusionsThis paper has shown that the definition of anode grade GPC is less relevant in a world where marginal quality GPC is being used in anode coke blends. If a marginal quality coke is being used in an anode blend, should it be classified as an anode grade coke? The range of GPC qualities used today may surprise some readers.A key learning from this is that anode quality and performance is probably more robust than we think. Past beliefs about which GPC can and cannot be used in anode blends is being challenged. Many different cokes are already being used successfully including highly isotropic cokes. A logical extension of this would say that shot coke can be used in anode blends as well. A significant advantage of using cokes like this is that they are readily available and cheaper than higher quality GPC.In a world of rapidly increasing carbon costs, the use of cheaper alternatives becomes more attractive. Most of these cheaper alternatives come with higher sulfur, vanadium and nickel and in some cases, more isotropic structures. This is the biggest challenge the industry will face. There is no shortage of GPC; the world produced ~123m tons in 2011. The calcining industry only uses about 25% of the GPC produced and as long as smelters can adapt to higher sulfur and metals levels, there is more than enough GPC for any conceivable increase in global aluminum production.References1."Coping with Changes in Coke Quality", Light Metals,2009, 971-1011.2. B. Vitchus, F. Cannova, H. Childs., "Calcined coke fromcrude oil to customer silo", Light Metals, 2001, 589-596.3.T. W. Dixon., "US Refining Economics – A Model BasedApproach", Light Metals, 2009, 941-944.4. F. Vogt et al., "A preview of anode coke quality in 2007",Light Metals, 2004, 489-493.5.V. Y. Buzunov et al., "Quality of Russian PetroleumCokes for Aluminum Production", Light Metals, 2009,927-934.6.L. Edwards., "Quality and Process Performance of RotaryKilns and Shaft Calciners", Light Metals, 2011, 895-900.7.L. Edwards et al, "Use of Shot Coke as an Anode RawMaterial", Light Metals, 2009, 985-990.8.K. Neyrey et al., "A Tool for Predicting AnodePerformance of Non-Traditional Calcined Cokes", LightMetals, 2005, 607-612.9.L. P. Lossius, K. J. Neyrey, L. C. Edwards., "Coke andAnode Desulfurization Studies", Light Metals, 2008, 881-886.10.J.Lhuissier et al., “Use of Under-Calcined Coke for theProduction of Low Reactivity Anodes”, Light Metals, 979-983.11.J. G. Ameeri, C. Dreyer, B. Samanos., "An approach for acomplete evaluation of resistance to thermal shock. II.Applying to the solution of an industrial problem at Alba",Light Metals, 1997, 591-596.12. C. Dreyer, B. Samanos., "An approach for a completeevaluation of resistance to thermal shock. I. Applying tothe case of anodes and cathodes", Light Metals, 1997, 585-590.13. D. Belitskus, D. J. Danka., "A ComprehensiveDetermination of Effects of Calcined Petroleum CokeProperties on Aluminum Reduction Cell AnodeProperties", Light Metals, 1989, 429-442.urin, P. et al., "Coke Separation Process in Paste Plant",US Patent 7,987,992, 2011.15.Higley, J. P., Bourgier, A., and Tremblay, S. "MaximisingVibroformer Performance Through Vibration Monitoring",10th Australasian Aluminium Smelting TechnologyConference, Launceston, Tas., Australia, 2011.16.Grandfield, J. F et al., "Metal Quality and Management ofRaw Material Impurities in Cast House", 10th AustralasianAluminium Smelting Technology Conference,Launceston, Tas., Australia, 2011.。

冶金冶炼M etallurgical smelting高抗氧化性预焙阳极对铝电解的积极作用何 川(贵阳铝镁设计研究院有限公司,贵州 贵阳 550018)摘 要:阳极是铝电解槽的心脏,其质量的优劣直接影响到电解槽的工艺技术条件和技术经济指标;随着铝电解技术的不断发展与完善,预焙炭阳极质量对铝电解生产的重要性日益凸显;高抗氧化性预焙阳极能够为铝电解企业带来诸多优势,对铝电解有着积极的推动作用。
关键词:预焙阳极;抗氧化性;炭渣;电解槽中图分类号:TF821 文献标识码:A 文章编号:1002-5065(2020)06-00012-2Positive effect of high oxidation resistance prebaked anode on aluminum electrolysisHE Chuan(Guiyang Aluminum Magnesium Design & Research Institute Co., Ltd,Guiyang 550018,China)Abstract: Anode is the heart of aluminum cell, and its quality has a direct impact on the technological conditions and technical and economic indicators of the cell; with the continuous development and improvement of aluminum electrolysis technology, the quality of prebaked carbon anode is increasingly important for aluminum electrolysis production; high oxidation resistance prebaked anode can bring many advantages to aluminum electrolysis enterprises, which has a positive impact on aluminum electrolysis effect.Keywords: prebaked anode; oxidation resistance; carbon slag; electrolytic cell近年来,我国电解铝工业无论是在产量上还是在装备技术水平上都得到了长足的发展,至2018年末,我国电解铝产能已经达到了约3600万吨。
中国与西方铝用阳极质量差距原因分析沈阳铝镁设计研究院孙毅许海飞摘要:目前,国内用于大型铝电解槽的预焙阳极质量与西方先进铝厂相比存在着比较大差距。
这主要是由于在基本生产理论研究、预焙阳极生产工艺的控制过程、预焙阳极生产过程的检测、分析手段及其方面的差异导致的结果。
关键词:预焙阳极;质量;工艺控制;理论研究;The Analysis of Prebaked Anode Quality GapBetween Chinese and Western SmelterAbstract: At present, there are a relative gap in prebaked anode quality for high capacity pot between Chinese and western smelter. The process control, testing and analysis of means and basic theoretical research of the anode fabrication process lead to this kind of result.Key words: prebaked anode; quality ; process control ;theoretical research;1 前言随着近年来国内铝电解技术的迅速发展,我国大型铝电解企业配套的阳极工厂生产技术已经取得了长足的进步,尤其是随着大量现代化预焙阳极生产设备的引进,国内大型铝厂在铝用阳极生产的技术装备方面已经达到了世界先进水平。
但是目前预焙阳极的生产技术却要明显落后于大容量铝电解技术的发展速度。
与西方先进铝厂使用的预焙阳极相比,由于在阳极的生产系统理论知识详细研究、预焙阳极生产原料控制技术、生产工艺过程关键参数控制、预焙阳极的检测与分析技术等方面存在着比较大的差距,结果造成了国内大多数铝厂使用的预焙阳极质量与国外先进铝厂预焙阳极质量之间的差异。
7冶金冶炼M etallurgical smelting铝电解预焙阳极防氧化涂层材料的性能检测研究王博一湖南博溥立材料科技有限公司,湖南 常德 415900摘 要:本文针对纳米陶瓷基阳极防氧化涂层材料工业应用的特点,设计了该涂层材料的实验室性能检测流程,并对检测流程的各个步骤进行了详细说明及原因分析,确定了纳米陶瓷基阳极防氧化涂层材料检测的评判标准。
关键词:铝电解;阳极防氧化;纳米陶瓷基;涂层材料;性能检测中图分类号:TF821 文献标识码:A 文章编号:1002-5065(2024)02-0007-3Study on performance testing of anti-oxidation coating materials of pre-baked anode for aluminum electrolysisWANG Bo-yiHunan Bable Material Technology Co., Ltd.,changde 415900,ChinaAbstract: In this paper, according to the characteristics of industrial application of nano-ceramic-based of anode anti-oxidation coating material, the laboratory performance testing process of the coating material is designed, and each step of the testing process is explained in detail and the reasons are analyzed, and the evaluation criteria for the detection of nano-ceramic-based of anode anti-oxidation coating material is determined.Keywords: aluminum electrolytic; anode anti-oxidation; nano-ceramic-based; coating material; performance test收稿日期:2023-12作者简介:王博一,生于1983年,男,高级工程师,研究生,从事铝电解节能及铝用阳极涂层保护技术的研究工作。
研究与开发化 工 设 计 通 讯Research and DevelopmentChemical Engineering Design Communications·156·第44卷第11期2018年11月1 粉料对预焙阳极质量的影响1.1 粉料含量对预焙阳极质量的影响通过大量生产数据的统计发现,不同厂家的石油焦物料的粒度分布、各粒级物料纯度、颗粒强度等指标有着明显的差异,在配方不变的情况下生产的阳极各项质量指标差异较大。
总体来说,粉料含量较高的煅后焦比粉料含量较低的煅后焦在生产中各项指标较差,主要表现在各粒级干料纯度、粉料含量和布林值的对应关系,干料混合样振实容重、颗粒强度、粉末电阻率、沥青需求量和对应的生坯体积密度等指标的差异。
1.2 粉料细度对预焙阳极质量的影响以往预焙阳极生产中,主要使用纯度筛分法,但是无法对粉料的细度分布情况、分子布林值作出定量评价。
如果将这些粉料直接投入使用,可能会对最终的阳极质量产生影响。
因此,在粉料筛选时,必须要关注细度对阳极质量的影响。
为了将分子布林值控制在标准范围之内,一种有效的方法是调整沥青用量,沥青的掺加量会直接影响阳极的密度和空气渗透性。
当阳极的空气渗透性维持在较低值时,阳极与空气接触后发生氧化反应的速率也会受到影响,从而减缓了阳极氧化的速度,对于稳定电解工艺参数、保证铝电解槽的平稳运行也有一定帮助。
需要注意的是,根据阳极生产工艺参数的不同,对粉料细度的要求也有一个参考范围。
如果生产厂家过度追求粉料细度,还会增加糊料的黏性,可用粉料减少,变相的增加了阳极生产过程中粉料的用量,不仅增加了生产成本,而且也不利于增强阳极的硬度。
如果生产过程中发现糊料的黏性过大,可以通过适当增加温度的方式,在高温环境下让糊料和粉料混捏,以达到降低糊料黏性的目的。
2 预焙阳极过程中粉料质量的控制措施2.1 石油焦质量控制阳极生产企业所用的石油焦,主要来源于焦化厂。
预焙槽阳极压降影响因素研究张报清雷霆*余宇楠姚春玲龙晓波(昆明冶金高等专科学校,昆明,650031)摘要:针对我国铝电解吨铝电耗高的现状,以186kA系列电解槽阳极为研究对象,对阳极压降、回路压降和槽工作电压进行了理论计算,分析了影响阳极压降过高的因素。
研究结果表明:回路压降约占槽工作电压23%;阳极压降约占回路压降41%;阳极压降理论计算值为391.15mV;影响阳极压降的主要因素是钢-炭压降和阳极炭块压降,次要因素是铝-钢爆炸焊压降和阳极钢爪压降;降低阳极压降有一定潜力。
阴极压降占回路压降的比重也较大,降低阴极压降也有一定潜力。
对于300kA以上大型预焙槽,应该运用阳极理论压降放大准则进行研究与分析。
关键词:铝电解;预焙槽;阳极;电压降;节能降耗Study of Anode Voltage Drop Affecting Factors of Pre-baked CellZHANG Bao-qing LEI Ting﹡YU Yu-nan YAO Chun-ling LONG Xiao-bo(Kunming Metallurgy College,Kunming 650031,China)ABSTRACT:According to the present situation of aluminium electrolytic high power consumption,anode voltage drop,circuit voltage and working voltage have been theoretically calculated on 186kA series aluminium electrolytic cell anode. The factors influencing anode voltage too high have been analysed.The results show that, circuit voltage drop takes about 23 percentage of the working voltage, and anode voltage drop takes about 41 percentage of the circuit voltage drop; The calculation value of anode voltage drop is about 391.15mV; The main factors influencing anode voltage too high are steel-carbon voltage drop and carbon block voltage drop,the secondary factors are explosive welding voltage drop and steel stub voltage drop;It is feasible to reducing anode voltage drop.Cathode voltage drop also has a big accounts of circuit voltage drop,it is feasible to reducing cathode voltage drop.It is better to use rule of amplification taking a research and analysis of more than 300kA series prebaked aluminium reduct ion cells’ anode voltage drop.KEY WORDS:aluminum electrolysis; pre-baked cell; anode;voltage drop; energy conservation目前,我国电解铝工业取得的成果是:产能快速增长,布局调整稳步推进,消费量显著增加,落后产能淘汰,计算机控制和新材料研发;存在的问题是:产能过剩,行业内竞争激烈,铝锭成本加大和节能减排任务艰巨[1]。
EFFECTS OF PHYSICAL PROPERTIES OF ANODE RAW MATERIALS ON THE PASTECOMPACTION BEHAVIORKamran Azari1, Hany Ammar1, Houshang Alamdari1,2, Donald Picard1,2, Mario Fafard2, Donald Ziegler31 Department of Mining, Metallurgical and Materials Engineering, 1065 avenue de la MédecineLaval University, Quebec, QC, G1V 0A6, Canada2 NSERC/Alcoa Industrial Research Chair MACE3 and Aluminum Research Center – REGALLaval University, Quebec, QC, G1V 0A6, Canada3 Alcoa Canada Primary Metals, Aluminerie de Deschambault, 1 Boulevard des Sources,Deschambault-Grondines, QC, G0A 1S0, CanadaKeywords: Anode paste, Formulation, Compression behavior, Particle size, Particle shapeAbstractThe current study investigates the effects of coke particle characteristics and paste formulation on the flowability and the compression behavior of anode pastes. Shape factor and texture of different fractions of cokes were characterized using an image analysis system where the characteristics of each coke were correlated to its vibrated bulk density (VBD). A compression test was designed to study the effects of particle characteristics and paste recipe on the compactability of pastes. The test was applied on four anode pastes, prepared from different coke types, particle size distributions and pitch contents. It was observed that the compression test is significantly sensitive to any changes in raw materials characteristics and formulations. Consequently, the compression test may be used as a tool for evaluating anode quality in relation with material variations.IntroductionConsistent high quality anodes are a basic requirement of anode plants. Anode properties are influenced by several factors including raw materials properties, anode formulation and anode making parameters. Variations in raw materials properties are considered as one of the most significant challenges in anode manufacturing industry which affect anode quality and consistency. The influences of coke properties, particle size and distribution in the anode formulation have been reported by several authors [1-4]. Such an enormous number of variables involved in anode manufacturing process makes difficult the control and optimization of the final anode quality. Thus intermediate quality indices are required to control each step of the process and to take the corrective actions within the subsequent steps in order to keep the anode quality consistent.G reen and baked anode properties are conventionally used as indicators of anode quality. Green anode density and permeability are measured as quality indices. However, these indices are still influenced by a number of variables including raw materials properties and mixing and compaction parameters. By defining specific paste quality as an intermediate process quality index, it would be possible to limit the number of variables to be controlled in the subsequent manufacturing steps. These indices would be used to correlate materials properties, paste formulation and mixing factors with anode properties. These paste indices could also be used as indicators for paste compaction behavior for the purpose of modelling the anode forming, fabricated either by hydraulic pressing or by vibro-compaction. In the current research study, a compression test was used to study the paste compression behavior. Sensitivity of this test to variations in materials and formulations was evaluated. When using this specific test, it is possible to investigate the effects of coke type, particle size distribution and formulation on the formability of paste. In addition, shape factor and texture of coke particles were measured using an image analysis system to investigate the influence of coke particles characteristics on their flowability and compaction behavior.Experimental proceduresTwo commercially available calcined petroleum cokes and a coal tar pitch were used as raw materials for anode manufacturing. The cokes used were Conoco coke (A) and ZCGG coke (B) with a real density of 2.075 g/cm3 and 2.063 g/cm3, respectively, and with a chemical composition, as shown in Table I. The softening point of pitch was 109°C and its quinoline insoluble content was 15.5%. The cokes were crushed using jaw and roll crushers and sieved to seven size fractions. Four formulations were prepared with different particle size distributions, as listed in Table II, to reveal the effect of size distribution. Particle size distributions consisted of a reference distribution, which is used in the industry, and two other distributions; one with 5% more large aggregates and the other with 5% more fine particles than reference. In addition, one formulation of coke B with reference granulometry was used to reveal the effect of particle properties in different coke types. The coke types and coke/pitch ratios are listed in Table III. Pitch contents were chosen based on the fine fraction in the formulation. Large amount of fine particles increases the specific surface area of coke particles and consequently for wetting these fine particles, a higher content of pitch is required.Table I. Chemical composition of Conoco (A) andZCGG (B) cokesCokeNappmSippm%SCappmVppmFeppmNippm Conoco <50 10 1.1 130 120 70 90 ZCG G<50 20 3.2 <10 260 60 150Vibrated bulk density (VBD) was measured for four fractions of cokes A and B, and the blended coke fractions, to study the effects of coke particle characteristics on their packing behavior. ASTM D-4292 standard test method [5] with vibration time of 2 minutes was used for VBD tests.Light Metals 2011 Edited by: Stephen J. Lindsay TMS (The Minerals, Metals & Materials Society), 2011Table II. Particle size distribution of pastesParticle size (mesh) Reference size 5% More fine 5% More large +6 13.6% 12.8% 14.4% -6+14 15.6% 14.8% 16.4% -14+30 16.3% 15.4% 16.9% -30+50 10.4% 9.8% 11% -50+100 8.1% 7.5% 8.6% -100+200 10.5% 9.7% 10.7% -200 25.5% 30% 22% Table III. Coke type and pitch content of pastesReference size 5% More fine 5% More largeCoke A and B A A Pitch, wt% 13.8 15.813*Coke A: Conoco and coke B: ZCGGSingle coke fractions were impregnated by a polishing resin under mechanical vacuum and polished for microscopic analysis. In the current study, a Nikon Ephiphot optical microscope equipped with an image analysis system (Clemex, vision) was used to analyse the particles characteristics which include aspect ratio, compactness, roughness, sphericity, roundness and porosity. These parameters describe various aspects of a particle which may be correlated to packing and flow behavior of the particle. Based on the definitions of these parameters, given in Table IV, a more circular particle has lower aspect ratio and higher values for compactness and roundness. Higher values of roughness show smoother surface of the particle.A rigid steel cylindrical mold with the internal diameter of 89 mm was used to study the compression behavior of anode pastes. Coke fractions and pitch were preheated at 185°C for 120 and 30 minutes, respectively, and then were mixed at 185°C for 10 minutes using a domestic Hobart N50 mixer. The paste was then cooled to 125-130°C to allow the fumes to be escaped before pressing. Compression test was carried out at 130°C, using an MTS Servohydraulic press working at a constant displacement rate of 10 mm/min and a maximum force of 220 kN. The MTS machine provides displacement-force data at a rate of 10 readings per second. The apparent density of pressed samples was measured based on the final volume and mass. Having the final height of the sample and displacement rate of the punch during the test, the apparent density was calculated for each displacement value as a function of the applied force. The evolution of the paste density was then plotted as a function of applied pressure and presented in the form of pressure-density curves.A Micromeritics helium pycnometer (AccuPyc II 1340) was usedto measure the volume of green anode samples where a core sample, with a diameter of 2.5 cm, was drilled in each green sample for this purpose. The percentage of porosity in green samples could be determined using the green apparent density and pycnometry results.Results and discussionThe current section presents the results related to the effects of granulometry and particle properties on the flowability of the particles based on the results of vibrated bulk density tests. Compression behavior of anode paste then will be used to study the effects of size distribution and coke type on the compactability of the pastes and the utility of this test will be emphasized. The green apparent density and the vibrated bulk density results will be correlated to the measured porosity of the green samples. The vibrated bulk densities of blended coke fractions used to prepare the samples are shown in Figure 1. Bulk density of coke A has increased with reducing the large fractions (>300 μm) and increasing the fine portion (<74 μm) in the formulation. These results had been expected since the smaller particles fill the inter-particle voids without increasing the volume [6, 7]. It has also been reported by other authors [8] that higher amounts of fine particles, results in higher VBD of dust fraction and multi-fraction mixtures, up to a maximum value. In addition, the bulk density of particles increases with decreasing the particle size, because large pores are destroyed with size reduction [6]. Figure 1. Vibrated bulk density (VBD) of blended coke fractions With regard to blends of cokes A and B with reference particle size, it may be observed that they exhibit different bulk densities, as shown in Figure 1. This difference is an indication of the influence of physical properties of coke particles on the flowability and rearrangement during vibration. This different behavior may be related to irregularities on the particle surface which result in inter-particle friction and bridging of the particles. These effects will be elaborated in the following paragraph. Coke particles were characterized using an image analysis system to study the correlations which may exist between particle characteristics and their flowability. Table V shows the image analysis results and VBD for each coke fraction. Regarding coke A compared to coke B, for the same size range, it may be observed that vibrated bulk density of the particles increases with1.11.121.141.161.181.21.221.24Reference size-Coke B Reference size-Coke A 5% more large-Coke A 5% more fine-Coke AV i b r a t e d b u l k d e n s i t y (g /c m 3)lower values of aspect ratio; with lower level of porosity; and with higher values of compactness, roughness, sphericity and roundness. More spherical particles are expected to display better packing behavior and higher bulk density values than platelike or needlelike particles [6, 9-11]. Although coke B displays lower real density than coke A, it provides higher VBD values for all fractions except for -200 mesh particles. Coke B particles revealed lower aspect ratio and higher compactness and roundness values than did coke A. Since these factors affect particle flowability, coke B has better packing behaviour which most likely compensates the effect of coke density and results in higher VBD values. For -200 mesh particles, on the other hand, coke A with better flowability factors and lower porosity resulted in higher VBD.Table V. Shape factors, texture and VBD of coke particlesParticlepropertiesCoke type and size (mesh)-6+14 -14+30A B A BAspect ratio 1.86 1.69 1.87 1.74 Compactness 0.607 0.657 0.719 0.761 Roughness 0.802 0.766 0.915 0.957 Sphericity 0.406 0.4 0.678 0.794 Roundness 0.41 0.474 0.527 0.569 %Porosity 28.73 25.98 23.41 19.51 VBD 0.841 0.953 0.927 1.02ParticlepropertiesCoke type and size (mesh)-30+50 -200A B A BAspect ratio 1.99 1.75 2.02 2Compactness 0.707 0.766 0.663 0.638 Roughness 0.95 0.963 0.93 0.885Sphericity 0.707 0.804 0.583 0.507 Roundness 0.5 0.567 0.437 0.427 %Porosity 21.34 20.74 3.3 4.64 VBD 0.919 1 0.969 0.945 Compression tests were carried out for four formulations to study the influences of size distribution on the compaction behavior of paste. The formulations were prepared using two coke types with different particle size distributions and three coke/pitch ratios, as shown in Tables II and III. Figure 2 shows the average curves obtained from three compression tests for each paste formulation. It may be observed that there is a meaningful difference among these curves and the test is capable of illustrating the effects of materials variations on the paste compression behavior. When using coke A, the final achieved density decreased by increasing the content of large fractions; while the formulation with higher percentage of fine particles revealed higher apparent density compared to the reference granulometry. These observations agree with other studies where it was reported that green apparent density increases when using higher amounts of fine fraction and using suitable amount of pitch [7]. Small and fine particles display better filling ability to the inter-particle voids which lead to improved density. In addition, by increasing the fine content, more binder matrix is available to fill the coke pores. However, fine content beyond a specific upper limit may not have any significant effect on the green density [8] or may reduce it due to more inter-particle friction and particle bridging [9]. For the three pastes made with coke A, the trend of VBD of the coke blends is the same as that of green apparent density. Both VBD and green apparent density are observed to increase with increasing the fine fraction.The pastes with the same particle size and pitch content, but different sources of coke, showed quite separated curves. This may be related to particle characteristics, as observed in the caseFigure 2. Compression curves with variations in paste formulations and coke source (K: Coke A, 5% large more than reference; L: Coke A, 5% fine more than reference; M: Coke A, reference granulometry; N: Coke B, reference granulometry). of VBD results. In the present study, the interesting result is that coke A with more elongated and rough particles and lower bulk density provided samples with higher green apparent density, as shown in Tables V and VI. These results agree with other studies where it was reported that although aggregate bulk density is an indication of porosity, packing and size distribution in a powder bed, there is no consistent correlation between aggregate bulk density and green apparent density [7]. On the other hand, other studies reported that irregular shape and rough surface of particles up to 12 mm prevent the movement in a viscous medium and affect the final anode properties [12]. This misleading may be related to the fact that the flow behavior of particles is different in the presence of binder matrix. The inconsistency between particle porosity and bulk density is another reason for this contradiction [11]. In addition, some open pores of coke A may be filled with binder matrix which increases the green apparent density. The results show that VBD cannot be used alone to show the compression behavior. In other words, cokes with higher vibrated bulk density will not necessarily result in denser anodes.Table VI. Density and porosity of green samplesSample Helium pycnometry GAD g/cm 3VBDof blend%Porosity Referencesize-Coke B 1.875 1.498 1.18 20.11 Referencesize-Coke A 1.88 1.572 1.162 16.38 5% more large-Coke A 1.893 1.551 1.147 18.07 5% more fine-Coke A1.847 1.592 1.219 13.8105101520253035400.911.11.21.31.41.51.61.7P r e s s u r e (M P a )Apparent density (g/cm 3)Generally, the compression tests used in this study could be used to investigate the influences of materials properties and paste formulation on the compression behavior of paste during forming process. The data and curves obtained from this particular test provide a better knowledge of the paste behavior when it is formed by hydraulic pressing and may be used for modelling the compaction behavior.The percentage of porosity in green samples was determined using the green apparent density and pycnometry results. Table VI shows the density of green core samples measured by helium pycnometry compared with the green apparent density. This comparison could reveal the volume fraction of open pores within a porous material. Porosity of green samples can therefore be calculated using equation (1):%ܲݎݏ݅ݐݕൌሺு ௬௧௬ሻିீு ௬௧௬ൈ100 (1)where He pycnometry and G AD are density measured by pycnometer, and green apparent density, respectively. The results of helium pycnometry confirmed the green apparent density measured for pressed samples. It was observed that, increasing the porosity level in the pressed samples results in reducing their green density, as shown in Table VI. However, sample with 5% more fine particles has higher GAD but lower helium density than sample with 5% more large particles. This may be related to the fact that some pores may be blocked by the binder matrix to create closed pores which increases the volume of the material measured by pycnometer and reduces the helium density.ConclusionsPaste characterization may be used as an indicator to estimate anode quality. Paste compression test is sensitive to variations of raw materials properties. Compression behavior, as a paste property, may be used to correlate paste formulation and physical properties of coke to its compactability. Shape factor and texture of the particles influence the bulk density of coke and may be used to describe the compactability of the particle bed. Vibrated bulk density, however, is not the only factor which controls the density after compaction.AcknowledgementAuthors would like to acknowledge the financial support and collaboration of Alcoa. A part of the research presented in this paper was financed by the Fonds Québécois de la Recherche sur la Nature et les Technologies (FQRNT) by the intermediary of the Aluminium Research Centre – REGAL.References1. D.L. Belitskus “An Evaluation of Relative Effects of Coke Formulation and Baking Factors on Aluminum Reduction Cell Anode Performance” (Paper presented at the 122nd TMS Annual Meeting, Warrendale, Pennsylvania, 1993), 677-681.2. W.K. Fischer et al., “Determining Prebaked Anode Properties for Aluminum Production,” Journal of Metals, 39 (11) (1987), 43-45.3. C. Jonville et al., “Influence of Coke Source on Anode Performance,” Journal of Metals, 47 (8) (1995), 23-24.4. R.C. Perruchoud, M.W. Meier, W.K. Fischer and W.H.P. Schmidt-Hatting, “Anode Properties, Cover Materials and Cell Operation” (Paper presented at the 130th TMS Annual Meeting, Warrendale, Pennsylvania, 2001), 695-699.5. ASTM D4292 – 06, “Standard Test Method for Determinationof Vibrated Bulk Density of Calcined Petroleum Coke”, Annual Book of ASTM Standards, 05.02 (2006), 558-561.6. D. Belitskus, “Standardization of Calcined Coke Bulk Density Test” (Paper presented at the 111th AIME Annual Meeting, Warrendale, Pennsylvania, 1982), 673-689.7. Kirstine Luise Hulse, Anode Manufacture: Raw Materials, Formulation and Processing Parameters (Sierre, Switzerland, R&D Carbon, 2000), 122-147.8. T. Vidvei, T. Eidet and M. Sorlie, “Paste G ranulometry and Soderberg Anode Properties” (Paper presented at the 132nd TMS Annual Meeting, San Diego, CA, 2003), 569-574.9. Randall M. German, Particle packing characteristics (Princeton, NJ, Metal Powder Industries Federation, 1989), 56-59.10. R. Bowers, S. Ningileri, D.C. Palmlund, B. Vitchus and F. Cannova, “New Analytical Methods to Determine Calcined Coke Porosity, Shape, and Size” (Paper presented at the 137th TMS Annual Meeting, New Orleans, LA, 2008), 875-880.11. B. Vitchus, F. Cannova, R. Bowers and S. Ningileri, “Understanding the Calcined Coke VBD- Porosity Paradox” (Paper presented at the 137th TMS Annual Meeting, New Orleans, LA, 2008), 871-873.12. V.A. Sverdlin, G.F. Vedernikov and V.K. Fyodorov, “Optimization of Technological Parameters of Aluminum Production Pot Anode Block Vibration Forming” (Paper presented at the 121st TMS Annual Meeting, 1992), 725-730.。